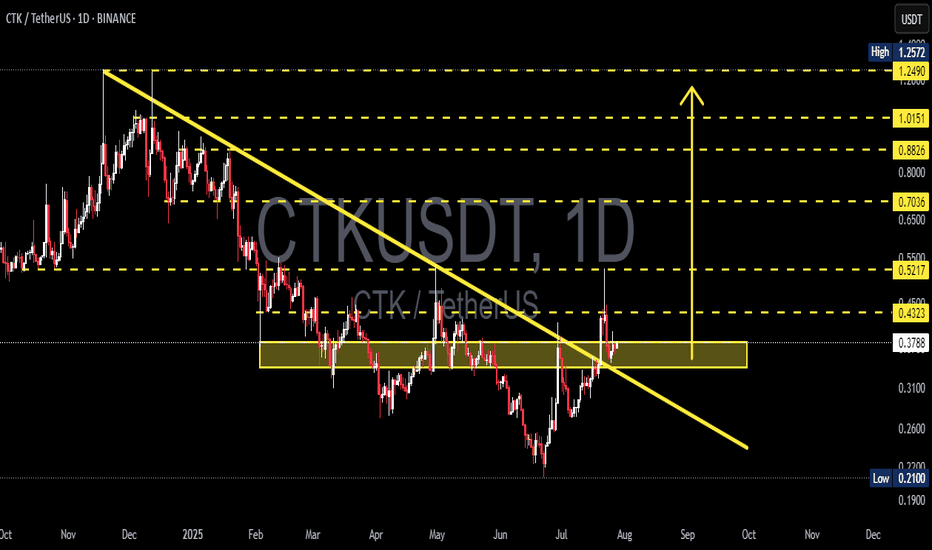
CTKUSDT at Critical Retest After Major Trendline Break!CTK/USDT has successfully broken out of a long-term descending trendline that has dominated the price since November 2024, signaling a potential trend reversal from bearish to bullish. The price is now retesting a crucial supply-turned-demand zone in the $0.36 - $0.39 area, which now acts as new support.
📊 Pattern and Price Structure
Descending Trendline Breakout: A clear breakout above the long-term downtrend, indicating the start of bullish sentiment.
Key Zone (Yellow Box): The $0.36 - $0.39 area previously acted as resistance multiple times and is now being tested as support.
Potential Reversal Pattern: The overall structure resembles a possible Inverse Head & Shoulders, with a neckline around $0.43.
---
🟢 Bullish Scenario
If the price holds above $0.36 and breaks through the minor resistance at $0.4323:
Next bullish targets are:
$0.5217
$0.7036
$0.8826
Up to $1.0151 as a major historical resistance
A breakout above $0.4323 with strong volume would confirm the bullish continuation.
---
🔴 Bearish Scenario
If the $0.36 support fails to hold:
Potential downside levels to watch:
$0.31
$0.26
Down to the key low at $0.21
A breakdown of this zone would invalidate the reversal setup and suggest continuation of the downtrend.
---
📌 Conclusion
CTK is at a critical decision point. The breakout from the downtrend is an encouraging signal, but its validity depends on whether the price can hold the new support and push above the next resistance. Volume confirmation will be key to identifying the next move.
#CTKUSDT #CryptoBreakout #AltcoinAnalysis #TrendlineBreakout #TechnicalAnalysis #SupportResistance #CryptoSetup #BullishReversal #CTKAnalysis
Ctkusdtbuy
CTK/USDT Still Strong 💪
The current market structure for CTK/USDT remains bullish. I anticipate a potential 20-40% bullish movement in the upcoming days. However, please note that this statement is based on personal observation and should not be considered as financial advice. Invest wisely and conduct thorough research before making any trading decisions. 🚀📈🔥
Ctk | Perfect Breakout CTKUSDT
Breakout has already been confirmed
Now we will Buy on Retest,
It is to be seen whether the retest will be successful or not, take the entry only on the successful retest, the activity of the buyers must be displayed at the retesting point.
When you see Bullish Candles (Momentum Candle) at the Retesting Point, take Trade only.
This was our opinion, Allah knows best.
Remember: We only give ldea's from our
experience and knowledge, it does not
mean that it will be 100% correct, the
market is always unpredictable, anything
can happen anytime.
Always trade with your own research and
knowledge. If You Are Satisfied With Our
Work Then Join.
CTKUSDT Posible To Bounce Back!CTKUSDT technical analysis update.
CTKUSDT possible to bounce back from the current support zone, If the price breaks below $0.68 then we can expect a significant correction.
Buy zone :$0.780 - $0.810
Stop loss: $0.70
TP 1: $0.870
TP 2: $0.945
TP 3: $1.06
TP 4:$1.28
Always keep stop loss
CertiK (CTK) coin forming bullish BAT | A good buy opportunityHi friends, hope you are well and welcome to the new trade setup of CertiK (CTK) coin with US Dollar pair.
Previously we had a nice harmonic trade of CTK:
Now On a 2-hr time frame chart, CTK is very close to complete the final leg of bullish BAT pattern.
Note: Above idea is for educational purpose only. It is advised to diversify and strictly follow the stop loss, and don't get stuck with trade
CTK/USDT 15 Minutes ANALYSISHi guys, This is CryptoMojo, One of the most active trading view authors and fastest-growing communities.
Do consider following me for the latest updates and Long /Short calls on almost every exchange.
I post short mid and long-term trade setups too.
Let’s get to the chart!
I have tried my best to bring the best possible outcome in this chart, Do not consider it as an
Entry:- $1.10-$1.12
Target:- 8-10%
SL:- $1.088
Lev:- 10x to 20x
This chart is likely to help you in making better trade decisions, if it did do consider upvoting this chart.
Would also love to know your charts and views in the comment section.
Thank you


