Gold longterm - cup and handle - update the handle to the cup (which started forming since 2009) is almost completed... could see a rise in 2021 Q1/Q2
if it is a perfect cup it could go up to 2.700 - or 2.450
CUP

RMG BreakoutThis is a technical trade on the breakout with the spac of Romeo. I will follow this one closer with stop loss and plan to make it a quick trade until I know more about it. RMG is breaking out with very high volume, this is a SPAC in the EV space is potential could be a strong player for Romeo. "RMG Acquisition Corp in a $1.33 billion deal, the companies said on Monday.
The deal is expected to raise $384 million for Romeo, which includes an investment of $150 million from investors such as The Heritage Group and Republic Services." This is more a technical trade based on news and hype, but it will generate a nice market cap.

ITC is ready to Take Off!NSE:ITC
Bullish view on ITC as it has given a breakout to a Cup pattern.
Target- 250
Stop Loss- 200

COTIUSDT is going to be bullishCOTI trend formed a nicely cup and handle pattern and is going to be bullish

Power Up WorldWith the Vaccine soon to be Online this Chart is looking Fantastic. Covid Has put a Hurting on mines and production is gonna be in Full demand The worlds Power plant are in Great need Uranium.
So with some Volume Short term and long term Macro Chart Look like they are Warming up double Bottom cup Formation Handel to Lift off like to enter somewhere near 12.60 on volume

$BEWLooking for BeWhere to possibly complete a cup set up reaching its last all time high. Looking at the fib retrace we can see our resistance points clearly labelled. The only thing is on the hourly $bew looks like it might of printed a head and shoulder pattern so we could potentially have a bearish short term but long term my prediction is bullish. T
Tough stonk to chart.
Good luck all.
High risk... as usual.
BeWhere Holdings Inc. announces follow up 6,500-unit order from Tenna

UNFI / BTC potential C&H UNFI / BTC
🌟 Techincal Analysis 🌟
Potential C&H pattern
Price after break neckline of pattern jumped to 1.618 fib level from there we can see small rejection
If the price dropped again to support that will be agood buy (high reward and small risk trade)
This is not financial advice
Good luck and happy trading 🌹


CHFJPY [SHORT] Inverse Cup & HandleInverse cup & handle formed, wait for retest of neckline looking at a nice long drop down after that.

Dash forming a potencial Cup & handle patternHello everyone,
this is just quick update for DASH as it looks like it is forming a potencial Cup & handle pattern.
For further DASH technical analysis check the chart below and updates in it
ChaChain
-------------
Disclaimer:
I´m not registered or licensed in any jurisdiction whatsoever to provide investing advice or anything of an advisory or consultancy nature, and therefore I´m unqualified to give investment recommendations. Always do your own research and consult with a licensed investment professional before investing. This communication is never to be used as the basis of making investment decisions, and it is for entertainment purposes only.
KEYWORDS
dash , dashbtc, trading, bitcoin , bitcointrading, profitable trading, profittrading, profit trading, secret, divergence, bull divergence, bear divergence, divergencetrading, divergence trading, trading strategy, how to trade bitcoin , bitcoin trades, bitcoin trading, make profit, take profit, trading strategy, trading technique, successful, successful trader, successful technique, successful strategy, successful secret, how to trade, trend analysis, technical analysis , indicators, rsi , relative strenght index, let it rain, successful life, easy strategy, easy trading, easy technique, make money, crypto investing, investing, crypto, cryptocurrency, cryptocurrencies, mentoring, money, chartart, beyond technical analysis

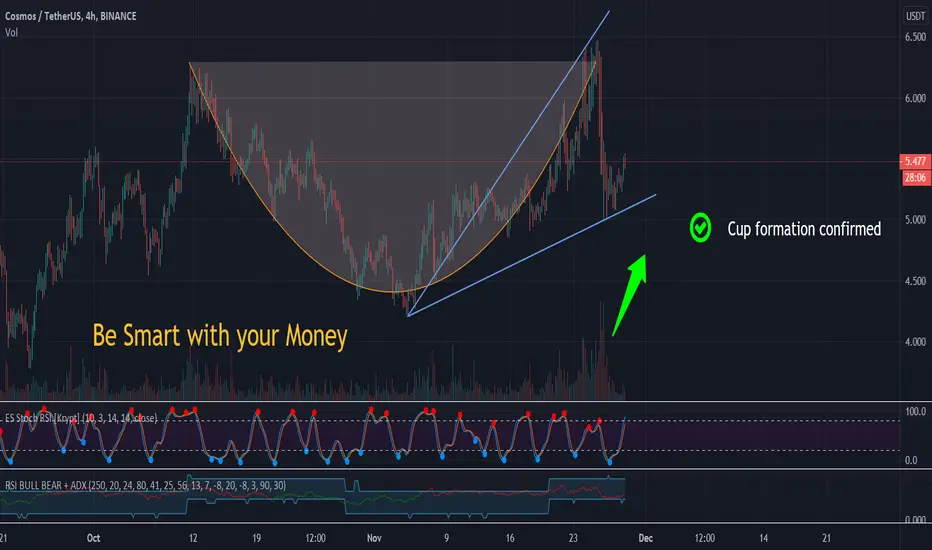
ATOM/USDTATOM is going to be bullish for now to form the cup structure then we are going to hunt a fortune out of it so stay tuned we are going to do magic with it :)

NWC/USDT is going to be bullishNWC is going to be bullish while the cup formation is going to be completed and the ladder structure highly supports the trend

SPX500 is going to be in favor of bulls s&p500 in 4h time frame is bull related and the cup formation is getting completed while the classic indicators are also confirm its bullish trend
we have to wait for trend to cross the plotted resistance

Chainlink Posible cup and handle forming *Disclaimer: no soy analista financiero ni son consejos de inversión, solo soy un gamer jugando al trading.

Curve Cup forming on 4hr chartthe biggest coins that have exprienced the most lost have started to go up, yesterday we saw sushi and swerve pump the later by 150%. from the chart we can see curve forming a cup after which there will be a drop for the handle. i longed curve at 0.48.

JMIA cup and handle playStill bullish from JMIA. was able withstand sell-off from the 1st vaccine news. Cup and handle forming once again.


The Giant Cup. Clarus CorporationAre we waiting for the handle or is it just a Cup? Over 5 years in the making. My prediction is up.

CRV/USDT Exponential Growth With Room For MoreCRV is booming at the moment. Over the last 10 days CRV has seen over 130% increase in value, without any indication of stopping soon. We might see the price hitting $1 over the next week.
When we zoom out we can clearly see that the price is following a Cup pattern, with the lows being hit late October.
Volume has seen a big increase as well since then. People are clearly eye-balling CRV.
The token is relatively new on Binance, so its definitely not dead yet. Keep this one on your watchlist!

jse:dcp Dischem potential CUP & HANDLE ?Will we see the cup & handle upside?
To support >R22 on Dischem is the recent inverse head & shoulders on Dischem (weekly) that also plays out to >R22
