CUP


First post - Cup&Handle pattern? Hi traders and crypto friends, it´s BohemianCrypto,
after months watching and learning i decided to publish my fist idea. It´s not trading advice, I´m still waiting for market to decide, but I see obvious Cup and Handle pattern which i have not seen published by anyone else here...
So my question is what do you thing? Do you see the same in short or am I basically outside the bowl?
Marry Christmas and may the force be with us next year.
Cheers

Cup & Handle 30mXRP cup and handle.
Breakout or retest of further downside support imminent.
Who knows?
Good luck.

Lend is forming a Cup&handle pattern!Clearly made it and heading to achieve high targets
• neck line price is a short term target
• second line price is the mid-term target
• highest price line is a long term target
Follow us in Twitter for more updates!


LUNBTC 4HLUNYR; retest breakout and forcing to the resistance, there is C&H on the horizontal plane. It can try 1600sats and above, Break a leg!


EURCAD - Great bullish setup!Great coiling action here on EURCAD. Price has been coiling upwards for months. When it finally pops, there will be a massive train to the upside. If you ever wanted to go to the moon, now's your chance.
** Remember, we do not predict future price. We react to current price movements based on our interpretation of past data.

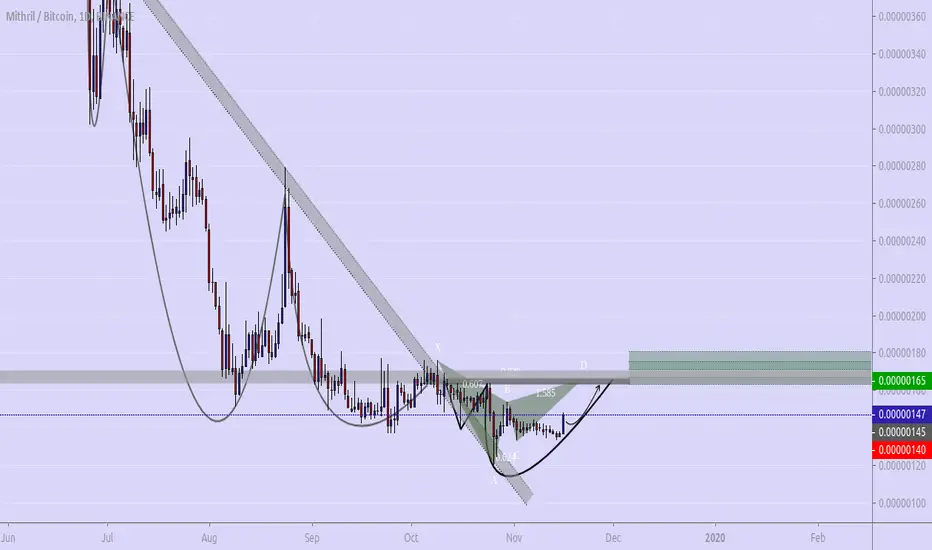
MITHBTC 4HMithril; gartley pattern's d leg, big H&S and breakout.. the possibility of seems like bullish trend, break a leg!


DUSKBTC 4HDUSK can may breakout and then new bullish trend starting with the Gartley/Bat patterns.. break a leg!


DNT / BTC Perhaps a shape will be formed Bowl +200DNT / BTC It is possible that a Bowl shape will be formed (Saucer, Rounded Bottom) + 200% Price at historical minimum. 3 months in sideways movement. Price begins to rise slowly. It seems that we are at the beginning of the 3rd phase of the formation of the "Bowl" figure.
The goal is the zone of the resistance level of the "Bowl". Further on the situation, how the price will fix.
Stop Loss - the level of support of the "Bowl".
_________________________
I will describe this figure a bit:
The Saucer shape, or as it is often called the Chalice, the Rounded bottom is a long-term figure that predicts long-term growth that looks like a concave arc. The figure is found on large timeframes. In most cases, on weeks, but on instruments that quickly go through their cycle (cryptocurrency), they can occur on a daily timeframe.
The rounded bottom is quite rare, but very reliable bullish pattern. Typically, a pattern is formed at the end of a long-term “bearish trend” and usually gives a signal of a market reversal.
It should be noted that the ideal symmetry of the figure is not a prerequisite. The main thing is the presence of its key components: the descent of the price, the bottom, the rise in price and the breaking of resistance.
Ideally, the formation of the “Saucer” pattern usually occurs in a narrow price range, in a calm market with the least volatility, when a trend reversal occurs smoothly, without strong price spikes. If, however, price spikes occur, then very soon the price will return to its usual range. The figure signals the long-term nature of the formation of a trend movement. The longer the figure forms in time, the stronger the signal is considered. The most reliable are the figures formed on weekly charts for at least several months. The older the time frame, the more reliable the signal. The rounded bottom is a long-term figure, and can stretch on the chart for a long period.
_____________________________
Stages of the formation of the figure.
The Saucer figure consists of the following steps:
1) The descent of the price is the first phase of the figure. Price decline trend with a gradual slowdown. In the classical case, it should be a smooth arc, but in practice its shape can be flat or contain, on the contrary, correction minima and maxima. The main condition in this case is the gradually decelerating pace of price reduction.
2) The bottom is the lowest point of prices. It is the geometric center of the figure. It should be located on a gentle bottom (smooth bottom, without peaks). Although sometimes such a formation as the "Thorn" down or closed squeezes comes across at the bottom. The main thing is that these local formations do not violate the overall picture of the figure and movement in the global. If the lower point of the price forms the so-called platform on the chart, then the trading volumes gradually decrease, and at the moment of the price jump up sharply increase. Another surge in prices may be a signal to buy if the maximum of current prices is higher than the previous maximum.
3) Ascent of the price - after the minimum follows the ascent, which should ideally be symmetrical to the descent, and should last as long as the first phase (the descent of the price). There is a tendency to increase prices with a gradual acceleration.
4) The intersection of the resistance formed by the upper boundary of the whole figure (passes through the maximum point of the figure at the beginning of the period of its formation) is an additional confirmation of the rounded bottom and the final phase of the formation of the figure. After breaking through and fixing the price, the resistance level turns into a support level.
________________________________
Setting sales targets when working with a figure.
At the expense of selling goals, there is no exact opinion among traders. You need to understand that this is a long-playing figure and has a pronounced bullish character. In most cases, phase 3 (price rise) ends with phase 4 breaking through resistance and fixing the price above it. Thus fully confirming this figure of technical analysis. But you need to understand that this does not always happen! There are exceptions.
It is also important if the price is being traded in your favor, and according to the plan you should already fix the profit, then it is advisable to stay in position while you get additional profit instead of the planned one.
There should be a strategy and plan. At the same time, your strategy and plan should be plastic from market situations.
I trade such formations like that. As a rule, I enter the 2nd phase on the “Day”, but then when the trading volume starts to increase (the beginning of the 3rd phase is the ascent). It is very important not to "stay at the bottom" for a long time. Time is money.
I leave the position in 2 stages according to the situation:
a) I sell a large part of the position at about 70% just before the resistance (before the start of phase 4).
b) if the price failed to break through or gain a foothold, I will sell the remaining 30% of the market.
c) if the price was able to break through the resistance and consolidate. Resistance has become support. I buy back at the pullback prices the same 70% that I sold in advance before the resistance. Very often the price differs by a couple%. The confirmed new support gives great potential for further growth. It is very important that there is not a big gap between the sale and the purchase. If the price after confirmation of support has gone high - I trade the remaining 30% of the position.
_____________________
You related ideas see more ideas where such figures are also formed

MANA / BTC Formed figure Bowl (Saucer) First target + 110%Perhaps a Bowl figure will be formed (Saucer, Rounded Bottom). Target of the figure + 110% Price at historical minimum. 4 months in lateral movement. Price begins to rise slowly. It seems that we are at the beginning of the 3rd phase of the formation of the "Bowl" figure.
The first Sales Goals are the “Bowls” resistance level zone. 600-670 satosh.
Further on the situation, how the price will fix. Other target levels are the levels of the previous horizontal channel that existed for more than a year. 900, 1200, 1500, 1800 satosh.
Stop Loss - the level of support of the "Bowl". (red level) - about 300 satoshi
___________________________________
I will describe this figure a bit:
The Saucer shape, or as it is often called the Chalice, the Rounded bottom is a long-term figure that predicts long-term growth that looks like a concave arc. The figure is found on large timeframes. In most cases, on weeks, but on instruments that quickly go through their cycle (cryptocurrency), they can occur on a daily timeframe.
The rounded bottom is quite rare, but very reliable bullish pattern. Typically, a pattern is formed at the end of a long-term “bearish trend” and usually gives a signal of a market reversal.
It should be noted that the ideal symmetry of the figure is not a prerequisite. The main thing is the presence of its key components: the descent of the price, the bottom, the rise in price and the breaking of resistance.
Ideally, the formation of the “Saucer” pattern usually occurs in a narrow price range, in a calm market with the least volatility, when a trend reversal occurs smoothly, without strong price spikes. If, however, price spikes occur, then very soon the price will return to its usual range. The figure signals the long-term nature of the formation of a trend movement. The longer the figure forms in time, the stronger the signal is considered. The most reliable are the figures formed on weekly charts for at least several months. The older the time frame, the more reliable the signal. The rounded bottom is a long-term figure, and can stretch on the chart for a long period.
_____________________________
Stages of the formation of the figure.
The Saucer figure consists of the following steps:
1) The descent of the price is the first phase of the figure . Price decline trend with a gradual slowdown. In the classical case, it should be a smooth arc, but in practice its shape can be flat or contain, on the contrary, correction minima and maxima. The main condition in this case is the gradually decelerating pace of price reduction.
2) The bottom is the lowest point of prices . It is the geometric center of the figure. It should be located on a gentle bottom (smooth bottom, without peaks). Although sometimes such a formation as the "Thorn" down or closed squeezes comes across at the bottom. The main thing is that these local formations do not violate the overall picture of the figure and movement in the global. If the lower point of the price forms the so-called platform on the chart, then the trading volumes gradually decrease, and at the moment of the price jump up sharply increase. Another surge in prices may be a signal to buy if the maximum of current prices is higher than the previous maximum.
3) Ascent of the price - after the minimum follows the ascent, which should ideally be symmetrical to the descent, and should last as long as the first phase (the descent of the price). There is a tendency to increase prices with a gradual acceleration.
4) The intersection of the resistance formed by the upper boundary of the whole figure (passes through the maximum point of the figure at the beginning of the period of its formation) is an additional confirmation of the rounded bottom and the final phase of the formation of the figure. After breaking through and fixing the price, the resistance level turns into ur
_______________________________
Setting sales targets when working with a figure.
At the expense of selling goals, there is no exact opinion among traders. You need to understand that this is a long-playing figure and has a pronounced bullish character. In most cases, phase 3 (price rise) ends with phase 4 breaking through resistance and fixing the price above it. Thus fully confirming this figure of technical analysis . But you need to understand that this does not always happen! There are exceptions.
It is also important if the price is being traded in your favor, and according to the plan you should already fix the profit, then it is advisable to stay in position while you get additional profit instead of the planned one.
There should be a strategy and plan. At the same time, your strategy and plan should be plastic from market situations.
I trade such formations like that. As a rule, I enter the 2nd phase on the “Day”, but then when the trading volume starts to increase (the beginning of the 3rd phase is the ascent). It is very important not to "stay at the bottom" for a long time. Time is money.
I leave the position in 2 stages according to the situation:
a) I sell a large part of the position at about 70% just before the resistance (before the start of phase 4).
b) if the price failed to break through or gain a foothold, I will sell the remaining 30% of the market.
c) if the price was able to break through the resistance and consolidate. Resistance has become support. I buy back at the pullback prices the same 70% that I sold in advance before the resistance. Very often the price differs by a couple%. The confirmed new support gives great potential for further growth. It is very important that there is not a big gap between the sale and the purchase. If the price after confirmation of support has gone high - I trade the remaining 30% of the position.

Cup And Handle Posted Long Ago Has Now Printed HandleI am dollar cost averaging on various alts and btc now that the long term handle of the giant bullish cup and handle has printed a bottom.
I am scaling in with targets that are at least double the current prices so that I can have a 1 RRR without using a stop. I am not going to try to time things very carefully but will deliberately just buy at consistent intervals in order to mechanically get an overall average that reflects the vwap for the next few months.
I am going to spread out the scaling in process so I am still adding to positions well into next year, I especially want to be sure to save ammo so I can add on December 17 this year which could be a very important date for cryptos.
I am especially interested in building a large eth position, it should be at least half my overall position in cryptos. I am also interested in ltc which has a lot of room to move to the up side from here.

BAT There is a "Cup" Coin in the channel Option "Cup with handleAfter the breakdown of the horizontal channel, the figure "double bottom" appeared on the chart of the coin. This was in the previous trading idea for this coin in the update. Profit amounted to + 76%
The situation is now.
At the moment, we have the shape of a cup (saucer, rounded bottom) which, at the 4th stage (breaking through the resistance of the "bowl"), can go up to the indicated resistance. Another option - a downward channel can be drawn, which will act as the "Handle" of the "Cup with handle" figure . It is very important that if we follow the second scenario, the red zone is important, which will act as a support for the global channel. Roughly speaking, a successful retest of it will give a signal in growth over the entire width of the channel, and this is + 160%. But if support breaks through, then in the near future it will be better to forget about trading this coin. This is a very unlikely scenario. But this must always be remembered.
At the expense of the coin, the coin is very strong fundamentally , this is one of those coins that I constantly trade and increase my position. I’ve been trading for almost a year and a half BAT.
For example, this trading idea for trading BAT / BTC in a horizontal channel for November 2018.
I showed all three options on the chart. The most likely is the "Cup with handle."
______________________________________
A bit about the figures on the charts
Saucer shape (Bowl, Rounded bottom).
The Saucer shape, or as it is often called the Chalice, the Rounded bottom is a long-term figure that predicts long-term growth that looks like a concave arc. The figure is found on large timeframes. In most cases, on weeks, but on instruments that quickly go through their cycle (cryptocurrency), they can occur on a daily timeframe.
The rounded bottom is quite rare, but very reliable bullish pattern. Typically, a pattern is formed at the end of a long-term “bearish trend” and usually gives a signal of a market reversal.
It should be noted that the ideal symmetry of the figure is not a prerequisite. The main thing is the presence of its key components: the descent of the price, the bottom, the rise in price and the breaking of resistance.
Ideally, the formation of the “Saucer” pattern usually occurs in a narrow price range, in a calm market with the least volatility, when a trend reversal occurs smoothly, without strong price spikes. If, however, price spikes occur, then very soon the price will return to its usual range. The figure signals the long-term nature of the formation of a trend movement. The longer the figure forms in time, the stronger the signal is considered. The most reliable are the figures formed on weekly charts for at least several months. The older the time frame, the more reliable the signal. The rounded bottom is a long-term figure, and can stretch on the chart for a long period.
_________________________________________
Stages of the formation of the figure.
The Saucer figure consists of the following steps:
1) The descent of the price is the first phase of the figure. Price fall trend with a gradual slowdown. In the classical case, it should be a smooth arc, but in practice its shape can be flat or contain, on the contrary, correction minima and maxima. The main condition in this case is the gradually decelerating pace of price reduction.
2) The bottom is the lowest point of prices. It is the geometric center of the figure. It should be located on a gentle bottom (smooth bottom, without peaks). Although sometimes such a formation as the "Thorn" down or closed squeezes comes across at the bottom. The main thing is that these local formations do not violate the overall picture of the figure and movement in the global. If the lower point of the price forms the so-called platform on the chart, then the trading volumes gradually decrease, and at the moment of the price jump up sharply increase. Another surge in prices may be a signal to buy if the maximum of current prices is higher than the previous maximum.
3) Ascent of the price - after the minimum follows the ascent, which should ideally be symmetrical to the descent, and should last as long as the first phase (the descent of the price). There is a tendency to increase prices with a gradual acceleration.
4) The intersection of the resistance formed by the upper boundary of the whole figure (passes through the maximum point of the figure at the beginning of the period of its formation) is an additional confirmation of the rounded bottom and the final phase of the formation of the figure. After breaking through and fixing the price, the resistance level turns into a support level. When crossing the resistance, the volume rises as a rule.
______________________________________
The figure "Cup with handle" (Mug).
The "Cup with handle" ("Mug") figure is a figure of the continuation of the trend. It is very reminiscent of the Saucer reversal pattern, but without the handle. One of the main features of this figure is that it is a continuation figure precisely on an uptrend.
The figure got its interesting name because of the external similarity with the shape of the cup.
The "Cup with handle" figure (Mug) consists of two parts:
1) Bowls.
2) Pens.
This pattern appears on an uptrend. A pattern begins to form when a bottom forms in a concave arc on an uptrend. This is the first part of the figure - "Bowl". Upon completion, another bottom is formed, much smaller than the first. The edges of the "Bowl" and "Handle" are at approximately the same level (form resistance). Upon completion of the formation of the "Handle", the price breaks the resistance line from the bottom up and the figure is successfully confirmed.
________________________________________
Shape shaping and volume change.
As a rule, the volume at the bottom of the "Cup" has a minimum value. "Cups" should gradually increase. The prices of pens should be reduced during formation. On the breakthrough of resistance, “Pens” are of high importance. When the resistance of the figure breaks through.
_________________________________________
You need not only to know the rules of technical analysis, but also to understand what and how and why it works.
All successful bidding.

Total Market Cap: Cup with handleSo I have had this idea that the total market cap itself might be forming a cup with handle pattern. At the very most i can see the rounding bottom and now it seems we have begun to retrace.
Typically we don't like to see too much of a retrace on the way down something around a 50 percent retrace from the low to high is preferred.
On the chart i have noted that right now we are at the 61.8% retrace from the low to high but that's only on linear scale if we check log scale you would see that we are sitting near the 50 percent retrace.
Log scale does however ruin the left side of our rounded bottom which is why i have kept the basis of this trade on the linear scale.
A measured move if we ever did break out bullishly would bring the Crypto market cap very close to all time highs which would be a great time for any of the cryptocurrencies worth their weight.
Too deep of a retrace downwards could ruin this set up but it's still worth looking at.
Ignore the trendline i plotted on the MACD it was drawn on a smaller timeframe. *
