VIDTUSDT // cup-handle formationAlthough there is a cup-handle formation on the chart, the targets are drawn according to Fibonacci. Let's look for closings above the blue line.
Cup And Handle

“Grab Stock Nears Breakout: Cup and Handle Eyes $6.86 Target”Grab Holdings (GRAB) stock is currently developing a cup and handle pattern on its daily chart, a bullish technical formation indicating potential for a significant rally. This pattern, marked by a rounded cup followed by a consolidating handle, suggests building momentum. A breakout above the key resistance level of approximately $5.58 could trigger a sharp upward move, targeting around $6.86 based on the pattern’s projected rise. This setup positions Grab stock for a potential skyrocketing surge, making it an intriguing opportunity for traders as it nears this critical breakout point.

NASDAQ INDEX (US100): Bullish Reversal Confirmed?!
I see 2 very strong bullish reversal confirmation on US100 on a daily.
First the market violated a resistance line of a falling channel.
Then, a neckline of a cup & handle pattern was broken.
Both breakouts indicate the strength of the buyers.
We can expect a growth at least to 20300 resistance.
❤️Please, support my work with like, thank you!❤️

Shiba INU is repeating the history !!!!Trading patterns often tend to repeat themselves due to market psychology, investor behavior, and historical price movements. The current Shiba Inu chart appears to be mirroring past formations, reinforcing the cyclical nature of technical patterns.
Stage 1, a Falling Wedge, was completed , similar to previous corrections on September 24 before a breakout.
Stage 2, a Cup and Handle pattern, was confirmed , resembling earlier bullish continuation setups in August 2024.
Now, the market awaits, Stage 3, the formation of a W pattern , which historically signals strong upward momentum in September 2024.
Finally, Stage 4, an Inverted Head and Shoulders pattern expected, could mark a significant breakout, much like previous bullish reversals.
These recurring patterns highlight the importance of studying historical charts to anticipate future price movements.

usdollarUS Dollar made a cup handle. It is currently retesting this area. It may reach the points I marked.

EURAUD: Bearish Correction Continues EURAUD formed a huge cup and handle pattern and has broken through its neckline on a 4-hour time frame.
This breakout confirms a change in market sentiment and suggests a potential bearish reversal in the near term.
It is possible that the market will continue to decline and could soon reach the 1.7000 level.

SYNUSDT // cup and handle formationAlthough there is a cup and handle formation on the chart, the targets are drawn according to Fibonacci.

Cup and Handle breakout - Shiba INUShiba INU is giving breakout of cup and handle pattern ... Keep a watch on it

FART/USDTSEED_WANDERIN_JIMZIP900:FART Cup and Handle on 1D chart! 🔥
✅ The cup is nicely rounded - a sign of bullish accumulation.
✅ Neckline around 0.5561-0.6119 (V-WVWAP) - price is hitting resistance here.
✅ Volume is increasing during the breakout attempt - which is a positive signal.
✅ Possible "eye" - price may correct back to support before further growth.
Targets:
🔹 Cup height measurement: Bottom around 0.3194, neckline 0.5561, gap ~0.2367.
🔹 Target level: 0.5561 + 0.2367 = ~0.7928 (possible bull target on patterning confirmation).
🔹 Fib levels may help - I see first resistance around 0.6176.
How to play it?
📌 Ideal entry: after a pullback to neckline (retest) or during a confirmed breakout with volume.
📌 Stop-loss: Below the last low of the neckline or below the neckline if it becomes support.
📌 Confirmation.
Overall, the pattern looks very bullish, but the reaction to 0.5561-0.6119 will be important. If it fails there, the ears may go lower.

NAA RUKEGAPIDILITE Fut broke out of triangle as well as cup n handle pattern on an hourly charts with consolidation & OI build up.
Could b bought with mentioned stoploss & target.

cup and handle pattern may be forming on the weekly chart HOOD"Potential Cup and Handle Pattern on NASDAQ:HOOD
A cup and handle pattern may be forming on the weekly chart of HOOD. The cup formation can be seen from August 2024 to February 2025, with a high point of around $55.00 and a low point of around $14.00. The handle formation started in late February 2025 and is currently ongoing.
Key levels to watch:
Resistance: $50.00
Support: $39.00
A breakout above the resistance level could confirm the pattern, potentially leading to a bullish trend. Keep a close eye on this stock! Weekly Daily and Monthly all look good.
#HOOD #cupandhandle #stockmarket #trading"

MTLUSDT // Cup handle formationAlthough there is a cup-handle formation on the chart, the targets are determined according to Fibonacci. As a formation condition, we need closings above 0.804.

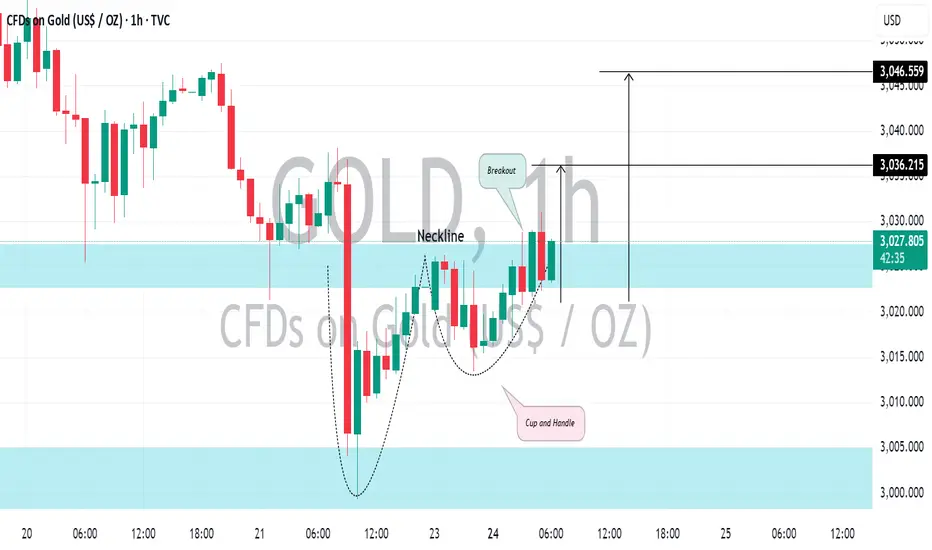
GOLD (XAUUSD): Confirmed Bullish ContinuationGold is currently experiencing a strong upward trend in trading. Following a recent all-time high, the market started a correctional movement.
The price respected the strong support level at the 3000 psychological level, leading to a bullish wave that broke above a neckline of a cup and handle pattern acting as a local horizontal resistance.
This is expected to lead to further bullish movement, with the next target set at 3046.
CHFJPY: Pullback Trade From Key LevelAnother pair that appears attractive for buying at a key support level is 📈CHFJPY.
Following a test of an important intraday structure, the price has formed a cup & handle pattern.
A bullish breakout above its neckline serves as a solid bullish confirmation.
It is likely that the pair will continue to climb and reach the 170.24 level in the near future.

#USOIL - #Crudeoil - Buying @ CMP 68 for Target 68.5-69- 70-73+#USOIL - #Crudeoil - Buying @ CMP 68 for Target 68.5-69- 70-73+
SL 67.5
#Swing Trade - #hourly Trade - #Cup and handle Breakout
Holding Period 2-3 weeks
or
Target or SL

LGDTF // cup handle formationAlthough there is a cup handle formation image in the chart, the targets are drawn according to Fibonacci. As a formation condition, we should look for closings above the 0.2752 level.

Inverted cup and handle formationLong term up trend is turning into an inverted cup and handle. Hopefully it breaks out cause I’m long in this sector. But all other quantum stocks are showing downward trend even post quantum stocks. And current market trends are not helping.🤞

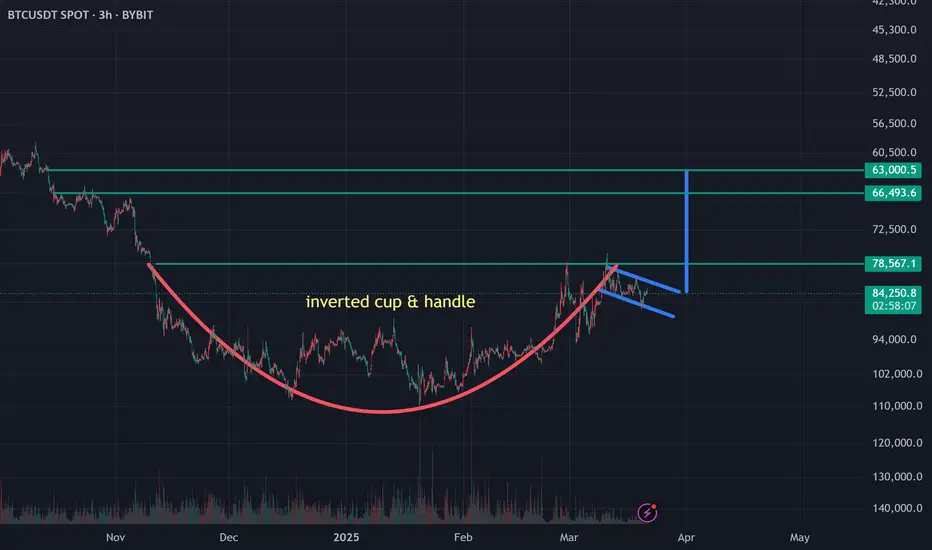
Bitcoin Inverted Cup & handle Bitcoin is forming an inverted Cup & handle pattern with a target of 63k-66k. I was surprised to see this when I inverted the chart. Just sharing with you what I see, and I hope the pattern changes and we continue to go up. However the highest probability at the moment is further downside, but we may still have a bounce toward 89k-91K before seeing the blood.
INDHOTEL | Buy if close above 835 with SL @799Disclaimer:
This is not financial advice. Please do your own research or consult with a financial advisor before making any investment decisions. Investments in stocks can be risky and may result in loss of capital.

NZDUSD: Bullish Continuation From Support 🇳🇿🇺🇸
There is a high chance that NZDUSD will continue growing today.
The price formed a cup & handle pattern on a key daily support.
We can expect a bullish movement at least to 0.5774 resistance.
❤️Please, support my work with like, thank you!❤️

GBPAUD: Pullback From ResistanceThe GBPAUD pair appears to be showing a bearish trend on the 4-hour time frame after testing a significant intraday resistance.
An inverted cup & handle pattern was formed on the hourly chart, along with strong bearish momentum this morning, indicating a potential downward movement.
I believe that the market may retrace back to the 2.0500 support level at the very least.

Manappuram Finance: Long-Term Breakout Alert🚀 Manappuram Finance: Long-Term Breakout Alert! 🚀
🔹 CMP: ₹230 | Stop Loss: ₹170 | Target: ₹290 | ₹372
🔍 Why Manappuram Looks Promising?
🔄 Technical Breakout:
A rounding bottom (or cup-and-handle) breakout with a well-defined base formation—indicating potential long-term upside.
📊 Accumulation Opportunity:
As the breakout occurs, retests may follow—offering an ideal opportunity for staggered accumulation. Long-term investors can accumulate on dips for better risk-reward.
📈 Target Calculation:
📏 Pattern Depth Approach: Targets are derived from the depth of the rounding bottom or cup-and-handle pattern.
📊 Fibonacci Validation:
✅ Retracement Levels (Stop Loss Zones): ₹138 & ₹230
✅ Extension Levels (Price Targets): ₹81.5, ₹230 & ₹138
📌 Pro Tip: Plot these Fibonacci levels yourself to build conviction and sharpen your analysis.
📉 Risk Management:
Stop loss is carefully aligned with Fibonacci retracement to minimize downside risk.
Follow strict position sizing to safeguard capital—especially in volatile market conditions.
⚠️ Caution: Market conditions can shift quickly—adjust your position size based on your risk tolerance and trading plan.
📍 Outlook:
With a confirmed breakout and strong technical alignment, Manappuram Finance offers a high-probability swing trade for long-term investors.
📣 What are your thoughts on this breakout? Share your views in the comments!
📅 Follow for more technical insights and market updates.
📈 #ManappuramFinance #BreakoutAlert #TechnicalAnalysis #SwingTrading #InvestmentOpportunity
📉 Disclaimer: As a non-SEBI registered analyst, I encourage you to conduct independent research or consult a financial professional before making investment decisions.

RIPPLE (#XRPUSDT): Bullish Reversal Confirmed?!Ripple's price saw a positive shift following the SEC officially dropping the lawsuit against XRP.
The price broke through a key daily resistance level, indicating a bullish trend reversal. A cup and handle pattern was formed with a broken horizontal neckline, suggesting a confirmed bullish reversal.
I anticipate further growth in the market, with potential targets at 2.69 and 2.94 levels in the near future.
