NEM // cup handle formationAlthough there is a cup handle formation image on the chart, the targets are drawn according to Fibonacci. We need closings above 48.08 as a formation condition.
Cup And Handle

USDJPY Tests Cup and Handle Formation Ahead of FOMCUSDJPY has formed a cup-and-handle pattern just below the 150 level. Today, the Bank of Japan kept interest rates steady at 0.50%. Wage negotiations so far indicate a 5.46% wage increase, which Governor Ueda described as "somewhat strong." Combined with rising food prices, the risk of further inflation has increased. Japan's inflation has remained above 2% since early 2022, and there’s no sign of that trend reversing anytime soon. In light of these factors, the BOJ is likely to consider a rate hike in May.
However, today’s market focus will shift to the FOMC. The Fed is expected to raise its inflation and unemployment forecasts while lowering its growth forecast due to the anticipated effects of new U.S. trade policies. These stagflationary pressures are likely to keep the Fed’s rates elevated for an extended period. If the dot plot shows only one rate cut this year (instead of two as projected in December), the dollar index may begin to recover.
The 150 level remains a key resistance for USDJPY. A confirmed breakout of the cup-and-handle pattern has the potential to push the pair towards the 153 level over the medium term. However, given the underlying fundamentals favoring BOJ rate hikes, any upward movement will likely be slower and more choppy, unless of course FOMC goes full hawkish.
On the downside, if the Fed is less hawkish than expected, 149 (and sliglty below)becomes the critical support to watch. A break below 149 would invalidate the bullish pattern and shift momentum to the downside for USDJPY.

NZDJPY: Bearish Movement Confirmed 🇳🇿🇯🇵
All Yen pairs look bearish after the early morning BoJ interest
rate decision and press conference.
NZDJPY formed an inverted cup & handle pattern on a 4H
after a test of a key daily resistance.
High momentum bearish candle indicates a strong bearish sentiment.
I think that the price may drop at least to 86.2 level.
❤️Please, support my work with like, thank you!❤️
I am part of Trade Nation's Influencer program and receive a monthly fee for using their TradingView charts in my analysis.

DOW JONES INDEX (US30): Pullback From Resistance
Dow Jones Index looks bearish after a test of a key daily/intraday resistance.
An inverted cup & handle pattern on that on an hourly and a strong
intraday bearish momentum this morning leaves clear bearish clues.
I think that the market can retrace at least to 41580 support.
❤️Please, support my work with like, thank you!❤️

EURAUD: Bearish Correction Continues📉EURAUD has broken through and closed below an important horizontal support level during the day.
The highlighted blue section also serves as the neckline for an inverted cup & handle pattern.
This violation suggests that there may be further decreases in price.
The next support level to watch for is at 1.7110.

Ethereum (ETH/USD) Bearish Setup | Cup and Handle BreakdownEthereum (ETH/USD) Chart Overview:
Ethereum (ETH/USD) has formed a Cup and Handle pattern on the daily timeframe, but instead of breaking out bullish, price is showing signs of a bearish breakdown.
The handle formation has taken the shape of a rising wedge, a typical bearish continuation pattern.
Price has broken below the wedge support, confirming potential downside momentum.
Technical Analysis:
1. Cup and Handle Breakdown: A failed bullish continuation suggests that sellers have taken control.
2. Rising Wedge Pattern: The recent consolidation (handle) formed a rising wedge, which has now broken down.
3. Key Resistance Zone: The $2,869 level is acting as strong resistance, preventing further upside.
4. Breakout Confirmation: ETH/USD has broken below the handle support, indicating a continuation of the downtrend.
Trade Plan:
Short Entry: Below $2,505
Stop-Loss: Above $2,869 (invalidates the setup if price reverses)
Target: $1,700 (previous support and Fibonacci level)
Fundamental Outlook:
Ethereum has faced selling pressure amid broader crypto market uncertainty.
Macroeconomic factors like rising bond yields and regulatory concerns could add to the bearish sentiment.
If Bitcoin faces further downside, ETH could follow suit.
If ETH remains below the breakout zone, we anticipate further downside toward $1,700. However, a reclaim of $2,869 could invalidate this bearish bias.
Must Suport And Let me know your thoughts! Happy trading!


EURCHF: Correctional Movement Started 🇪🇺🇨🇭
EURCHF started a correctional movement after a test of a key daily resistance.
Inverted cup & handle pattern on an hourly time frame on that
provides a strong intraday bearish confirmation.
We can expect a bearish continuation at least to 0.96 today.
❤️Please, support my work with like, thank you!❤️

Exide Pakistan - LongExide is making multiple bullish patterns
1- Inverse head and shoulder
2- Cup and Handle
3- Bullish Flag
4- ABCD pattern
It may go down to 670 at the worst, but may also revert back from here to complete CD leg which may touch 1600.
Short term target: 1100
Medium term target: 1600
Long term target: 2000

Feroz - Long Feroz is making cup and handle formation. Further, it is in an upward trend, breaking which may lead it to go beyond 550 (Exact medium term targets mentioned in chart). In the longer run, (1.5 to 2 years), it may again touch its all time high (900+).

eurusd|foxforexIt has created a very nice cup-handle formation on the EURUSD chart. After the break of the 1.096 level, the targets will be as in the chart.
TP1 1.2000
TP2 1.7500

GBPCHF: Pullback From Support 🇬🇧🇨🇭
There is a high chance that GBPCHF will pullback from the
underlined blue intraday support.
As a confirmation, I see a cup and handle pattern on that
and a breakout of its neckline.
Goal - 1.1367
❤️Please, support my work with like, thank you!❤️
I am part of Trade Nation's Influencer program and receive a monthly fee for using their TradingView charts in my analysis.

Bitcoin going to move to 320K?As the market is cooling down after the Trump rally there is only bearish sentiment left. People calling for ''the liquidation of M. Saylor'', ''the bearmarket'', ''BTC to 0!''
In the chart above we can witness an almost textbook version of a MASSIVE cup and handle pattern. It broke out of the neckline on nov 4th last year and is now on it's path to retest it.
Should it hold i expect the bullrun to continue soon. So see this post as a light at the end of the tunnel.
Target: 320K
Stoploss: sub 70K (there is resistance at 70/66K area)
Rustle


Are altcoins ready to take off ? Hello Traders! 🐺
You might have noticed that I haven't posted in a while—so, why the silence?
Over the past two weeks, we've seen massive market manipulation by whales and major players. In times like these, it's often safer to step back, observe, and let the charts reveal the market’s true direction before making any moves.
But now, I genuinely believe the dump is over. Looking at the BTC.D chart, it's currently forming a bearish pattern right at a key resistance level. That alone is enough for me to say: I'm bearish on BTC.D —and by extension, bullish on altcoins !
Why? Because a rising wedge on the weekly BTC.D chart is a strong signal of a bear trap, suggesting money could soon start flowing into altcoins.
Additionally, in the TOTAL3 chart (which excludes BTC & ETH), we see a massive cup and handle pattern on the weekly timeframe. The price has already broken the neckline and is now accumulating above the support line, potentially gearing up to break past its all-time high and push toward a $3 trillion market cap —which, in my opinion, is a conservative target.
I hope you find this idea valuable! Don’t forget to like and follow for more insights. Your support means the world! 🚀
🐺 KIU_COIN 🐺

USDCAD Tariff War or Currency War? If you can’t beat’em, join’emWhile everyone is worried about tariffs, is this not foreshadowing a bleak future for Canada’s purchasing power? They might want to reconsider the tit for tat rhetoric
Am I the only one who sees this? Goodbye CAD…

US CRUDE OIL(WTI): Price Action Trading📈USOIL may experience a reversal from an important daily support level.
The formation of a cup & handle pattern and a breakout above its neckline on a 4-hour chart suggest that the price is likely to rise.
The target price is 68.50.

ATAT: Breakout and RetestAbout Atour
Atour operates an asset-light, franchise-oriented hotel business model, primarily using a "manachised" approach where franchisees handle capital expenditures while Atour provides management, branding, and technology, supplemented by retail integration within hotel spaces.
What I like
- I remain very bullish over China stocks, as you can tell from my stock picks recently. There is a change in technical chart (HSI above weekly 200sma) and Xi government has increasingly showed interests in reviving China economy, be it more spending or talking to its leaders like Jack Ma. I think this bull run will last, and I will keep building up my positions in Chinese stocks
- Atour being IPO stock has crazy growth rates. 40% YoY over most metrics. And what's crazy is that Atour is asset light! It doesn't build hotels! They just provide management, and integrate retail within the hotel spaces. Super scalable.
- Cup and handle breakout and now retesting.
Trade plan
- Entered a small size. Intend to keep building on it as it acts right.
- Holding period can be months

ALGOUSDT - Weekly LONGThis is a weekly technical analysis for educational purposes on ALGOUSDT. I believe that Algo will revisit the same levels and will be widely discussed during the altcoin bull season. I may be wrong. :)
Regards,

Nifty Trend Direction - CUP and Saucer patternNifty 22119 -Has a CUP and Saucer pattern. Support at 22078 and if the current resistance at 22145 could get through next target is 22270-22280

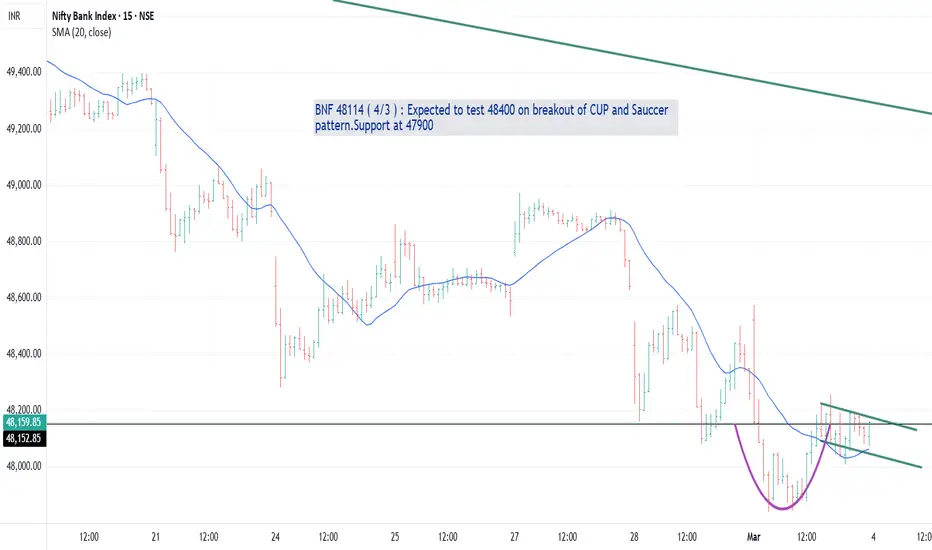
BankNifty Trend DirectionBNF 48114 ( 4/3/2025 ) : Expected to test 48400 on breakout of CUP and Handle pattern.Support at 47900
GOLD (XAUUSD): Bullish After the Market Opening
Friday's turmoil in the White House pumped Gold prices
during the New York session.
Analyzing the intraday price action, I see 2 confirmed bullish signals:
the price broke both the resistance line of a falling channel
and a neckline of a cup & handle pattern on an hourly.
Odds are high, that the price will grow more and reach at least 2864 level
after the opening.
❤️Please, support my work with like, thank you!❤️

Richard Heart defeats the SEC A U.S. district court judge has dismissed the Securities and Exchange Commission’s (SEC) lawsuit against Richard Heart. Judge Carol Bagley Amon ruled that the allegations against Heart lack a connection to the United States.
Heart is known for founding the HEX token, the PulseX trading platform, and the PulseChain blockchain. The SEC initiated legal action against him in July 2023, claiming that the three tokens—Hex (HEX), PulseChain (PLS), and PulseX (PSLX)—were unregistered securities. The commission also accused Heart of misusing $12.1 million of investor funds to indulge in luxury items like sports cars, Rolex watches, and the world’s largest black diamond.
“The alleged misappropriation occurred through digital wallets and crypto asset platforms, none of which were alleged to have any connection with the United States,”
“Case dismissed. Thank you Judge Amon,”
Heart is an American citizen who has been living in Finland for several years. He faces serious charges there, including income tax evasion amounting to hundreds of millions of dollars from June 2020 to April 2024, as well as an assault charge from September. Reports suggest that the tax issues are connected to the launch of certain tokens, while the assault charge stems from an incident involving a minor in February 2021.
Finnish police suspect that he has left the country, and in December, an Interpol red notice was issued for him. In January, authorities in Finland confiscated 20 luxury watches from a third party that allegedly belonged to Heart.
All the while the law enforcement has searched for him, Heart has maintained a presence on social media. “If the haters really wanted to get me down they could raise more than the GETTEX:27M I did for medical research. Write free self help books better than my sciVive and Fix The World. Work in the courts for legal precedent for P2P publishing software. Found things that work flawlessly and become valuable,” he wrote on X in December.
