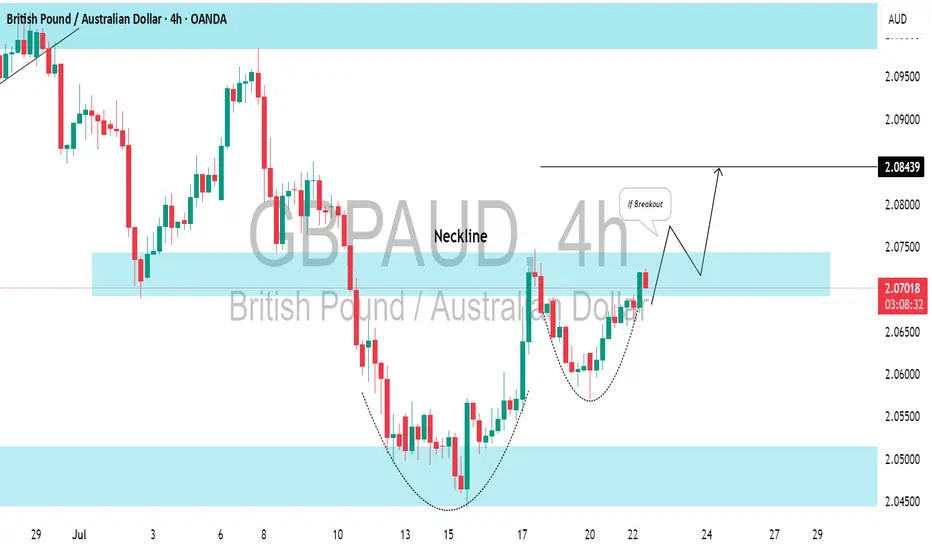
GBPAUD: Another Bullish Pattern⚠️GBPAUD has adhered to a horizontal support level on the intraday chart and has bounced back from it, revealing a strong bullish pattern.
The price has formed a cup and handle pattern and is currently testing its neckline.
Look for a breakout confirmation; a 4-hour candle closing above the 2.0750 level will validate this breakout, leading to an anticipated bullish continuation.
Cup And Handle
NYKAA<>BreakoutA breakout is occurring with increasing volume. A high-volume close above the 221-222 level would confirm the breakout, potentially from a Cup & Handle pattern.
Keeping on radar.

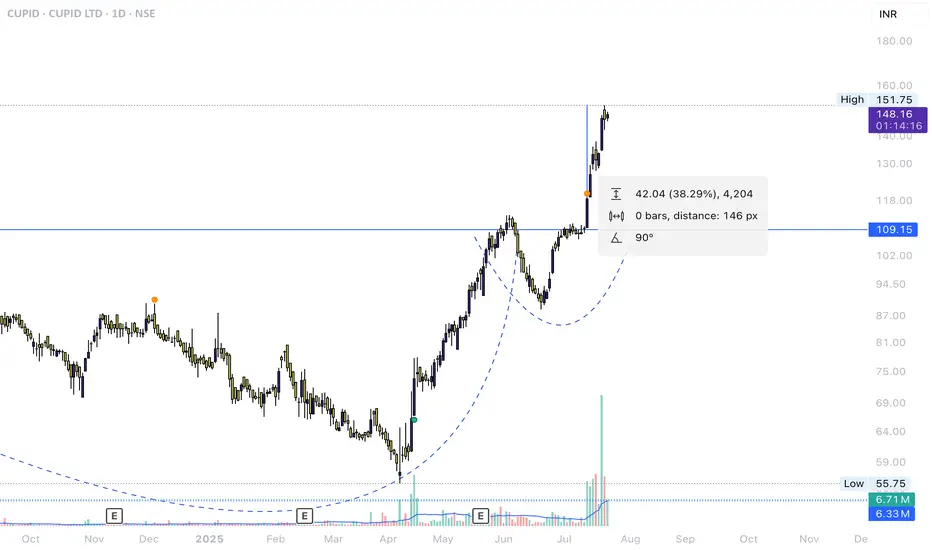
CUPID.NSE ReturnsNSE:CUPID Chart shared idea just 1 week ago.
Breakout trading worked perfectly, More rise can be seen if the stock consolidated near the recent highs and breaksout.
Dollar Index (DXY): Time to Recover
It looks like Dollar Index is going to recover after a yesterday's
rapid fall.
The market reached a key support and formed a cup & handle pattern on that.
We can expect a pullback at least to 98.09 level.
❤️Please, support my work with like, thank you!❤️

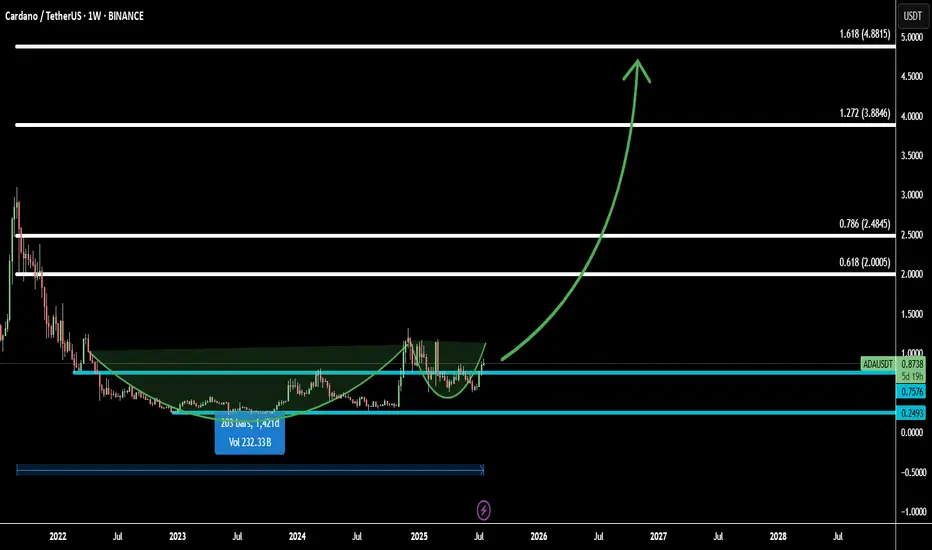
ADA Ready to Fly: Cup & Handle Pattern + Fibonacci TargetsCardano (ADAUSD) is forming a classic cup and handle pattern on the higher timeframe, signaling a bullish continuation setup that often precedes strong upward moves.
Combined with Fibonacci extensions, the breakout potential is high, with multiple target levels mapped out:
Target 1: 0.618 Fib – 2.0005 - confirms breakout strength
Target 2: 0.786 Fib – 2.4845 - momentum continuation zone
Target 3: 1.272 Fib – 3.8846 - full extension based on pattern measurement
Target 4: 1.618 Fib – 4.8815 - aggressive bull target for long-term holders
If ADA breaks the handle with strong volume, it could initiate a powerful rally. This setup is ideal for swing traders looking for a high-probability entry.
Let’s catch the next big move together! 🚀
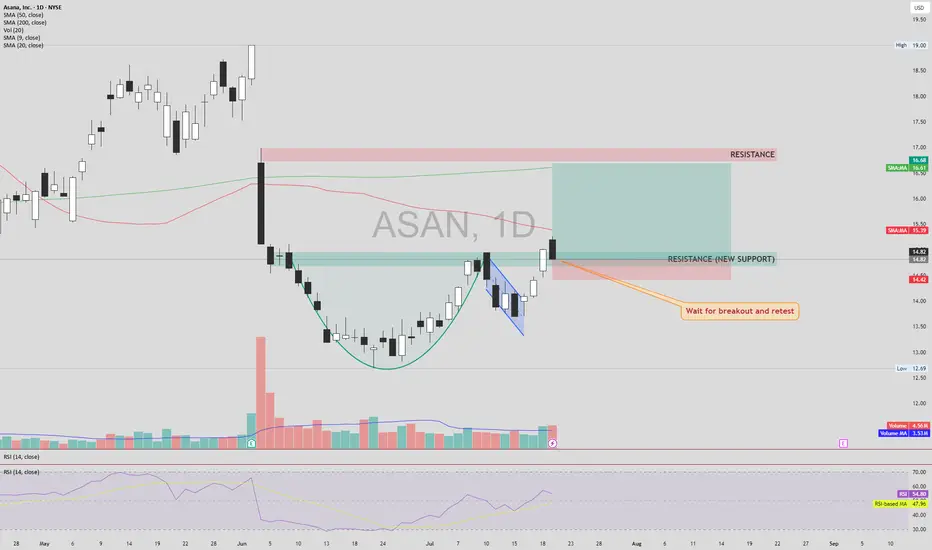
ASAN – Cup & Handle Breakout SetupASAN NYSE:ASAN has formed a classic Cup & Handle pattern and has broken above the neckline, turning previous resistance into new support. However, the price is still trading below both the 50 and 200 SMAs, which calls for cautious confirmation.
📌 Entry: Wait for a confirmed retest of the breakout level (new support) with healthy volume.
🔒 Stop Loss (SL): Just below the newly established support zone, in case of a failed retest.
🎯 Take Profit (TP):
First TP: Next visible resistance zone above.
If this level breaks and holds (confirmed by retest),
Next TP: The large gap overhead could potentially be filled.
This setup provides a strong risk-reward structure if confirmation aligns with volume and momentum. Avoid early entry without retest.
⚠️ DYOR (Do Your Own Research) – This is not financial advice.
GBPCAD juicy very juicyThis is an A+ setup!!
Not perfect but clean.
I dont usually see a cup and handle a lot but this one certainly looks juicy.
SL behind the pivot, mmmhhh just juicy.

WIPRO & the Squiggle Prophecy Drew this green curve a year ago just for vibes… and WIPRO said “bet.”
Now it’s casually forming a monstrous cup, heading toward the ₹320 neckline.
If that breaks, we might see ₹370+, and maaaybe ₹480-ish… ish. Idk. Don’t ask me. Ask the squiggle.
Hopefully the squiggle squiggle prophecy holds true and I make more money lmao 💸
📈 When price action meets prophecy.

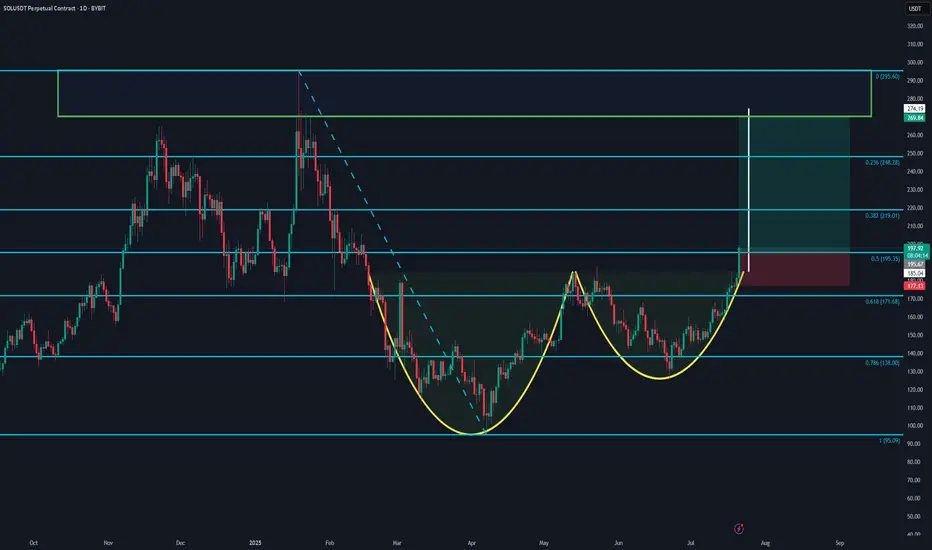
SOLUSDT - Cup and Handle Formation Targeting $295A classic Cup and Handle pattern is forming on the daily chart of SOLUSDT. The breakout above the $195 neckline signals potential continuation toward the $295 target, based on the depth of the cup.
🔹 Key levels:
Entry: $196
Stop Loss: $177
TP1: $219 (Fib 0.382)
TP2: $248 (Fib 0.236)
TP3: $274 - $295 (full target zone)
📊 The Fibonacci retracement levels align well with potential resistance zones. A clean breakout and daily close above $200 could further validate this setup.
Not financial advice. DYOR.
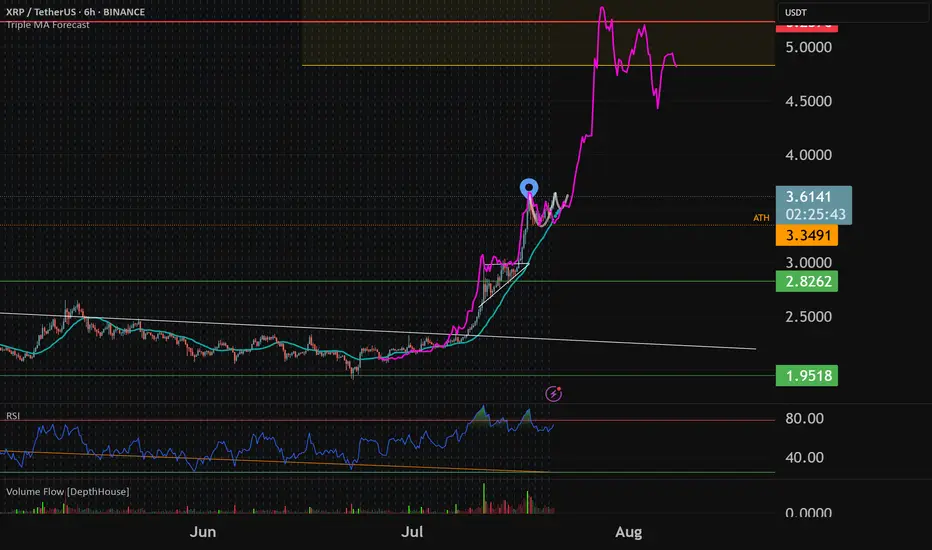
XRP To $5-$5.25Typical XRP breakout pattern. Expect cup and handle consolidation to keep forming this week before a quick move to $5 before th end of the month. From there i expect a broader market correction but final pt's around $6-7
Aiozusdt trade opportunityAIOZUSDT is shaping a potential cup and handle pattern, with price nearing the neckline. A confirmed breakout above this level will validate the bullish setup and trigger momentum towards the projected targets.

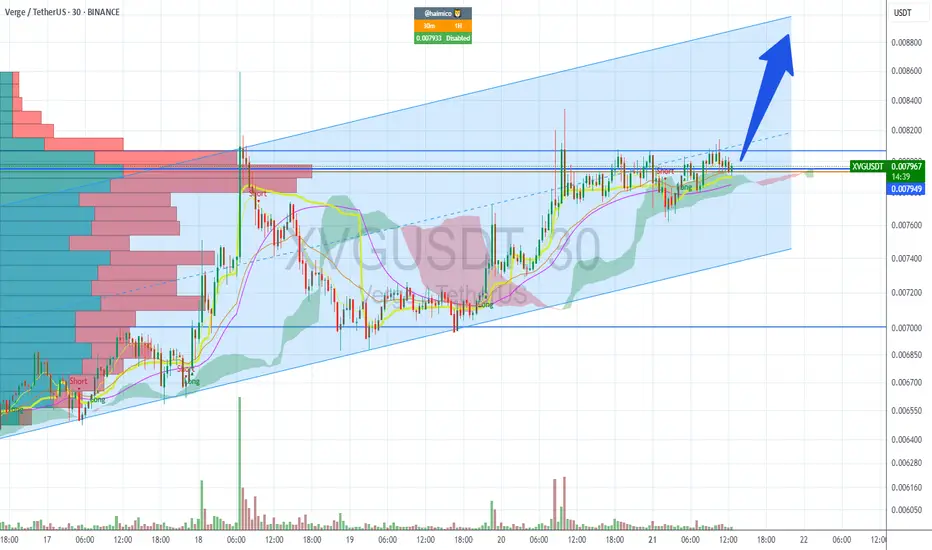
$XVG C&H long setupChart looks like a clear cup & handle. Looking for a breakout to the upside to reach top of the ascending channel...
WIFUSDT strong Bullish formationWIFUSDT is currently developing a classic Cup and Handle pattern, with the handle approaching the key neckline resistance zone. The neckline is acting as a strong barrier, and a confirmed breakout above this level is expected to trigger significant bullish momentum.
Target levels are clearly outlined on the chart. Keep a close watch on this setup, it has the potential to accelerate quickly once the breakout is validated.

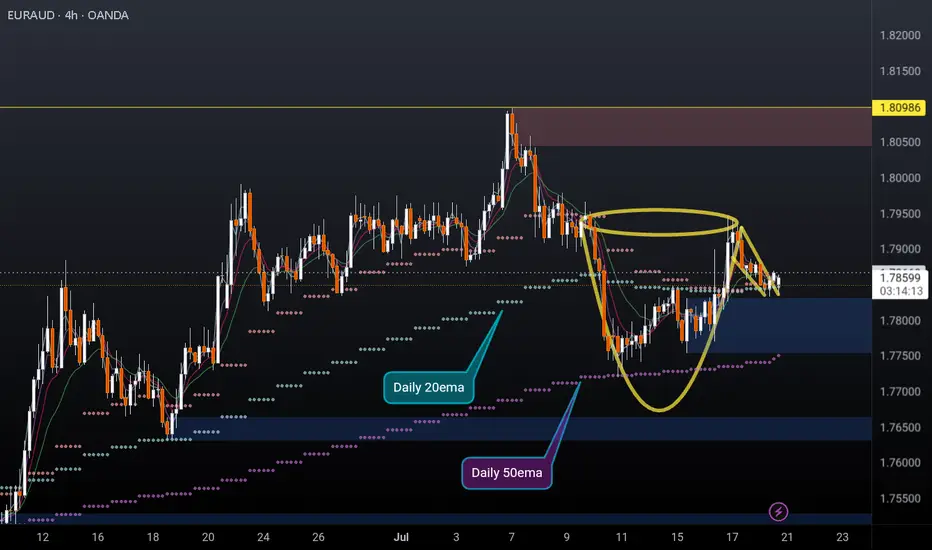
EURAUD 4H cup and handleEURAUD 4H cup and handle formed and possibly breaking out to the upside. Price recently found support off the daily 50ema (overlayed on this 4h chart) and is holding above the daily 10 & 20EMAs (overlayed).
I'm a cat not a financial advisor.
ETH to $12,600I think ETH, with all the current fundamental shifts happening in the past 6 months, is prime to run to the golden pocket, a perfect measured move and cup & handle pattern playing out.
1️⃣ Institutional floodgates opening
Spot ETH ETFs have seen massive inflows—billions flowing in just weeks.
BlackRock and other majors are prepping ETFs that may include staking, turning ETH into an institutional yield asset. This is serious structural demand, not retail hype.
2️⃣ Regulatory clarity coming in hot
The GENIUS Act and stablecoin bills in the U.S. are pushing regulatory clarity into crypto markets fast. This reduces uncertainty and increases appetite for ETH from corporates and funds.
3️⃣ Technicals are clean and bullish
ETH flipped $3,300 into support and is holding strong.
Next major resistances at $3,800–$4,100, with ATH at $4,800 firmly back on the radar.
Short-term structure is clear: higher highs, higher lows, solid volume backing it.
4️⃣ On-chain and supply dynamics
Whales are aggressively accumulating—large wallet inflows confirm that.
Staked ETH keeps hitting new highs (~30% of supply locked), tightening available float.
This supply squeeze + ETF demand = bullish cocktail.
5️⃣ Ethereum’s ecosystem dominance is intact
ETH still hosts the lion’s share of stablecoins and DeFi.
Layer-2 scaling is progressing fast, upgrades like EIP-4844 and Pectra coming soon, reducing gas fees and improving UX—critical for future adoption.

DOGE to $2 before EOYCUP & Handle type formation on DOGE, really believe this can run to $2 during alt season which has just started firing its engines ...
BTC.D finally looks toppy.
📈 1. Technical breakout & chart patterns
DOGE has recently broken out of a long-term descending channel, forming a classic double-bottom pattern—a strong reversal signal.
It also cleared the key $0.20–$0.21 resistance zone, with on‑chain data pointing to rising futures/open interest and reduced sell pressure
⚖️ 2. Macro & regulatory tailwinds
The passage of the Genius Act in the U.S. House brought “clear‑cut regulation” for crypto, boosting confidence and driving DOGE higher—rising ~8% on the news
Broader crypto bull sentiment—fueled by possible Fed rate cuts and favorable legislation—has pushed altcoins like DOGE ahead this week
🧠 3. On‑chain & investor activity
Charts show increasing futures & spot trading volumes, along with expanding whale activity and holders staying profitable—collectively suggesting strong demand and low sell pressure
Network usage is also up: wallet interactions and momentum have accelerated as DOGE crosses these technical thresholds
💬 4. Community & utility factors
Dogecoin maintains a vibrant community, boating meme-driven social capital, plus occasional celebrity mentions (e.g., Elon Musk), keeping public attention
Its growing real-world usage in tipping, payments (e.g., Shopify, AMC, Tesla merch), and even institutional products—like the Grayscale Dogecoin Trust—adds fundamental backing

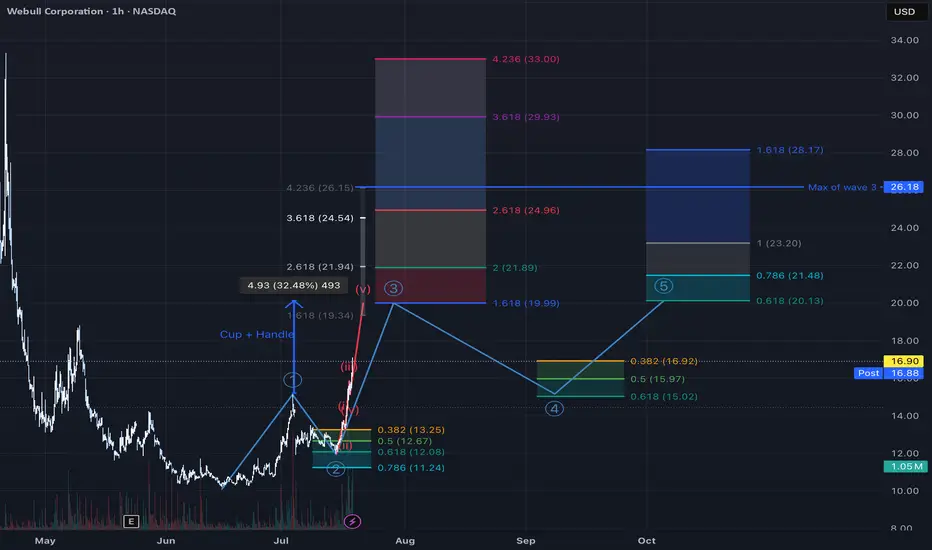
Conservative target zone estimationNASDAQ:BULL my first target zone estimation using elliot wave theory. Obviously, I tried to focus on the most conservative alternative.
Due to the additional cup and handle pattern i am pretty confident that wave 3 reaches at least $20 within the next few days.
NEIROUSDT heavy pump ahead after Cup and Handle breakout#Boom This Cup and Handle which is already formed here gonna pump price crazy and now is just waiting for a valid breakout to the upside and huge #pump after that is cooking so i open 1:4(Risk: Reward) signal here as you can see.
DISCLAIMER: ((trade based on your own decision))
<<press like👍 if you enjoy💚

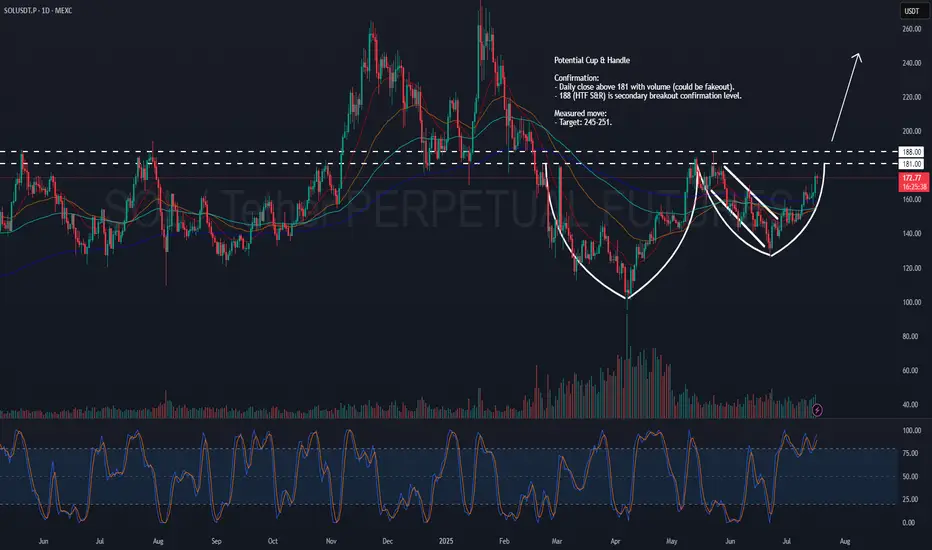
SOL – Potential Cup & HandleSOL might be shaping up to be a pretty clean cup & handle .
Could be big, but we’re not there just yet.
Levels I’m watching:
181: Main neckline. Want to see a daily close above with volume.
188: HTF S&R — secondary confirmation. Clears this, and I’d say the move is real.
Measured target:
Somewhere around 245–251 if it plays out.
Let’s see if SOL has more in the tank.
BTC Possible Short-Term Scenario (Long)Sharing my view on the BTC short-term scenario.
Main idea here is to find confluence of the resistance levels using different technicals.

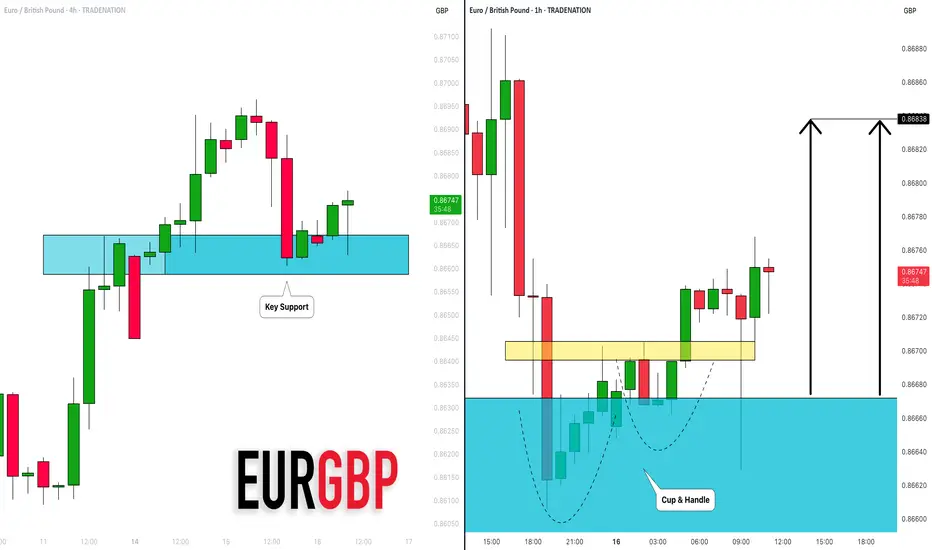
EURGBP: Bullish Move From Support Confirmed?! 🇪🇺🇬🇧
There is a high chance that EURGBP will bounce
from a key intraday horizontal support cluster.
The market looks bullish after UK CPI release this morning.
Goal - 0.8684
❤️Please, support my work with like, thank you!❤️
I am part of Trade Nation's Influencer program and receive a monthly fee for using their TradingView charts in my analysis.
AUDUSD: Consolidation ContinuesThe AUDUSD is currently consolidating within a broad horizontal channel.
A notable bearish response to resistance has occurred, with the formation of a cup and handle pattern leading to a decline.
There is a strong likelihood that the price will soon hit the 0.6500 level.

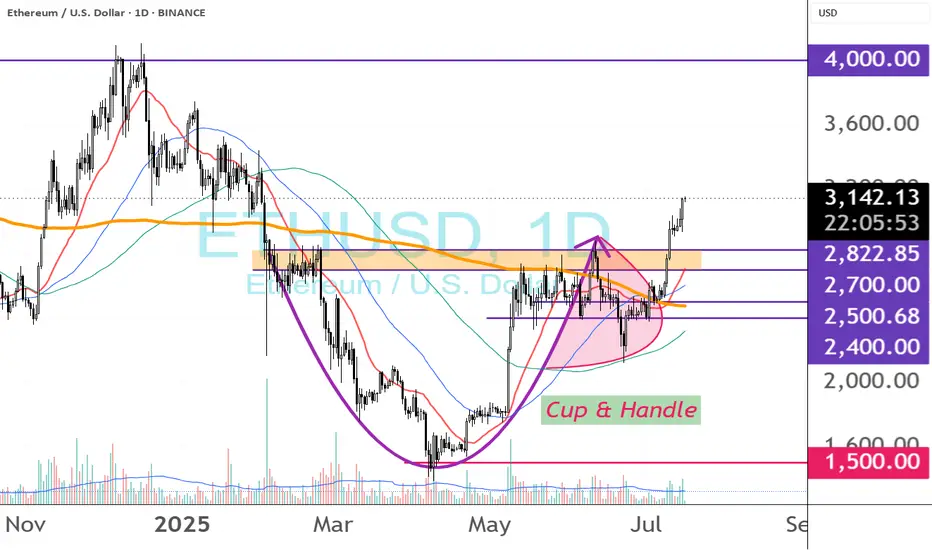
ETH CUP & HANDLE BOWith the cup‑and‑handle pattern that started in February 2025 now pierced above $2,800, the measured move targets the next ceiling around $4,000.