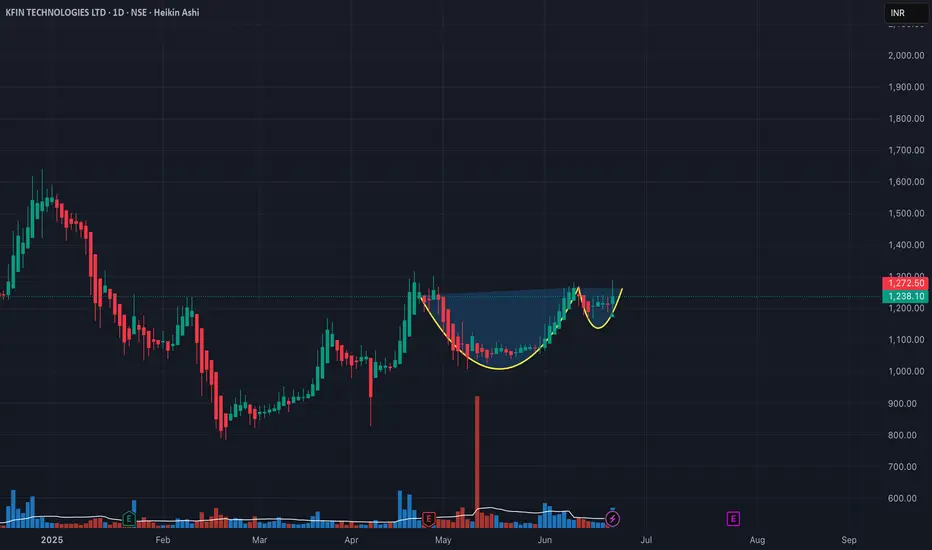
HIMS 1D — This pattern didn’t cook for nothingOn the daily chart of Hims & Hers Health, we’re looking at a textbook cup with handle formation — not just a pattern, but a structure backed by time, volume, and classic price behavior. The base of the cup formed steadily from February to May 2025, and as soon as the curve was complete, price transitioned into a tight consolidation — the "handle" that often masks real accumulation.
Right now, price is testing the resistance area. And it’s not just floating up there — it’s coming in hot: price has already broken through EMA 20/50/100/200 and SMA 50/200. That’s a full stack flip. This isn’t sideways noise — it’s a structural shift in control.
Volume is starting to build as price rises, confirming that demand is real and institutional positioning likely active. We’re watching a breakout zone above the handle — and when that breaks, the structure unlocks with a clear target: $107.25, roughly a 2x move from current levels.
This setup isn’t noise. It’s a long-cooked formation that’s now about to boil over. If the handle holds and price breaks through — the rest is just follow-through.
Cup And Handle

SOARING 20's are you ready for the Blowoff of the century#SPX v Currency in circulation
#Cup&Handle
1929 Echo bubble
AI will increase earnings and GDP
as ASI enters the workplace and Robotics grow us out of Debt
GDP = Number of people * Productivity
Now add an autonomous workforce to this.

SILVER (XAGUSD): Waiting For BreakoutIt appears that ⚠️SILVER is gearing up for a bullish trend.
Analyzing the 4H time frame, I spotted a falling wedge pattern and a confirmed breakout above its upper boundary.
The final hurdle for buyers is the 36.11 - 36.17 neckline of a cup and handle pattern.
If the bulls manage to break and close above this level, it will serve as a significant bullish signal, likely leading to a continuation towards at least 37.00.

QUBT - 2 Formations are in considerationHello Everyone,
Happy Sunday to all.
Today i would like to have a look another Quantum Computing stock which is QUBT.
For the time being price is going up and down between 18 to 21.
I am considering 2 formation in daily chart.
First one is Rounding buttom which is marked as Green:
Target : 40 - 42
If it can break 25.50 and stay for 3 days above it then we can consider this formation and reach to 40 $ level.
Second one is Cup and Handle which is marked as Orange:
First Target : 14.80 - 15.00
Then : 20-21
Then : 30
Final target is : 40.00
All in all i see a good opportunity on QUBT and within a year there is a possibility to hit 40. (Maybe less then a year)
This is just my thinking and it is not invesment suggestion , please do not make any decision with my anaylsis.
Have a lovely Sunday to all.

USDCAD LONG SETUPI am expecting the US Dollar to be bullish this week.
Weekly closed as a bullish engulfing.
Expecting price to make a minor pull back on the daily before taking making another bullish push.
Price is also showing a bullish divergence on the daily, which furthers strengthens my perspective.
The 2H TF also illustrates somewhat of a Cup-and-Handle Candle Stick Formation
Will look to enter longs on the lower TFs (1-4h)

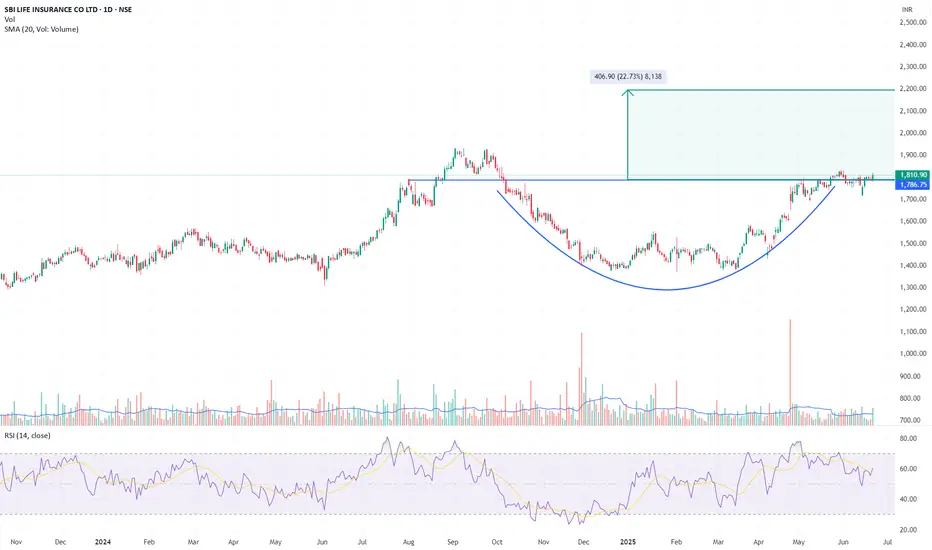
SBI Life – Long-Term Base Breakout, Targeting ₹2,200Chart Context:
SBI Life has broken out above a long-term horizontal resistance at ₹1,786 after forming a rounded accumulation base over ~10 months. Breakout was confirmed with above-average volume and a successful retest.
Trade Setup:
Breakout level (neckline): ₹1,786.75
Breakout candle close: ₹1,810.90 (+1.20%)
Target: ₹2,200 (22% upside from breakout)
Stop-loss: ₹1,745 (just below retest lows)
Risk-reward: ~1:3
Volume & RSI:
Volume > 20-day average
RSI > 60 and rising, confirming strength
Strategy:
Initiate long with partial position now. Add on dips toward ₹1,775–₹1,780 with tight stop. Trail SL if price sustains above ₹1,850. Reassess at ₹2,050–₹2,100 zone.
Disclaimer:
Not a recommendation. This idea is based on technical patterns and is meant for educational purposes. Do your own due diligence.
COIN: Weekly Cup & Handle Setup• Long-Term Bullish Trend and Pattern : The price action for COIN exhibits a clear long-term bullish trend, contained within an ascending channel (demarcated by the green and red dashed trendlines). A prominent "Cup and Handle" pattern appears to have developed, with the blue arc delineating the "cup" phase and the subsequent period of consolidation forming the "handle."
• Current Consolidation and Key Levels : Following the completion of the "cup" and a test of its rim, the price has entered a consolidation phase, depicted as a descending channel (white box) which constitutes the "handle." The current price is positioned near the upper boundary of this consolidation, resting above an "Intermediate support" level at $270 and a "Short-term Support" zone between 220- 230.
• Defined Support and Resistance Zones : Multiple significant horizontal support and resistance levels are identified. Stronger, more historical support zones are marked at 145−165 and 115−130. Overhead, a "Key Resistance Level" at $350 coincides with the cup's prior high, representing a major hurdle for further upside.
• Projected Price Pathways : The chart outlines an implied bullish continuation scenario (purple dotted path) where the price breaks out of the handle consolidation. This projected path targets immediate levels around 290−300, followed by a potential retest and breach of the $350 key resistance, with a subsequent "Long-Term Target" set at approximately $430 within the confines of the primary ascending channel.
Disclaimer:
The information provided in this chart is for educational and informational purposes only and should not be considered as investment advice. Trading and investing involve substantial risk and are not suitable for every investor. You should carefully consider your financial situation and consult with a financial advisor before making any investment decisions. The creator of this chart does not guarantee any specific outcome or profit and is not responsible for any losses incurred as a result of using this information. Past performance is not indicative of future results. Use this information at your own risk. This chart has been created for my own improvement in Trading and Investment Analysis. Please do your own analysis before any investments.

GBPJPY: Pullback From Trend Line 🇬🇧🇯🇵
I think that GBPJPY may bounce from a rising trend line
that I spotted on a daily time frame.
As a confirmation, I spotted 2 intraday bullish breakouts:
a violation of a resistance line of a falling channel
and a breakout of a neckline of a cup & handle pattern.
Goal - 195.0
❤️Please, support my work with like, thank you!❤️
I am part of Trade Nation's Influencer program and receive a monthly fee for using their TradingView charts in my analysis.

6/18 Gold Analysis and Trading SignalsGood morning, everyone!
Gold traded within a narrow range yesterday, and the buy signal shared during the session yielded profits. From a technical perspective, the market remains in a rebound phase, with key resistance around 3403. If the price breaks and holds above this level, there’s a good chance we’ll see a move toward the 3418–3428 zone today.
During the Asian and European sessions, the trading bias should remain on the buy side, while in the U.S. session, it may be more favorable to shift toward short setups, mainly due to expectations surrounding the upcoming Fed interest rate decision—an outlook we discussed yesterday.
Key intraday ranges to watch:
Asian–European session: 3362–3413
If price reaches the 3425–3435 zone before the U.S. session, short opportunities may emerge
As always, manage your positions carefully and adapt to key levels as price unfolds.

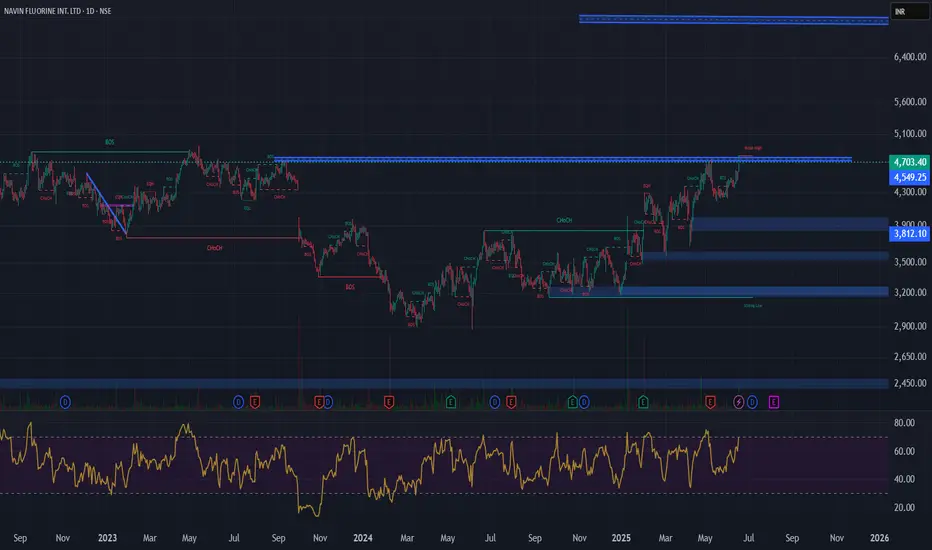
Cup & Handle Breakout - NAVINFLOURCurrent Price: ₹4,703
Technical Analysis:
Cup & Handle Breakout Pattern: The provided chart for NAVIN FLUORINE INT. LTD. shows a pattern that resembles a Cup & Handle. The current price action indicates it is at or near a potential breakout level.
Waiting for Confirmation: Your statement "Waiting for confirmation" is crucial. A confirmed breakout typically involves the price sustaining above the resistance level with strong trading volume.
Immediate Target: ₹7,000
Time Frame: 6 months to 1 year.
Fundamental Analysis:
Sales (Revenue from Operations): Consistently growing over the years, from ₹486 Cr in Mar 2014 to ₹2,349 Cr in Mar 2025.
Operating Profit: Shows a strong upward trend, from ₹66 Cr in Mar 2014 to ₹534 Cr in Mar 2025.
Net Profit: Also shows consistent growth, from ₹68 Cr in Mar 2014 to ₹289 Cr in Mar 2025.
EPS in Rs.: Increased from ₹13.47 in Mar 2014 to ₹58.19 in Mar 2025. This indicates healthy year-on-year growth in earnings.
Compounded Sales Growth: Healthy growth with 14% (TTM), 17% (3 Years), 17% (5 Years), and 15% (10 Years).
Compounded Profit Growth: Very strong growth with 25% (TTM), -7% (3 Years), and 20% (10 Years). The negative 3-year profit growth needs to be investigated, as the net profit has consistently increased in the past 3 years (258 Cr in Mar 2022, 375 Cr in Mar 2023, 270 Cr in Mar 2024, 289 Cr in Mar 2025). This might be due to a specific high base year or non-recurring items impacting the compounded calculation for that period.
Return on Equity (ROE): Strong and consistent, with 12% (Last Year), 13% (3 Years), 14% (5 Years), and 16% (10 Years).
Dividend Payout %: Consistent dividend payouts, with 21% in Mar 2025.
Stock P/E: While not provided in the specific image for Navin Fluorine's fundamental ratios, based on the current price of ₹4703 and FY25 EPS of ₹58.19, the trailing P/E would be approximately 80.82. This is a very high P/E ratio, indicating significant growth expectations are priced into the stock.
Corporate Actions & Latest News:
Dividends: The company has a consistent history of paying dividends.
Capacity Expansion/R&D: As a specialty chemicals and fluorochemicals company, corporate actions and news for Navin Fluorine often revolve around:
New project announcements or capacity expansions to meet growing demand.
R&D initiatives for new products or applications.
Strategic partnerships or collaborations.
Client wins in niche chemical segments.
Q4 FY25 Results: The latest news would include the Q4 FY25 financial results, which show a Net Profit of ₹289 Cr.
Company Order Book:
For a specialty chemicals company like Navin Fluorine, the "order book" typically includes long-term contracts with key clients and new project wins. A growing sales trend suggests a healthy order pipeline.
Overall Assessment:
Navin Fluorine International Ltd. presents a fundamentally strong picture with consistent growth in sales and net profit, along with robust profitability ratios like ROE. This strong fundamental performance supports the company's premium valuation.
The Cup & Handle breakout pattern is a bullish technical indicator. If confirmed with strong volume, it could potentially lead to the stock moving towards higher levels.
Key Considerations:
High Valuation: The calculated P/E of approximately 80.82 is very high. This means the market is already pricing in substantial future growth. The company needs to continue delivering exceptional results to justify and sustain this valuation.
Confirmation of Breakout: It's crucial to wait for proper confirmation of the Cup & Handle breakout with strong volume to validate the technical signal.
Profit Growth Anomaly: Investigate the negative "Compounded Profit Growth" for 3 years, despite the increasing net profit trend shown in the table. This might be a calculation anomaly or specific high-base effect.
Given the strong underlying business, consistent growth in key financial metrics, and the bullish technical pattern, the immediate target of ₹7,000, while ambitious, could be plausible within the 6-month to 1-year timeframe, provided the technical breakout is confirmed and the company continues its strong fundamental performance.
Disclaimer: This analysis is for informational purposes only and does not constitute investment advice. Investing in stocks, especially those with high valuations, carries inherent risks. Always conduct your own thorough research, carefully analyze the stock chart, assess your risk tolerance, and consult with a qualified financial advisor before making any investment decisions. The stock market carries inherent risks.
Cup & handle Breakout - IKSCurrent Price: ₹1,855
Technical Analysis:
Cup & Handle Breakout Pattern: The provided chart for "INVENTURUS KNOWLEDGE SO L LTD" shows a pattern that resembles a Cup & Handle, with the price breaking out above a resistance level.
Waiting for Confirmation: Your statement "Waiting for confirmation" is crucial. A confirmed breakout typically involves the price sustaining above the resistance level with strong trading volume.
Immediate Target: ₹2,250
Time Frame: 3 to 6 months.
Strict Stop Loss: ₹1,630.
Fundamental Analysis (Based on the images provided for Inventurous Knowledge Solutions Ltd.):
Market Cap: ₹31,858 Cr.
Current Price: ₹1,856 (close to your stated ₹1,855)
Stock P/E: 65.5. This is a very high P/E ratio, indicating significant growth expectations are priced into the stock.
Book Value: ₹104
Dividend Yield: 0.00%. The company does not currently pay dividends.
ROCE (Return on Capital Employed): 27.2%. This is a strong return, indicating efficient use of capital.
ROE (Return on Equity): 33.0%. This is an excellent return, showing strong profitability for shareholders' equity.
Face Value: ₹1.00
Industry P/E: 35.7. IKS's P/E of 65.5 is considerably higher than the industry P/E, suggesting it's valued at a premium compared to its peers.
Price to Sales: 12.0. This is a high Price to Sales ratio, indicating the market values its sales highly.
High / Low (52-week): ₹2,190 / ₹1,226.
Sales (Revenue from Operations): Consistently growing from ₹529 Cr in Mar 2020 to ₹2,664 Cr in Mar 2025.
Operating Profit: Shows strong growth, from ₹162 Cr in Mar 2020 to ₹770 Cr in Mar 2025.
Net Profit: Consistently increasing, from ₹137 Cr in Mar 2020 to ₹486 Cr in Mar 2025.
EPS in Rs.: Grew from ₹166.73 in Mar 2020 to ₹28.33 in Mar 2025. (Note: There's a significant drop in EPS from Mar 2020 (₹166.73) to Mar 2021 (₹200.10) to Mar 2022 (₹13.61) then recovering to ₹28.33 in Mar 2025. This may indicate a stock split or bonus issue that adjusted the EPS calculation over these years, making direct year-on-year numerical comparison without accounting for corporate actions misleading for these specific numbers. However, the net profit is consistently growing).
Compounded Sales Growth: 10 Years: N/A, 5 Years: 52%, 3 Years: 52%, TTM: 47%. These are very strong sales growth figures.
Compounded Profit Growth: 10 Years: N/A, 5 Years: 29%, 3 Years: 25%, TTM: 31%. These are also strong profit growth figures.
Return on Equity: Last Year: 46%, 3 Years: 37%, 5 Years: 39%. Excellent and consistent ROE.
Corporate Action & Latest News:
No specific corporate actions (like dividends for the latest year or splits/bonuses) are listed in the provided snippets.
The strong and consistent growth in sales, operating profit, and net profit indicates positive fundamental performance. This suggests the latest news would likely revolve around strong financial results and positive outlooks for the company.
For a company in "Knowledge Solutions," news might also include new client wins, expansion into new service areas, technological advancements, or strategic partnerships.
Company Order Book:
For a "Knowledge Solutions" company, an "order book" might refer to long-term contracts, recurring client engagements, and new project wins. The consistent sales growth implies a healthy pipeline of work.
Overall Assessment:
Inventurous Knowledge Solutions (IKS) presents a strong fundamental picture with consistent and high growth in sales and profits, coupled with excellent profitability ratios like ROCE and ROE. This explains the premium valuation (Stock P/E of 65.5 vs Industry P/E of 35.7), as the market is clearly pricing in sustained high growth.
The Cup & Handle breakout pattern on the chart is a bullish technical indicator. If confirmed with strong volume, it could propel the stock towards your immediate target of ₹2,250 within 3-6 months. The strict stop loss at ₹1,630 provides risk management.
Key Considerations:
Valuation: The stock is trading at a significant premium to its intrinsic value and industry P/E. This means future growth needs to be exceptionally strong to justify and sustain this valuation.
EPS Interpretation: Be mindful of potential corporate actions (like stock splits) that might have impacted the reported EPS historical numbers. The net profit growth is more consistently indicative of performance.
Confirmation of Breakout: Crucially, wait for proper confirmation of the Cup & Handle breakout with strong volume to validate the technical signal.
Given the strong underlying business performance, excellent growth metrics, and the bullish technical pattern, the immediate target of ₹2,250 within the specified timeframe appears plausible, contingent on the confirmed technical breakout and continued strong fundamental performance.
Disclaimer: This analysis is for informational purposes only and does not constitute investment advice. Investing in stocks, especially those with high valuations, carries inherent risks. Always conduct your own thorough research, carefully analyze the stock chart, assess your risk tolerance, and consult with a qualified financial advisor before making any investment decisions.

GBPCHF: Bearish Movement After Breakout📉GBPCHF appears to be bearish following a breakout of a significant daily support level.
After retesting this broken structure, the pair formed an inverted cup and handle pattern, and we are now seeing the test of the broken neckline.
A downward movement towards 1.1006 is anticipated.

Safe-Haven Demand Drives Gold Higher – 3500 Within ReachWishing everyone a peaceful weekend—despite turbulent times.
This weekend has been anything but calm. The escalating conflict in the Middle East continues to widen, with rising casualties. As always, war is often a pursuit of power by those at the top, while the real cost is borne by innocent civilians. Though we are mere observers from afar, it’s hard not to feel the weight of the situation.
From a geopolitical perspective, this conflict coincides with U.S.–Iran nuclear negotiations. Could this be a calculated move by certain powers to shift the balance in their favor? While it remains speculative, what’s certain is that the intensifying conflict is already shaking global financial markets.
In such a climate, safe-haven assets are clearly benefiting. Gold’s upward momentum appears firmly established, and oil’s direction hinges on the situation at the Strait of Hormuz. If the strait is closed, a surge in USOIL prices toward $100 would no longer seem unlikely.
Under the influence of such impactful news, traditional technical analysis plays a lesser role. The market direction is largely determined by sentiment, and chart patterns now serve more as entry point references rather than decisive indicators.
My trading outlook for Monday:
If gold opens with a bullish gap and rallies toward the 3480–3500 zone, this area could present a short-term selling opportunity—ideally executed with a quick in-and-out strategy;
If a pullback follows, look to build intraday long positions: aggressive traders may consider entries near 3430, while conservative ones can wait for a potential retest of the 3418 level.
One crucial reminder: News-driven markets are highly uncertain. Eventually, every war comes to an end, and when the demand for safe havens fades, so too will prices. Stay rational in your decisions, and always manage your risk appropriately.

GBPCAD: Pullback After a Trap 🇬🇧🇨🇦
There is a high chance that GBPCAD will pull back
from the underlined support.
The price started to grow after a false violation of that and a confirmed bearish trap.
Goal - 1.8458
❤️Please, support my work with like, thank you!❤️
I am part of Trade Nation's Influencer program and receive a monthly fee for using their TradingView charts in my analysis.

Bitcoin - Inverse Head & Shoulders on 4h (Neckline broken)Looking forward to a new ATH shortly IF the neckline holds.
BITSTAMP:BTCUSD
BINANCE:BTCUSD
COINBASE:BTCUSD
CRYPTOCAP:TOTAL
CRYPTOCAP:OTHERS
BINANCE:ETHUSD
COINBASE:ETHUSD
BINANCE:SOLUSD
OANDA:XAUUSD
FX_IDC:XAUUSD

DOW JONES INDEX (US30): Pullback From Support
US30 shows some strength after a test of a key intraday support.
A cup and handle pattern on that and a violation of its neckline
indicate a local strength of the buyers.
I expect a pullback to 42550
❤️Please, support my work with like, thank you!❤️
I am part of Trade Nation's Influencer program and receive a monthly fee for using their TradingView charts in my analysis.

IONQ CEO sells ALL shares owned by his private inv firm.Breaking BEFORE the news play: IONQ CEO sells ENTIRE stock position from founding stock for 100mil.
2597500 shares to be sold on June 11, 2025 (approx date of sale) for $103,224,650.
www.sec.gov
This is a pre-news coverage play in a hyped sector.
Following trading rules
1. NEWS - its not hit the main nets yet, which is wierd considering they covered his sale earlier last week for MUCH less.
2. Quantum sector is big in play currently
3. Stock has technical pattern double top into resistance; it is a cup and handle, which is typically bullish
4. C-suite exec is selling abnormal.amount of stock
5. Too much hype around stock going up, so contrarian play.
Contrarian plays for me tend to be low % hits, but with high returns. Small amount being used for this play, looking for 300% return on it by end of next week, if not then I will be out of the position.
Position X $31 Put 07/25exp; in at 1.45/put

My idea for the end of this Crypto BullrunSo far, everything is going according to plan, despite the unnecessary panic from retail; Bitcoin is doing fine.

6/12 Gold Analysis and Trading SignalsGood morning, everyone!
Gold rebounded after dipping to around $3320 yesterday, following a pullback from our previously defined sell zone (3358–3373). Early today, price broke above 3360, reaching a high of 3373, exactly within the resistance zone we expected. The initial rejection from this level aligns well with our plan.
📈 Technical Analysis:
Watch closely whether 3373 can be broken with strong volume. If so, the next key resistance lies around 3385.
However, if price reaches this level without first testing the 3352–3346 support, a rejection is likely. In such case, 3385 may serve as a temporary top and a potential short entry point.
🧭 Trend Structure:
On the 4H timeframe, the bullish momentum remains intact. The last two candles suggest strong buying pressure. If today's fundamentals are supportive, a test of 3400 or higher is possible.
On the 1D chart, the market is still in a technical correction phase. The bounce near 3300 was supported by the long-term trendline. However, if price drops back below 3340 and stays there, a trend reversal becomes more likely.
Focus on the 3314–3296 support zone. If that breaks, a deeper drop is likely, possibly $100 or more, pushing price toward 3200–3190. The decline may unfold as a slow grind or sharp breakdown.
📊 Fundamental Watch:
Today’s Initial Jobless Claims data could have greater-than-usual impact due to the recent CPI release.
The Federal Reserve's Quarterly Financial Accounts Report is also due today and may affect broader market sentiment.
📌 Today’s Trading Recommendations:
✅ Sell Zone: 3385–3403
✅ Buy Zone: 3331–3321
🔄 Intraday Scalping Levels:
3376 / 3358 / 3346 / 3334

Cup and handle pattern It maybe a profitable trade when we follow proper rules and our risk management.
Absolute fiest to eyes.
Only for the educational purposes

Silver Tests Key Long-Term ResistanceSilver is testing the 34.85 level, a critical resistance both in the short and long term. Since 2013, a cup and handle formation has developed just beneath this level. A confirmed breakout could signal sustained long-term bullish momentum.
Supporting this outlook, the gold/silver ratio has recently shown a decisive tilt in gold's favor, reaching historically extreme levels. This test of 34.85 might be the catalyst silver bulls have been waiting for and a return to normal signal for gold/silver ratio with pair trade oppurtunity.
However, caution is warranted. Silver is known for sharp intraday and weekly reversals. Confirming the breakout or false breakout could become tricky.

Altcoins (Market Cap) - Excluding Top 10 Coins - Inverted H&SBullish setup on the daily chart. CRYPTOCAP:OTHERS have once again made a inverted head & shoulders pattern which is a bullish reversal pattern. With the yellow chart below showing the Global M2 Liquidity index breaking out aswell. With more money in circulation, the propabilty is that more money will enter the market over time. Although, there can be latency.
For now I will trust the patterns in the chart of Others and follow it to see IF we can confirm the Inverse H&S. We have to break the neckline which should be around 310-325 B for June and July. But still, after that we need a pullback to confirm that neckline and make it support for continueation.
It´s a very interesting world right now. And much can happen. But IF this break out. It would probably be one of the most explosive bull markets to remember for a long time.. I myself are holding quality coins and tokens. Im not in memecoins, whats so ever. With the adoption happening right now in crypto I don´t believe that is the right market to be in right now.
Nothing on this profile should be interpreted as financial advice. Always do your own research and investment decisions. Im only expressing my thoughts and beliefs. Nothing else. Crypto is a risky business but It also has a lot of reward If being right. I can´t find equal yield in any other markets for now. If you know any, plz comment below =)
BINANCE:BTCUSD
CRYPTOCAP:OTHERS
CRYPTOCAP:TOTAL
MARKETSCOM:ETHEREUM
BINANCE:SOLUSD
BINANCE:SUIUSD
ICEUS:DXY
