Cup & handle formation Forming cup and handle pattern. Good to go buy once the pattern breakout.
This is educational purpose only.
Cup And Handle

ANGEL ONE - Potential Cup Pattern Breakout!Timeframe: Daily (1D)
Pattern: Cup Formation (shown with arc)
Setup:
Price is forming a classic cup pattern.
The neckline (arc resistance) is near 2538.40.
Price has recently approached but faced resistance around the neckline.
Once the price breaks above the arc line with strong volume, a bullish breakout could be confirmed!
Targets After Breakout:
🎯 Target 1: 2800
🎯 Target 2: 3000
Stop-loss suggestion: As per your risk management.
Notes:
Price is currently below the 200 EMA. For a strong confirmation, look for a close above the arc and the 200 EMA with volume spike.
Disclaimer
This analysis is for educational and informational purposes only. It does not constitute financial advice or a recommendation to buy or sell any securities. Always do your own research and consult with a qualified financial advisor before making any investment decisions. Trading involves substantial risk.

Shiba INU - Bottom Buy confirmed istorical Pattern Repetition (2024 & 2025):
The chart suggests that SHIB is following a repeated pattern cycle:
Stage 1 – Falling Wedge (Completed)
Stage 2 – Cup and Handle (Completed)
Stage 3 – W Pattern (Recently Completed)
Stage 4 – Inverted Head and Shoulders (Pending Formation)
Key Highlights:
✅ Buying Zone Identified between 0.00001167 – 0.00001271 USD.
🎯 New Target: 0.00002431 USD, representing a potential 90% return from the buying zone.
⚠️ Breakout Awaited: Stage 4 pattern (Inverted Head and Shoulders) is pending confirmation, which could trigger a major upward move.
🔄 Emphasis on pattern repetition to project future price action.
Conclusion:
The chart analysis suggests that SHIBA INU is mirroring its previous bullish cycle. With three bullish stages already complete and the fourth (inverted head and shoulders) pending, a breakout could lead to a significant price rally targeting 0.00002431 USD.

CRV is Getting Ready For a Skyrocket Move (1D)CRV has formed a Cup & Handle pattern — a well-known structure that typically signals a bullish reversal.
From a broader technical perspective, there's additional confluence suggesting a potential trend shift.
If the most recent dip holds, it may confirm that CRV has completed its bearish cycle and has now entered a new five-wave bullish structure. Based on the current price action, it's likely that wave 3 is unfolding at the moment.
Interestingly, the depth of the Cup & Handle formation aligns well with typical wave 5 targets, offering additional validation for this setup.
In this scenario, the wave 3 target sits around $0.78, which also coincides with a previously untapped order block — adding further credibility to the level.
For a longer-term outlook, wave 5 could extend above the $1.00 mark, depending on market conditions and overall momentum.
Moreover, the Ichimoku Cloud is currently reflecting a bullish bias, with price action moving above the cloud and supportive Tenkan-Kijun alignment — reinforcing the overall bullish outlook.
Achieving this target may take time — but as we all know, in crypto, time often behaves differently.
— Thanks for reading.

Go long in Waaree EnergiesWe can see a formation of cup and handle formation on daily frame. Above 3025 we can see breakout of the stock and from there we can achieve targets of 3125, 3190,3277 & 3350 or all time high also..
stoploss against this investment can be maintain near 2750.

BankBifty 1 hour Cup and Handle Continuation PattenBankBifty 1 hour Cup and Handle Continuation Patten
Stop Loss: 55030.45
Buy Stop: 55856.50
TP1: 57221.90
TP2: Not Set
No Divergence
Risk-Reward = Reward / Risk = 1,365.40 / 2,826.05 ≈ 0.48

GOLD (XAUUSD): Pullback From Support📈GOLD appears to be bullish following a test of crucial horizontal support.
As a confirmation, I spotted a cup and handle pattern on an hourly.
Its neckline was violated with a strong bullish momentum.
I anticipate the price will continue to rise, reaching at least 3340 soon, and potentially up to 3362.

Total3 cup and handle pattern. Total3 appears to have formed a large cup and handle pattern which if materialized can catapult it towards 2 trillion in market cap. Which alt coins are going to capture the bulk of this tidal wave of money?
In cryptocurrency, TOTAL3 refers to the total market capitalization of all cryptocurrencies, excluding Bitcoin (BTC) and Ethereum (ETH). It essentially represents the combined market cap of all altcoins (alternative cryptocurrencies). This metric is often used to track the performance of the broader cryptocurrency market, excluding the influence of the two largest cryptocurrencies.

OSCR 1W — When the Chart Speaks Before the FundamentalsThe Oscar Health chart is currently forming a textbook cup and handle — a long-term reversal structure that has completed its base and is now breaking out of the consolidation zone. The bullish structure is confirmed through price action, volume, and positioning relative to key moving averages.
The price has broken through the upper boundary of the handle, shaped as a descending wedge. The breakout is accompanied by increased volume — a clear sign of capital rotation out of accumulation. All major moving averages (EMA, MA50, MA200, WMA) are trending upward, and the price is holding above them all, confirming the bullish momentum.
According to Fibonacci extension levels, drawn from the historical low of $1.50 to the peak near $23.26, the first wave target stands at $36.71 (1.618 level), with an extended target at $45.02 (2.0 level).
Structurally, the setup suggests a medium-term scenario pointing from current levels toward the $36–45 range, with the potential to repeat the kind of explosive move seen during the 2023 phase, when the price increased more than sixfold.
On the fundamental side, Oscar Health is actively recovering: in 2024, revenue grew by more than 50%, net losses were cut nearly in half, and the client base continued to expand. The company is strengthening its share in the digital insurance market and gaining support from institutional investors, including Morgan Stanley and Capital Group. The latest quarterly report was positively received.
The breakout is technically clean and fundamentally supported. The immediate pullback zones sit at $14.95 and $13.40. Below that, moving averages may act as control zones for reaction.

TSLA: Break-out above bull flag, possible cup and handle?So, a few days ago, I posted about a bull flag forming on the daily chart for Tesla. This flag pattern was a period of consolidation following an incredibly whooping rally from the $270 mark to around $350 (around a 30% or so gain).
Today, we have a new break-out from this consolidation period, and as of writing right now, Tesla is up 7%. It has now breached the $350 resistance level.
If you look more closely, the chart pattern resembles something close to a cup and handle pattern. You have the cup base going from the 20th of Feb 2025 all the way to the 14th of May 2025. Our bull flag which lasted between the 14th of May until the 23rd of May (last Friday), could as well be a handle for the cup base.
A break-out from not only the bull flag but the cup and handle could signal a massive move towards $400, however $375 and $390 could be points of resistance, and it would be wise to watch for a cooldown in the short-term.
Upcoming this week, it might worth mentioning that NASDAQ:NVDA earnings could have a strong impact on tech and affect Tesla - even if Tesla isn't much exposed to AI as the semiconductors.
To conclude, target is $390-$400 however as we all know, nothing is guaranteed :)
Note: Not financial advice. My analysis is not advice, rather just an idea. Please do your DD as well.

$HOOD weekly cup and handleNASDAQ:HOOD trying to play out a weekly cup and handle formation. Looking for bullish confirmation with a candle close over $66.89. Inverse head and shoulders pattern played out on the daily chart already so a pullback to 60 may play out first.

TSLA cup and handle potentialTSLA looks like it's setting up for a bullish move with a potential cup and handle breakout on top of a potential bull flag formation on the daily. First PT at 350 psych level and 360-365, so long as it holds above 350.

GBP/USD manipulation going on right now ??gbpusd had a good rise the last few weeks/months, now its time to pay attention.
the price is now ranging,. let me tell you what i think.
a little bit higher there is a imbalance in the chart. for me and many others thats a reason to short.
why do i think manipulation is going on?
for the big people in order to go short they need to attract buyers, so how do they do that? they go long, they build up long orders to attract more buyers so the price doesnt go down and the shorts can get filled. thats what happening right now in my opinion. (i can be wrong)
also the rsi is overbought (indicating downside could come )
in my opinion the price will be ranging for a week of 2, after that is wil go a bit higher to eventually come down big time , (like 5% or more)
here is the setup i will take.
no financial advice, just my thoughts

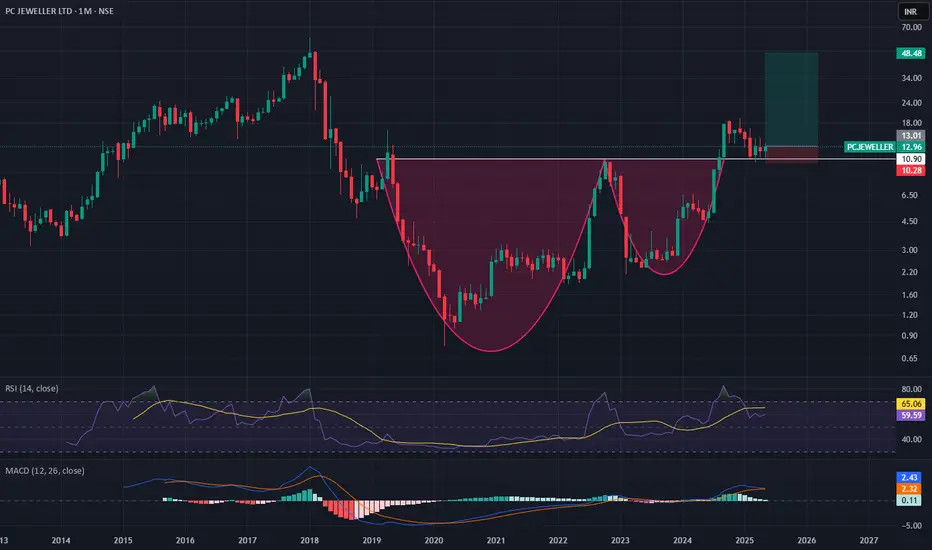
Binary Idea (High Risk, High Reward) in PC Jewellers1. Cup and Handle Breakout
2. Higher High - Higher Low structure
3. Above 50 DMA
4. Good Risk to Reward
5. Reduction in Debt
BHEL | Buy @LTP | SL below 240 | 1st Target 290, 2nd 330Disclaimer:
This is not financial advice. Please do your own research or consult with a financial advisor before making any investment decisions. Investments in stocks can be risky and may result in loss of capital.

South Indian bank forming a cup and handle patternSouth Indian bank forming a cup and handle pattern

Momentum Trade in Jio Fin1. Cup and Handle breakout
2. Volume pop up
3. MACD signal turning green
4. RSI above 50
5. Good risk to reward

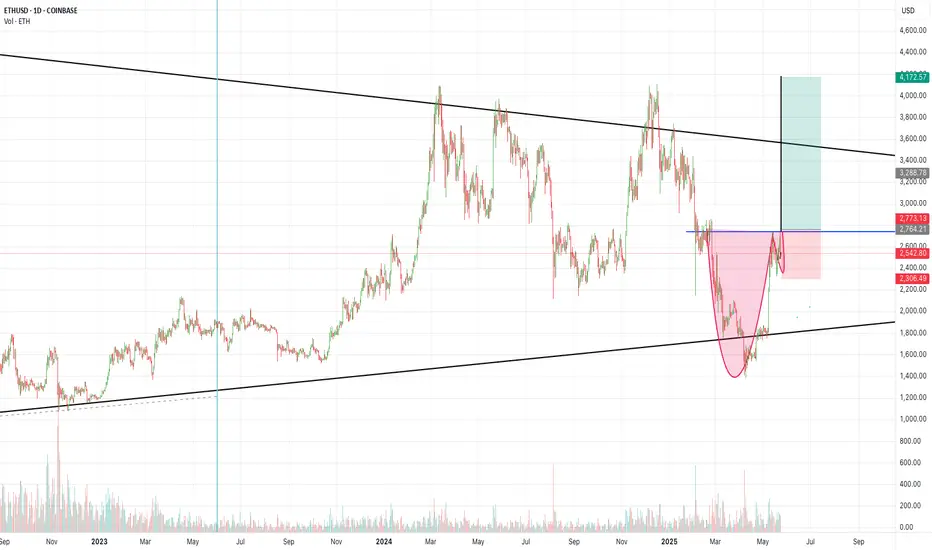
ETH Daily candlesgiant cup and handle on the daily candles and we looking at a 50% move creating a higher high breaking out of a monthlly patern symietical triangle. were looking bullish guys
Curve (CRV) Structure Analysis (1D)BINANCE:CRVUSDT formed a rounded bottom (cup) and a minor rectangle, and it's currently attempting to break above the local $0.83 resistance.
Key Levels to Watch
• $0.64: Current support and minor rectangle lower boundary
• $0.83: Current resistance, cup and rectangle upper boundary
• $1.00: Measured target from the minor rectangle pattern
• $1.30: Measured target from the cup pattern (within a key supply zone)
Other Important Levels
• $0.20: Key demand zone, and 2024 low
• $0.40-$0.50: Key S/R dating back to November 2022, aligned with the cup bottom
• $1.20-$1.30: Main supply zone, dating back to February 2023
A daily close above $0.83 with volume would confirm the breakout and trigger the targets.

Is this Bitcoin’s final push before altcoin season?Bitcoin breakout confirmed. But what if AVAX and other altcoins are where the real profits are hiding? Let’s talk targets, setups, and the coming shift in momentum.
This content is not directed to residents of the EU or UK. Any opinions, news, research, analyses, prices or other information contained on this website is provided as general market commentary and does not constitute investment advice. ThinkMarkets will not accept liability for any loss or damage including, without limitation, to any loss of profit which may arise directly or indirectly from use of or reliance on such information.

AUDCAD: Bull Trap & Bullish Confirmation 🇦🇺🇨🇦
AUDCAD formed a liquidity grab after a test of significant intraday/daily support.
A cup & handle pattern and a violation of its neckline with a bullish imbalance
provide a strong bullish confirmation.
I expect an up move now, at least to 0.899
❤️Please, support my work with like, thank you!❤️
I am part of Trade Nation's Influencer program and receive a monthly fee for using their TradingView charts in my analysis.

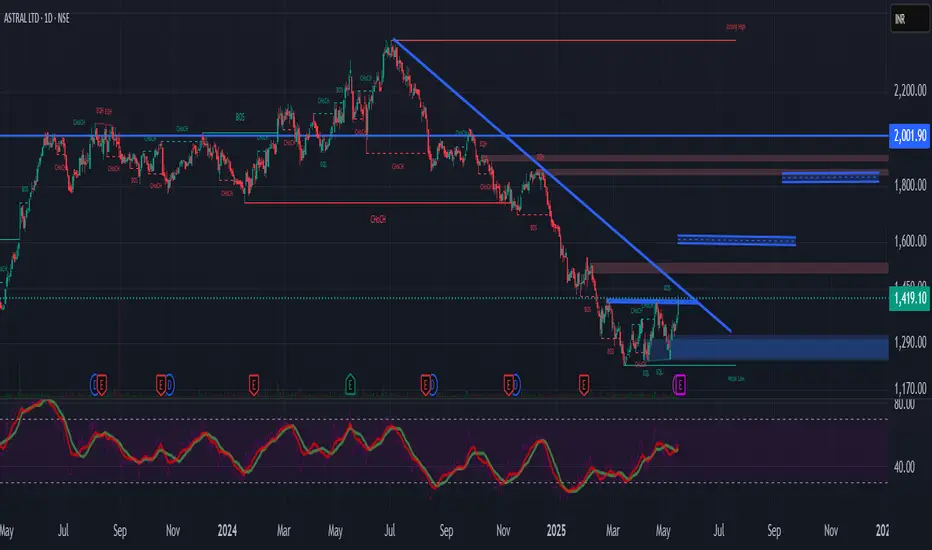
Cup & Handle Pattern Breakout - ASTRALTechnical Analysis:
Current Price: ₹1419 (as per the image)
Target 1: ₹1600 (based on small Cup & Handle breakout, potential 200 point return)
Target 2: ₹1850 (after Super Trendline breakout)
Timeframe: 1 to 3 months (for targets to be achieved)
Integrated Analysis:
Bullish Technical Setup: You've identified a potential small Cup & Handle breakout, which, if confirmed with strong volume, could lead to the initial target of ₹1600. The subsequent Super Trendline breakout would further strengthen the bullish case and support the higher target of ₹1850.
High P/E: Astral trades at a significantly higher P/E (73.1) compared to the industry average (26.5). This suggests that the market has high growth expectations for the company.
Mixed EPS: While the latest quarter's EPS (₹4.25) is slightly higher than the previous quarter (₹4.09), the overall Profit Growth is negative (-7.52%). This indicates that while the company is profitable, its profitability has declined year-over-year.
Positive EPS Trend: The EPS of ₹19.6 is higher than the EPS preceding year of ₹17.0, and the EPS last year, which is ₹20.3.
Key Factors to Monitor:
Breakout Confirmation: As always, strong volume is crucial to confirm the validity of both the Cup & Handle and the Super Trendline breakouts.
Sustainability of Growth: The company needs to demonstrate that it can return to a positive profit growth trajectory to justify its high P/E ratio.
Future Earnings: Upcoming quarterly results will be critical to see if the company can maintain or improve its EPS.
Industry Dynamics: Any positive developments in the pipes and fittings sector could benefit Astral.
Conclusion:
The technical setup suggests a strong bullish potential for Astral, with targets of ₹1600 and ₹1850. However, the high P/E ratio and negative profit growth are important considerations. The market is likely pricing in future growth, and the company's ability to deliver on these expectations will determine whether it can reach these targets
Cup & handle Breakout - HEGTechnical Analysis:
Current Price: ₹528.70 (using your initial price, which is close to the ₹529 close)
Target: ₹775 (significant potential upside)
Cup & Handle Pattern Breakout: Assuming this pattern is clearly visible on the chart and a breakout has been confirmed with good volume.
Time Frame: 1 to 3 months.
Integrated Analysis:
The technical picture suggests a bullish potential with the Cup & Handle breakout. However, the fundamentals paint a more cautious picture:
High P/E: Trading at a significant premium to the industry average.
Declining Earnings: Both year-on-year and overall profit growth are negative, indicating a concerning trend in profitability.
Recent Improvement (Quarterly): The latest quarter's EPS shows a slight increase over the previous quarter, which could be a glimmer of hope for a turnaround.
Latest News (as of May 19, 2025):
Recent news might be focusing on:
Q4FY25 Results Analysis: Any reports analyzing the latest quarterly earnings and providing insights into the reasons for the improved EPS but continued overall decline.
Graphite Electrode Market Trends: Developments in the global demand and pricing of graphite electrodes.
Company Strategies: Any news about HEG's strategies to address the declining profitability and capitalize on market opportunities (e.g., in the EV battery sector).
