GBPUSD, Bullish Trade ideaFundamental Analysis
1. DXY is bearish on fundamentals
2. COT data shows decrease in long positions in USD
Technical Analysis
1.CUP and HANDLE formation
2. Bullish Flag
3. Breakout of bearish divergence
4. safe buying on closing above resistance area
5. target mentioned
Cup And Handle

Cup & Handle - Bullish Continuation PatternFX:GBPUSD continues its bullish trend, printing higher highs and higher lows. Currently price has formed a Cup & Handle pattern signalling potential bullish continuation!
Following the analysis, buys should only be triggered once neckline / resistance has been broken!

Cup and Handle Breakout | Strong Trend Reversal in PlayNSE:PREMEXPLN
Analysis:
This chart showcases a classic "Cup and Handle" breakout pattern — a powerful bullish reversal setup. After a prolonged downtrend, the stock formed a rounded base, retested the neckline zone near ₹500, and broke out with strong momentum and volume.
Trendline Breakout: A long-term descending trendline has been broken, signaling a trend reversal.
Cup Formation: A smooth, rounded bottom formed over several months indicates accumulation and base-building.
Breakout Confirmation: A sharp breakout above the neckline resistance (around ₹500–₹510) with volume confirms the breakout.
Target Levels: Price has already moved toward ₹606 and is now approaching ₹678 — the measured move target from the depth of the cup.
Trade Setup:
Entry: Ideal entry was near breakout of ₹510.
Targets: ₹606 (hit), ₹678 (approaching).
Stop-loss: Below ₹500 or trailing below recent swing lows for momentum trades.
Outlook:
The chart signals a strong reversal and momentum continuation. If ₹678 is broken, further upside potential opens up.
HAPPY TRADING !!

Looking at a handle here :-)We’re looking at the cup’s handle here. My guess is that we’re going a bit more down from this status in the upcoming 24h and then go up again. If it does not go further down the 160 then we will probably break through the 180 resistance and hit 200. Let me know your thoughts about it! :-)

Trendline Breakout and Cup & handle breakout Confirmation - NBCCTechnical Analysis:
Current Price: ₹111.08 (Note: As of the market close on Friday, May 16, 2025, NBCC closed around ₹110.85 on the NSE).
Target: Your target of ₹140 suggests a significant potential upside.
Trendline Breakout: Breaking above a significant downtrend line indicates a potential shift in momentum to the upside.
Cup & Handle Pattern Breakout Confirmation: The confirmation of a breakout from a Cup & Handle pattern is a strong bullish signal, suggesting a likely continuation of an upward trend.
Time Frame: A 1 to 3-month timeframe is reasonable for these patterns to play out, assuming the breakouts are sustained.
Confirming the Breakouts:
Volume: It's crucial to have seen a noticeable increase in trading volume during both the trendline and the Cup & Handle breakouts. Strong volume adds significant validity to these signals.
Sustainability: The price should hold above the breakout levels in the coming trading sessions.
Potential Upside:
Target (₹140): Represents a potential upside of approximately 26% from the ₹111.08 level (or around 26.3% from the ₹110.85 closing price).
Quarterly and Yearly Results & EPS Comparison:
Based on the information available up to the latest reported quarter (December 2024) and the previous fiscal year (FY24):
Latest Quarter Result (December 2024): NBCC reported a consolidated net profit of ₹113.45 Crore, a significant increase of 60.81% compared to the same quarter last year (December 2023). Total income also increased by 17.25% to ₹2456.54 Crore.
Yearly Result (FY2024): For the full fiscal year ending March 2024, NBCC's total revenue stood at ₹7835.59 Crore, a growth of 10.75% compared to FY23. The profit after tax for FY24 was ₹277.66 Crore, a growth of 10.54% YoY.
EPS Comparison:
Quarterly EPS (December 2024): ₹0.63, compared to ₹0.39 in December 2023.
Yearly EPS (FY2024): ₹1.54, compared to ₹1.39 in FY23.
We will need the results for the quarter ending March 2025 (Q4FY25) and the full fiscal year ending March 2025 (FY25) for the most up-to-date comparison. These are expected in the coming weeks.
P/E Comparison:
Based on the closing price of ₹110.85 and the FY24 EPS of ₹1.54, the current P/E ratio is approximately 71.98.
According to some sources, as of May 17, 2025, the P/E ratio is around 59.8. The construction and infrastructure sector can have a wide range of P/E ratios depending on growth prospects and company specifics. While seemingly high, it could be justified if the market anticipates strong future earnings growth, as suggested by the recent quarterly results. We'll get a clearer picture with the FY25 EPS.
Corporate Action:
Dividend: For FY24, NBCC declared a final dividend of ₹0.14 per share. Investors will be looking for any dividend announcement that typically accompanies the full-year results for FY25.
Order Book: NBCC has been consistently securing new orders, which is a positive sign for future revenue and profitability. Keep an eye on any new order wins announcements.
Latest News (as of May 17, 2025):
Recent news around NBCC has been generally positive, focusing on:
Strong Q3FY25 Results (Dec 2024): The significant jump in profit was a key highlight, boosting investor confidence.
Order Wins: NBCC continues to secure new projects across various sectors, including infrastructure and real estate. These new orders provide revenue visibility for the coming quarters.
Focus on Execution: The market is often looking at NBCC's ability to efficiently execute its large order book. Any positive updates on project progress are usually well-received.
Government Initiatives: Being a government-owned entity, NBCC's performance is also linked to government spending on infrastructure and housing. Positive policy announcements in these areas can be beneficial.
Key Factors to Monitor:
Breakout Sustainability: Ensure the price holds above the breakout levels with sustained volume.
Upcoming Q4 & FY25 Results: These will be crucial in determining if the recent profit growth trend continues and will impact the P/E valuation. Look for the announcement dates.
New Order Wins: Any further significant order wins will act as positive catalysts.
Execution Progress: Updates on the progress of major projects in their order book will be important.
Market Sentiment: Overall market sentiment and the performance of the infrastructure and construction sectors will play a role.

Cup & Handle and the Trendline Breakouts - HUDCOTechnical Analysis:
Current Price: ₹233.86 (Note: As of the market close on Friday, May 16, 2025, HUDCO closed around ₹234.50 on the NSE).
Stop Loss: A closing basis stop loss at ₹214 provides a good level of risk management.
Targets: Your targets of ₹265 and ₹335 indicate significant potential upside.
Cup & Handle Pattern Breakout: This bullish continuation pattern suggests a likely move higher after a period of consolidation.
Trendline Breakout: Breaking above a significant downtrend line adds further confirmation of a potential shift in momentum to the upside.
Time Frame: A 1 to 3-month timeframe is reasonable for these patterns to play out, assuming the breakouts are sustained.
Confirming the Breakouts:
Volume: Ideally, both the Cup & Handle and the trendline breakouts should be accompanied by a noticeable increase in trading volume. This indicates strong buying interest and adds validity to the signals.
Sustainability: The price should hold above the breakout levels in the coming trading sessions. Any significant retracement below these levels could weaken the bullish case.
Potential Upside:
Target 1 (₹265): Represents an approximate 13.3% upside from the ₹233.86 level (or around 13.0% from the ₹234.50 closing price).
Target 2 (₹335): Represents a more significant potential upside of approximately 43.2% from the ₹233.86 level (or around 42.8% from the ₹234.50 closing price).
Quarterly and Yearly Results & EPS Comparison:
Based on the information available up to the latest reported quarter (December 2024) and the previous fiscal year (FY24):
Latest Quarter Result (December 2024): HUDCO reported a strong 18.84% increase in net profit YoY and a 13.38% increase in total income YoY.
Yearly Result (FY2024): HUDCO showed solid growth in both revenue (11.53%) and profit after tax (19.53%) compared to FY23.
EPS Comparison:
Quarterly EPS (December 2024): ₹3.51 (vs. ₹2.95 in Dec 2023).
Yearly EPS (FY2024): While various sources might have slightly different calculations based on adjustments, the yearly EPS for FY24 was around ₹13.22 (based on previous reports). Some sources also indicate a FY24 EPS of ₹10.57. We'll need the official FY25 full-year results for a precise year-on-year comparison. These are expected in the coming weeks.
P/E Comparison:
Based on the closing price of ₹234.50 and an estimated FY24 EPS of ₹13.22, the current P/E ratio is approximately 17.74.
Comparing this to the industry P/E for Housing Finance (which can fluctuate but is generally in the range of 15-30), HUDCO's P/E seems reasonable and not excessively high. We'll have a clearer picture of the valuation once the FY25 EPS is released.
Corporate Action:
Dividend: HUDCO has a history of paying dividends. For FY24, they declared a total dividend of ₹1.50 per share. Investors will be watching for any dividend announcement that typically accompanies the full-year results for FY25.
Key Factors to Monitor:
Breakout Confirmation: Strong volume on the breakouts is crucial.
Upcoming Q4 & FY25 Results: The financial performance in the latest quarter and the full fiscal year will be a significant driver for the stock price. Look for the announcement dates.
Government Policies: As a government-backed entity involved in housing and urban development, HUDCO's prospects are linked to government policies and spending in these sectors.
Market Sentiment: Overall market sentiment and the performance of the financial services and housing finance sectors will play a role.

Triangle Pattern BreakoutThe stock has broken Triangle Pattern and cup and cup and handle resistances with massive volumes. Buy at 227 with accumulation till 206. Target of 291/438. Use a risk reward of 1:4

Cup & Handle Pattern and Inverse Head & Shoulder Breakout - CDSLTechnical Analysis:
Current Price: ₹1408.8 (Note: Live prices can fluctuate. As of the market close on May 16, 2025, CDSL closed around ₹1417.00 on the NSE).
Target: Your target of ₹1800 suggests a significant potential upside.
Cup & Handle Pattern Breakout: This bullish continuation pattern, if confirmed, indicates potential for a strong upward move.
Inverse Head & Shoulder Breakout: This is a bullish reversal pattern, suggesting the end of a downtrend and the start of an uptrend. The confluence of these two bullish patterns adds strength to the potential upside.
Time Frame: A 1 to 3-month timeframe is reasonable for these patterns to play out, assuming the breakouts are sustained.
Confirming the Breakouts:
Volume: It's crucial to assess if both breakouts were accompanied by a noticeable increase in trading volume. Strong volume adds conviction to the validity of the breakouts.
Sustainability: Monitor if the price holds above the breakout levels in the coming trading sessions.
Potential Upside:
Target (₹1800): Represents a potential upside of approximately 27.8% from the ₹1408.8 level (or around 26.9% from the ₹1417.00 closing price).
Quarterly and Yearly Results & EPS Comparison:
Latest Quarter Result (March 2025): CDSL reported a consolidated net profit of ₹100.31 Crore, a decrease of -22.4% compared to the same quarter last year (March 2024). The total income for the quarter was ₹255.78 Crore, a decrease of -4.34% YoY.
Yearly Result (FY2025): For the full fiscal year ending March 2025, CDSL's total revenue stood at ₹984.58 Crore, a growth of 32.53% compared to the previous fiscal year (FY2024). The profit after tax for FY25 was ₹462.10 Crore, a growth of 27.19% YoY.
EPS Comparison:
Quarterly EPS (March 2025): ₹3.86, compared to ₹4.66 in March 2024.
Yearly EPS (FY2025): ₹22.11, compared to ₹34.77 in FY2024. The yearly EPS shows a decrease despite revenue and profit growth, which could be due to an increase in the number of outstanding shares or other accounting adjustments.
P/E Comparison:
Based on the closing price of ₹1417.00 and the TTM (Trailing Twelve Months) EPS of approximately ₹25.20, the current P/E ratio is around 56.23.
Comparing this to peers like Computer Age Management Services (CAMS) with a P/E of around 43.73 and KFin Technologies with a P/E of around 55.97 (as of recent data), CDSL's P/E is in a similar range or slightly higher than some peers.
Corporate Action:
Dividend: CDSL has declared a final dividend of ₹12.50 per share for the fiscal year ending March 31, 2025, subject to shareholder approval. The ex-dividend date and payment date will be announced later.
In the quarter ending March 2024, CDSL declared a dividend of ₹3 per share.
Key Factors to Monitor:
Breakout Confirmation: Watch for sustained price action above the breakout levels with good volume for both the Cup & Handle and Inverse Head & Shoulder patterns.
Earnings Impact: Analyze how the market reacts to the recent quarterly and yearly results. While the yearly revenue and profit showed growth, the decrease in quarterly profit and yearly EPS might be a point of concern for some investors.
Market Sentiment: Overall market sentiment and the performance of the financial services sector will influence CDSL's price.
Dividend Announcement: Keep an eye on the record date and payment date for the declared dividend.

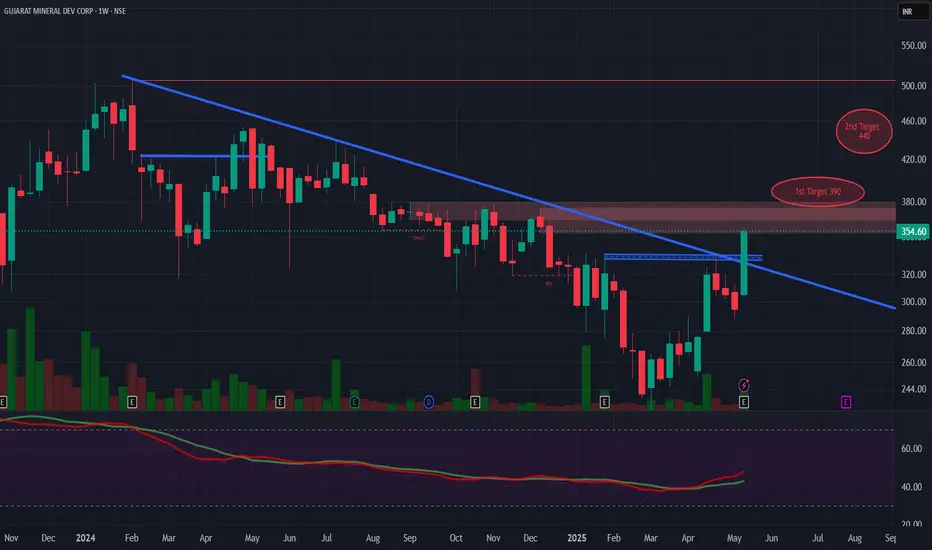
Cup & Handle and Trendline Breakout - GMDC LTDTechnical Analysis:
Current Price: ₹354 (Note: Live prices can fluctuate. As of the latest information available, GMDCLTD closed around ₹349.95 on May 16, 2025).
Targets: Your targets of ₹390 and ₹440 suggest a potential significant upside.
Cup & Handle Pattern Breakout: This is a bullish continuation pattern, and a breakout suggests a potential move higher.
Trendline Breakout: Breaking above a significant trendline also indicates potential bullish momentum.
Time Frame: A 1 to 3-month timeframe is a reasonable expectation for these patterns to play out, assuming the breakouts are sustained.
Confirming the Breakouts:
Volume: It's crucial to assess if the breakouts were accompanied by a noticeable increase in trading volume. Strong volume adds conviction to the validity of the breakouts.
Sustainability: Monitor if the price holds above the breakout levels in the coming trading sessions.
Potential Upside:
Target 1 (₹390): Represents an approximate 10.29% upside from the ₹354 level (or around 11.44% from the ₹349.95 closing price).
Target 2 (₹440): Represents a more significant potential upside of around 24.29% from ₹354 (or about 25.73% from ₹349.95).
Quarterly and Yearly Results & EPS Comparison:
Based on the available information (primarily data up to December 2024):
Latest Quarter Result (December 2024): GMDCLTD reported a rise of 26.39% in consolidated net profit. Sales also increased by 15.80% to ₹653.42 crore.
EPS (TTM - Trailing Twelve Months): The EPS for the trailing twelve months is around ₹20.97 (as per some sources).
To provide a more precise comparison of quarterly and yearly EPS, we would need the specific figures for the most recent quarters and the full financial year ending March 2025, which the company is expected to announce.
Key Factors to Monitor:
Breakout Confirmation: Watch for sustained price action above the breakout levels with good volume.
Upcoming Results: Keep an eye on the full-year results and any further quarterly results announcements, as these can significantly impact the stock price. The board meeting to consider these was held on May 15, 2025.
Sector Performance: The performance of the mining and minerals sector can also influence GMDCLTD.
Technical Indicators: Using other technical indicators like RSI and MACD can help confirm the bullish momentum.
Cup and Handle Breakout - BEMLTechnical Analysis:
Current Price: ₹3654 (Note: Live prices can change quickly. As of the last update around 9:55 PM IST on May 16, 2025, BEML is trading slightly higher around ₹3669-₹3670).
Stop Loss: A closing basis stop loss at ₹3160 offers a defined level of risk management.
Target: Your target of ₹4700 suggests a significant potential upside if the pattern plays out.
Cup and Handle Pattern Breakout: The Cup and Handle is generally considered a bullish continuation pattern. The "cup" is a U-shaped consolidation, and the "handle" is a short downward drift before the price breaks out above the rim of the cup, signaling a resumption of the prior uptrend.
Time Frame: A 1 to 3-month timeframe is a reasonable expectation for this pattern to potentially reach its target.
Confirming the Breakout:
Volume: For a Cup and Handle breakout to be considered strong, it should ideally be accompanied by a noticeable increase in trading volume during the breakout above the cup's rim.
Sustainability: The price should ideally hold above the breakout level and not fall back into the handle or the cup.
Target Calculation:
A common way to estimate the price target for a Cup and Handle pattern is to measure the vertical distance from the bottom of the cup to the breakout level (the rim of the cup) and then add that distance to the breakout level.
Key Factors to Consider:
Market Conditions: The overall market sentiment and the performance of the capital goods and defense sectors can influence BEML's price movement.
Q4FY25 Results & Dividend: BEML is scheduled to consider and approve its Q4 and full-year results ending March 31, 2025, on Friday, May 23, 2025. They will also consider recommending a final dividend. These announcements can create significant volatility and impact the stock's trajectory.
Technical Indicators: While the Cup and Handle is a strong pattern, looking at other confirming indicators like RSI and MACD can add confidence to the analysis. Several analysts currently have a 'Buy' rating on BEML.
Potential Upside and Risk:
Target (₹4700): This represents a potential upside of approximately 28.6% from the current price.
Stop Loss (₹3160): Your stop loss limits the potential downside to around 13.5% from the current price.

Solana (SOL) Cup & Handle (1W Log)BINANCE:SOLUSDT has formed a Cup & Handle pattern on the weekly chart, and arguably already broke out of the handle.
The measured move target based on the linear depth of the cup is ~$510.
Key Levels to Watch
• ~$100: Local low and 0.618 Fib of the cup depth, a typical handle retracement in a Cup & Handle pattern.
• $260: Cup & Handle neckline and key horizontal resistance. A decisive weekly close with strong volume above this level would confirm the pattern and activate the measured move target.
• $510: Measured move target based on the depth of the cup from the neckline.
Considerations
Volume confirmation remains key. A breakout above $260 with strong volume could validate the pattern and open the path to $510.

Cup and Handle break out in Max Financial ServicesIt seems like Max Financial Services Limited is breaking the resistance line of the cup and handle pattern, that it has been forming for the last 3 years. A breakout from the resistance trendline can drive the stock to 1700 and 2000 targets, as indicated by the pattern.

SHYAMMETLSHYAMMETL giving cup & handle breakout with decent increased volume. It is showing strength after recent fall. Now it it sustains above 958 then it may take a fresh ride from hereon. It may take a ride up to 25-27%. Closing below 890 may change my view for it.

Cup and Handle Pattern - CHALETCurrent Price and Recent Movement:
As of the latest data, CHALET HOTEL is trading around ₹918 - ₹919.
The stock has seen some positive movement recently, with a notable increase on May 13th, following the announcement of strong Q4FY25 results.
Analyzing Your Cup and Handle Observation:
Pattern Formation (January to Now): Multi-month consolidation, which can lend more significance to the pattern if it's well-formed.
Breakout: You stated a breakout has occurred. To validate this, it would be helpful to identify the precise resistance level of the handle that was broken.
Target of ₹1150 (250 Points): If the breakout happened in the ₹900-₹920 range, a target of ₹1150 would indeed represent a move of approximately 230-250 points.
Key Considerations and Points to Watch:
Breakout Confirmation:
Volume: Was the breakout accompanied by a significant increase in trading volume compared to the average? Strong volume supports the validity of the breakout.
Sustainability: Has the price held above the breakout level since it occurred? A failure to hold could indicate a false breakout.
Handle Characteristics:
Depth: Ideally, the handle should form in the upper half of the cup and shouldn't be too deep (typically not extending below the mid-point of the cup).
Duration: The handle should be shorter in duration than the cup.
Cup Depth: The projected target of a Cup and Handle is often estimated by measuring the depth of the cup and adding it to the breakout level. If the cup's low was around ₹700 and the handle's resistance broke around ₹900, the depth would be ₹200, projecting a target of ₹1100 (₹900 + ₹200).
Market Context and Fundamentals:
The recent positive price action was fueled by strong Q4FY25 results. Continued positive news or favorable conditions in the hospitality sector could support the upward momentum.
Keep an eye on analyst ratings and target prices for Chalet Hotels. Recent reports have shown "Buy" recommendations with target prices around ₹1000-₹1017.
Risk Management: Always have a stop-loss in place. For a Cup and Handle, a common placement is below the low of the handle.
In conclusion, observation of a Cup and Handle pattern with a breakout on CHALET HOTEL aligns with a potentially bullish scenario. The target of ₹1150 is within a reasonable range based on the pattern's implications and recent positive developments. However, it's crucial to continuously monitor the breakout's confirmation with volume and ensure the price sustains above the breakout level. Keep an eye on overall market conditions and the company's fundamentals to gauge the likelihood of reaching your target.

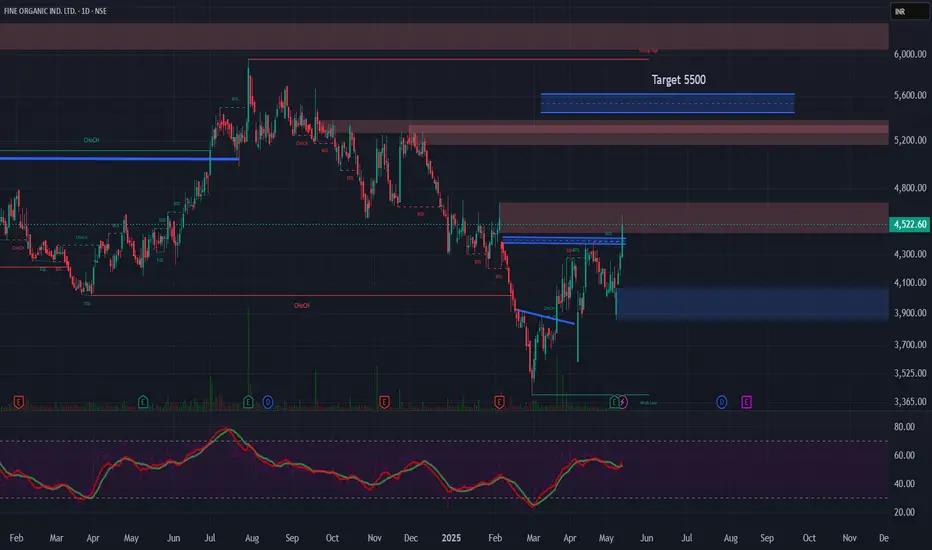
Cup and Handle Breakout - FINEORGFINEORG
Fine Organic Industries is engaged in and outside India as manufacturers, processors, suppliers, distributors, dealers, importers, exporters of wide range of oleochemical-based additives used in foods, plastics, cosmetics, coatings and other specialty application in various industries.
TARGET : ₹5500
TIME FRAME : 1 TO 3 month
Bullish Implications of the Cup and Handle Pattern:
Consolidation and Breakout: The Cup and Handle pattern typically forms after an uptrend, representing a period of consolidation (the "cup") followed by a smaller consolidation (the "handle"). The breakout occurs when the price moves decisively above the resistance level formed by the top of the handle, suggesting a continuation of the prior uptrend.
Increased Buying Pressure: A good breakout, especially on strong volume, indicates that buying pressure has overcome the previous resistance, and more buyers are likely to enter, driving the price higher.
Target Projection: A common method to estimate the target price after a Cup and Handle breakout is to measure the depth of the cup and add it to the breakout level.
Factors Supporting Your Analysis:
Well-Defined Pattern: The longer the pattern formation (February to May), the potentially more significant the breakout.
Good Breakout Today: A strong breakout day adds conviction to the bullish signal. Ideally, this breakout would be accompanied by higher than average trading volume.
Timeframe: Your 1 to 3-month timeframe is within the typical expectation for a Cup and Handle pattern to reach its target after a successful breakout.
Key Things to Monitor:
Breakout Confirmation: While today's breakout is positive, it's crucial to watch for confirmation in the coming days. The price should ideally hold above the breakout level and not quickly fall back below the handle's resistance.
Volume: Continue to monitor the trading volume. Sustained high volume on subsequent up days would further strengthen the bullish case.
Handle Integrity: The handle should ideally be a relatively shallow downward drift, typically in the upper half of the cup. A handle that is too deep might indicate more significant selling pressure and could weaken the pattern.
Market Conditions: Keep an eye on the overall market sentiment and any news or events that could impact the specialty chemicals sector or FINEORG specifically.
Stop-Loss Placement: It's essential to have a stop-loss order in place, typically below the handle's low or a recent swing low, to manage risk if the breakout turns out to be a false one.
Cup and handle Pattern - COCHINSHIP
Target and Timeframe:
Target of ₹2400 within a 3 to 6-month timeframe is a reasonable expectation based on the potential of a well-formed Cup and Handle pattern.
Factors Supporting Your Bullish Case:
Potential Breakout: If the price breaks decisively above the handle's resistance with good volume, it could signal the start of the move towards your target.
Sector Dynamics: Consider the overall outlook for the shipbuilding and defense sectors, as positive news or growth in these areas could act as a tailwind for Cochin Shipyard.
Company Fundamentals: While technical analysis focuses on price action, it's always good to have a basic understanding of the company's fundamentals. Positive earnings, order book, or expansion plans could support a bullish move.
Things to Watch For:
Breakout Confirmation: The breakout above the handle's resistance should ideally be accompanied by a significant increase in trading volume. This confirms strong buying interest.
Handle Formation: Ensure the "handle" is a relatively short and shallow downward drift. A handle that is too deep or too long might weaken the bullish signal.
Market Conditions: Overall market sentiment and broader index movements can influence individual stock performance. Be mindful of any significant market downturns that could impact Cochin Shipyard.
Stop-Loss: It's crucial to have a stop-loss level in place below the handle or a recent swing low to manage risk in case the pattern fails to materialize or a false breakout occurs.

TOKENFIThe 4hr chart is showing a cup and handle has formed. If crypto remain bullish we should see a break through in the next couple of candles and ultimately reaching a 3 cent target before it making even bigger moves

$PLTR - Bullish Cup and Handle Pattern on the Weekly ChartNYSE:PLTR Hello everyone! I've been analyzing the weekly chart and noticed a bullish cup and handle pattern that I think is worth sharing with you. This pattern suggests a potential price target of $130 for next year if it follows through as expected. I find this pattern quite interesting and will keep a close eye on it for potential trading opportunities.


EURUSD: Pullback From Support 🇪🇺🇺🇸
It looks like it is finally the moment for EURUSD to pull back.
I see a strong intraday bullish confirmation this morning
with a formation of a cup & handle pattern on an hourly time frame.
I expect a pullback at least to 1.117
❤️Please, support my work with like, thank you!❤️
I am part of Trade Nation's Influencer program and receive a monthly fee for using their TradingView charts in my analysis.

GOLD (#XAUUSD): Buying Opportunity on Pullback Following a bearish movement yesterday, gold has fallen to a significant intraday/daily horizontal support level.
The formation of a cup and handle pattern serves as a strong buy signal, and there is a high likelihood that the price will soon retrace to 3275 level soon.

Big CUP & Handle .. 100+ for this AI stock
The chart displays a cup-and-handle pattern, a powerful bullish continuation setup. The "cup" formed from $3 to $11.07, followed by a "handle" consolidation near the $11.07 resistance (key level). The stock is poised for a breakout above this level, with the measured move of the pattern projecting a target of $125. This target is calculated by adding the cup's depth ($8, from $3 to $11) to the breakout point ($11.07), scaled on a logarithmic chart, suggesting a potential move to $125 if the breakout is confirmed with strong volume. The curved trendline (blue) provides robust support, reinforcing the bullish trend, while the breakout above the handle’s descending trendline signals momentum.
Fundamental Catalysts:
SoundHound AI is a leader in the conversational AI market, expected to grow to $49.9B by 2030 (CAGR 30.2%). Strategic acquisitions (Amelia, SYNQ3, Allset) have expanded its reach in restaurant and enterprise AI, adding clients like Chipotle and White Castle. Partnerships with Tencent, Stellantis, and Hyundai integrate its voice AI into global automotive markets, while a $1.2B revenue backlog ensures long-term growth. Q4 2024 revenue soared 101% to $34.5M, with 2025 projected at $157–$177M (97% growth). With 270+ patents, a $246M cash reserve (no debt), and a path to positive EBITDA by late 2025, SoundHound is primed for significant market share gains.

EURAUD: Pullback From Support 🇪🇺 🇦🇺
EURAUD will most likely pull back from a key daily support.
As a confirmation, I see a cup & handle pattern
that was formed after a completion of a strong bearish wave.
The price will likely reach 1.7496 level
❤️Please, support my work with like, thank you!❤️
I am part of Trade Nation's Influencer program and receive a monthly fee for using their TradingView charts in my analysis.
