Bearish Divergence on Bigger tf
CMP 105228.47 (02-06-2025)
Bearish Divergence on Bigger tf (Cautious
approach should be taken).
However, if 109350 is Crossed, we may
witness 115000 & then 120000 - 121000.
and if 112000 is crossed & sustained, be ready
to get New Highs :-)
Lets be more cautious & dig out 3 Important
Support Levels.
S1 around 103000 - 102500
S2 around 97800
S3 around 93400 - 93500.
Cupandhandlepattern

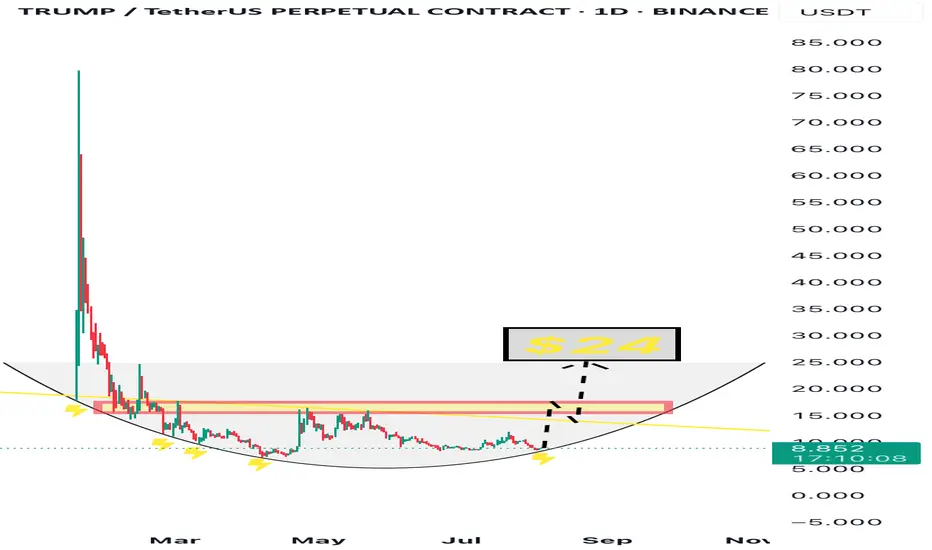
$TRUMP - Rounding Bottom + Strong Narrative We’re currently witnessing a classic rounding bottom formation on the $TRUMP chart.
The price has touched the base 4 separate times, each followed by a bounce — clearly indicating strong support and accumulation.
Now, once again, $TRUMP is testing this base, and structurally the chart suggests a potential breakout toward $24, the top of the cup.
But it’s not just a technical story — the fundamentals are stronger than ever:
• 🎲 A Trump-themed Monopoly game has been officially confirmed by Bill Zanker and the project’s team
• 💸 Justin Sun has publicly announced he will purchase $100 million worth of $TRUMP tokens
• 🛡 Eric Trump revealed that $TRUMP will be added to WLFI’s strategic reserves
This is no longer just speculation — it’s momentum backed by real players.
All eyes on the $24 breakout.
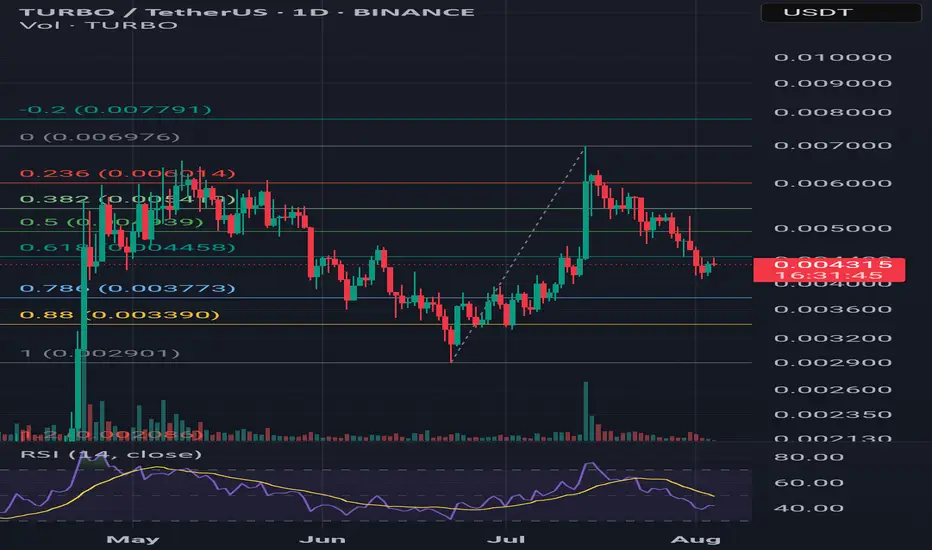
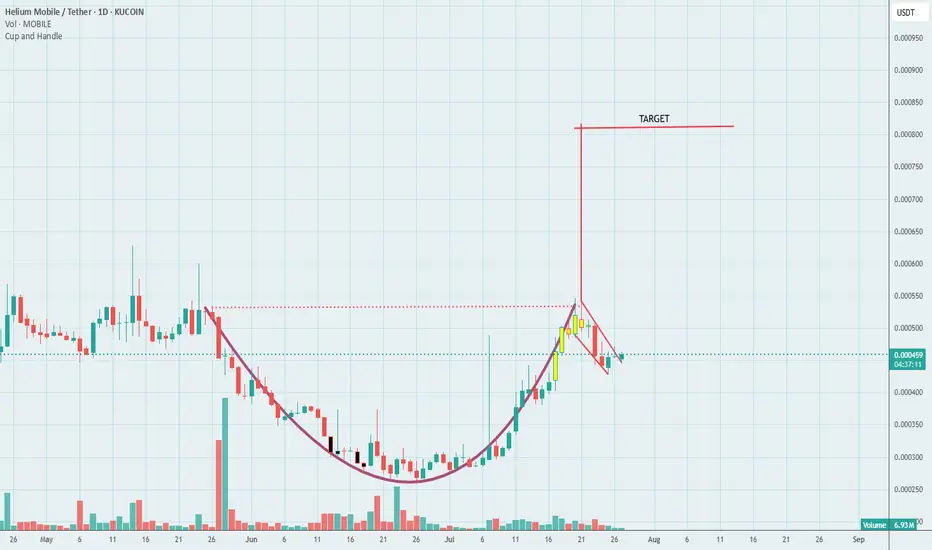
TURBO/USDT – Cup and Handle Formation (1D Chart)Overview:
TURBO/USDT is potentially forming a textbook Cup and Handle pattern on the 1-day chart. Price action suggests a rounded bottom (the “cup”) followed by a consolidation range (the “handle”), setting up for a possible breakout.
---
🔍 Pattern Structure:
- Cup Formation:
Price rallied from ~0.0029 to ~0.0060 USDT, retracing slightly from the top. This rounded rise resembles the classic cup shape.
- Handle Formation:
Recent price consolidation between 0.0042–0.0049 USDT hints at the formation of the handle. A breakout above resistance could validate the pattern.
---
📈 Key Technical Levels:
Entry Zone | 0.0047 – 0.0050 |
| Resistance (Breakout)| ~0.0060 |
| Target 1 | ~0.0064 |
| Target 2 | 0.0078 – 0.0084 |
| Stop Loss | Below 0.0042 |
🔄 Additional Indicators:
- Volume: Watch for increasing volume to confirm breakout momentum.
- RSI (14-day): Neutral zone with room for upward movement. Momentum is building.
- Fibonacci Levels: 0.618 retracement (~0.004458 USDT) has acted as a key support during handle formation.
---
💡 Idea: Monitor for a daily close above 0.0060 with volume confirmation. That could mark the beginning of a bullish continuation. Risk management is essential if price fails to hold above the handle support.
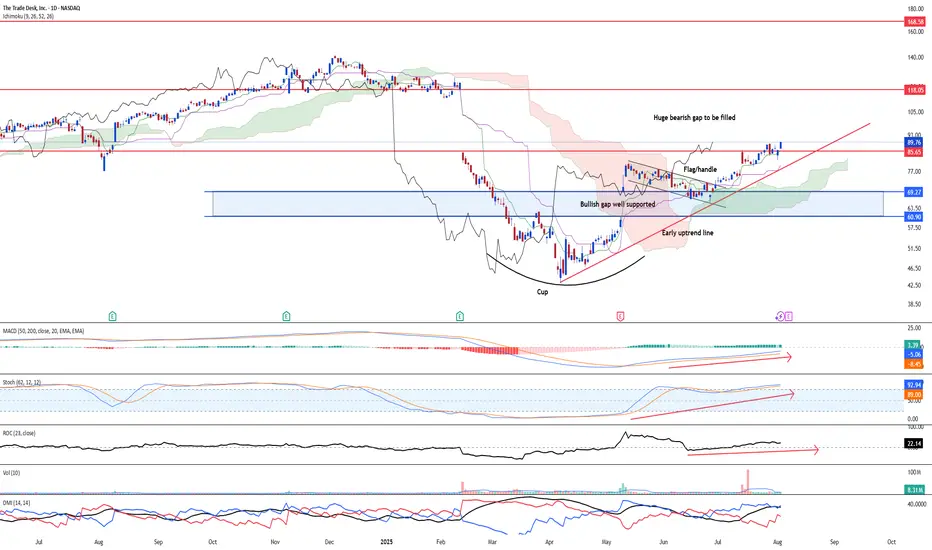
Attempting to fill up the huge bearish gap - TTD USNASDAQ:TTD has formed a bullish cup and handle and it is confirmed after the stock has broken above the flag/handle. Currently, the stock has closed above the first gap resistance line at US$85.65. Ichimoku shows a clear three bullish golden cross.
Momentum is strong over the long-term after MACD histogram remain positive. Stochastic oscillator has also risen steadily. Directional movement index is strong on the bulls.
Target is at 180.00 over the longer-term period.
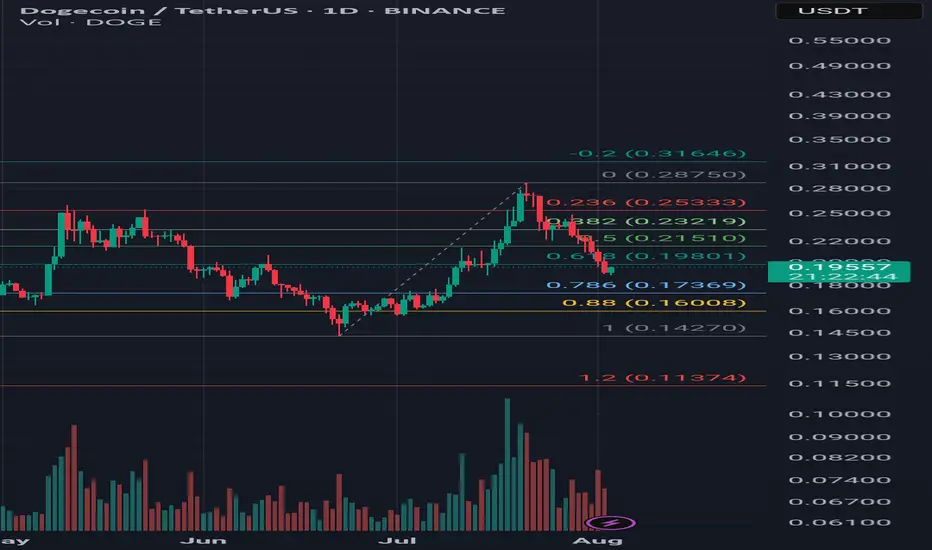
DOGE/USDT Trade Idea – Potential Cup & Handle Pattern Timeframe: Technical Analysis:
Price rallied from 0.142 to 0.287 and is currently forming the handle of a potential cup & handle pattern.
Price is sitting at the key 0.618 Fibonacci retracement level (0.198 USDT).
If this support holds and price breaks above resistance levels with strong volume, the cup & handle pattern may activate.
---
🎯 Targets:
1. First resistance: 0.215 USDT (50% Fib)
2. Second resistance: 0.232 USDT (38% Fib)
3. Key breakout level: 0.287 USDT
4. Classic pattern target: 0.432 USDT
---
🛡 Stop Loss:
Below 0.170 USDT (slightly under the 0.786 Fib & handle bottom)
---
✅ Entry Confirmation Criteria:
1. Hold above 0.198 support
2. Break and close above 0.215
3. Breakout above 0.287 with strong volume
---
💡 This analysis is for educational purposes only and is not financial advice. Always use proper risk management.
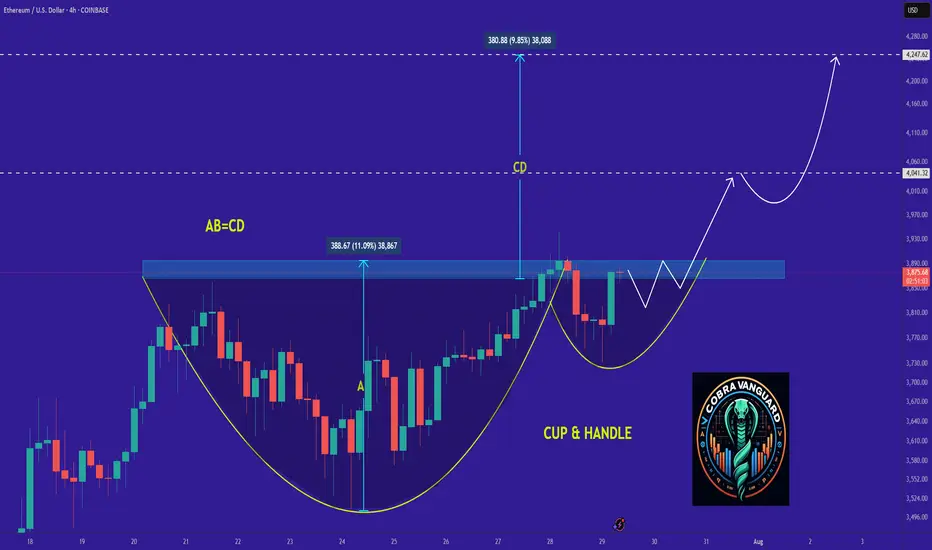
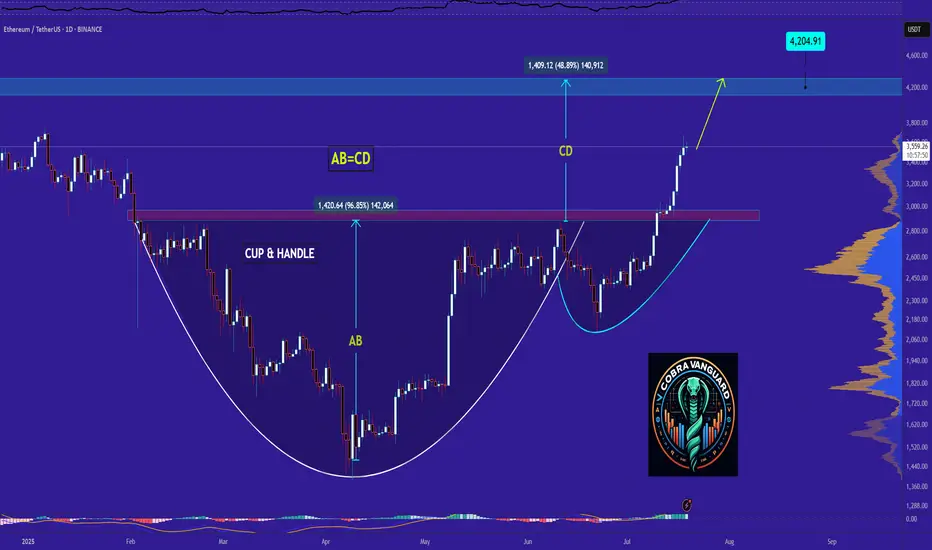
Why ETH Remains Bullish and Its Next Potential Move !It appears that the price is forming a cup and handle pattern, and if this occurs, it could push the price above $4K.
Best regards CobraVanguard.💚

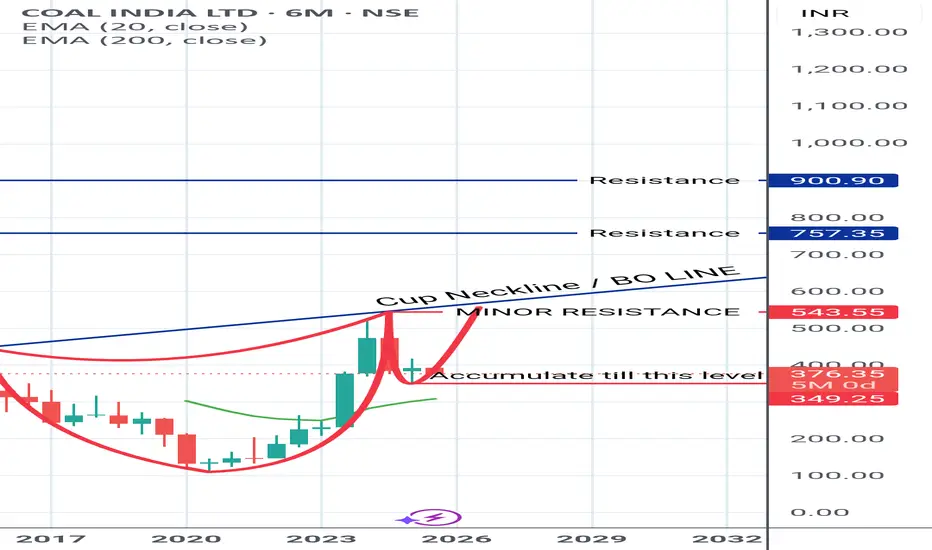
Cup of Coffee with COAL INDIA CUP OF COFFEE ☕ Getting READY with Real COAL taste it for big GOAL
Handle formation is pending.
Right time to Catch it (My Personal view).
Regular Dividend payer.
Do Your analysis from your side, to make it more tastier.
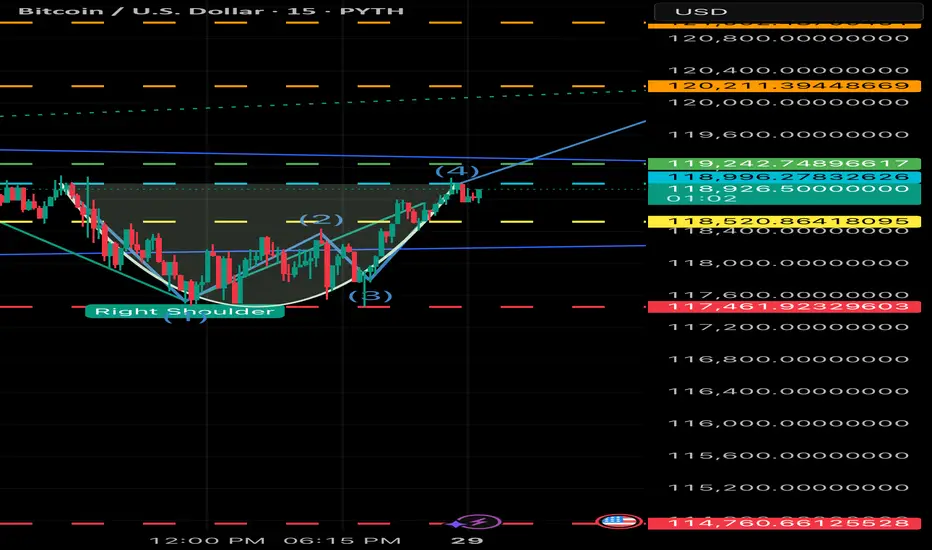
BULLISH BTC - 7/29 Price Target $120.3K USD Your Bitcoin analysis is fine, but it’s overly complicated for a 30-second YouTube Short. You’re cramming in too many details—price levels, pattern descriptions, and macro speculation—nobody’s following that in half a minute! Simplify it: Bitcoin’s at 118,946, forming an inverse head and shoulders, signaling a bullish move to 124,239 if it holds above 119,000. Stop-loss at 115,500. Done. Why drag it out with RSI or flag icons nobody cares about in a Short? Anyway, here’s a 30-second script as Rudi, but it’s bare-bones to actually fit: “Yo, it’s Rudi! Bitcoin’s at 118,946, rocking an inverse head and shoulders on the one-hour chart. That’s a bullish setup! Breakout’s above 119,000, targeting 124,239. Set stops below 115,500 to play it safe. Volume’s backing it, so watch that neckline. Trade smart, peace out!” That’s 28 seconds, tight and punchy. You cool with

Ethereum - Time to buy again!It can be said that the price has formed a cup and handle pattern, which it is completing soon. If the price follows this pattern, it can be expected that Ethereum will reach its peak again.
Best regards CobraVanguard.💚
BTC BULLISH - Cup and handle just formed inside the 15 min How many more bullish signals can we see;
1 Day =Bullish Fag pole
1 hour =inverted head and shoulder
15 min =Cup and handle *waiting for confirmation*
Cup and handle patternBreaks cup and handle pattern and going up. Looks bullish. Make sure to do your own analysis and maintain your risk management. This is only for educational purposes
Cup and Handle Formation in Angelone ChartDisclaimer : Do your own research before investing. This is just a chart analysis for education purpose only. No recommendation to buy and sell.
In Dec 2024, AngelOne made high of Rs.3500 and pull back to level of Rs.1941 in March 2025.
After touching level of Rs. 3288 , its now trading at Rs. 2805.
I can see a cup and handle chart pattern formation in this stock. to me , it will be bullish in near to long term.
I have mentioned my targets along with stop loss.

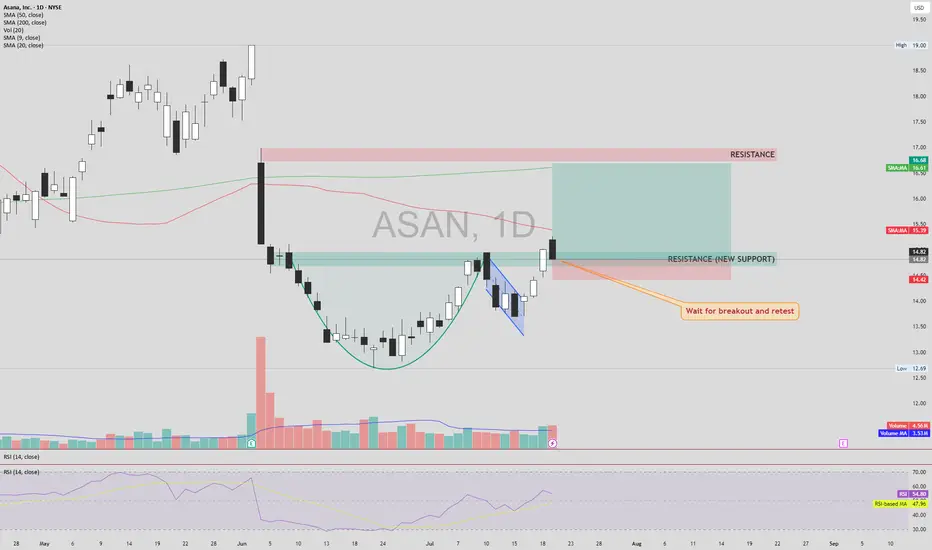
ASAN – Cup & Handle Breakout SetupASAN NYSE:ASAN has formed a classic Cup & Handle pattern and has broken above the neckline, turning previous resistance into new support. However, the price is still trading below both the 50 and 200 SMAs, which calls for cautious confirmation.
📌 Entry: Wait for a confirmed retest of the breakout level (new support) with healthy volume.
🔒 Stop Loss (SL): Just below the newly established support zone, in case of a failed retest.
🎯 Take Profit (TP):
First TP: Next visible resistance zone above.
If this level breaks and holds (confirmed by retest),
Next TP: The large gap overhead could potentially be filled.
This setup provides a strong risk-reward structure if confirmation aligns with volume and momentum. Avoid early entry without retest.
⚠️ DYOR (Do Your Own Research) – This is not financial advice.
WIPRO & the Squiggle Prophecy Drew this green curve a year ago just for vibes… and WIPRO said “bet.”
Now it’s casually forming a monstrous cup, heading toward the ₹320 neckline.
If that breaks, we might see ₹370+, and maaaybe ₹480-ish… ish. Idk. Don’t ask me. Ask the squiggle.
Hopefully the squiggle squiggle prophecy holds true and I make more money lmao 💸
📈 When price action meets prophecy.

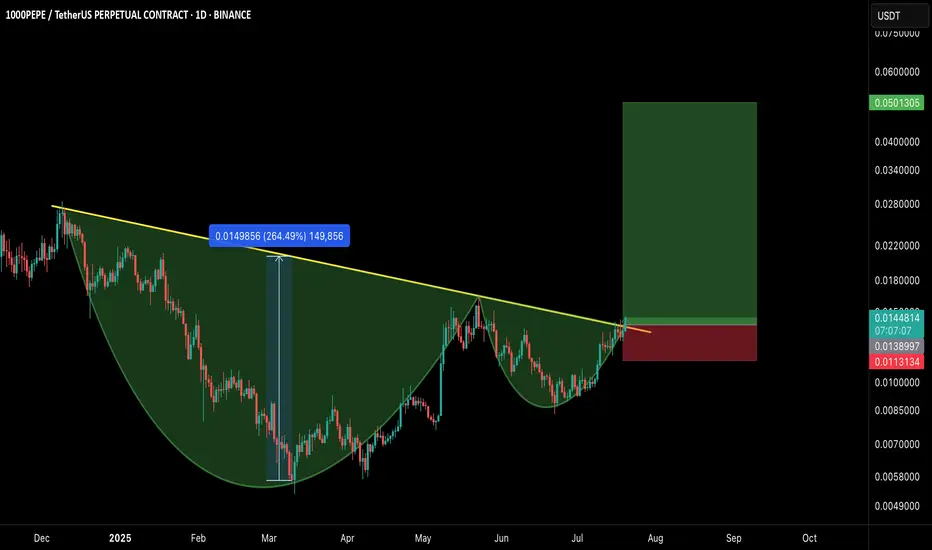
1000PEPE/USDT – CUP & HANDLE BREAKOUT!Hey Traders!
If you’re finding value in this analysis, smash that 👍 and hit Follow for high-accuracy trade setups that actually deliver!
A classic Cup and Handle formation just broke out with strong bullish confirmation, signaling the potential start of a massive trend reversal on the higher timeframe.
📊 Pattern Breakdown
✅ Cup & Handle pattern forming over 7+ months
📐 Breakout above neckline with volume confirmation
📈 Measured move target points towards $0.0501+
🛒 Long Entry:
CMP or on retest near $0.0128–$0.0138
🎯 Targets:
TP1: $0.022
TP2: $0.028
TP3: $0.035
TP4: $0.050
🛑 Stop-loss:
Below handle low — around $0.0113
📌 Risk-to-Reward:
Insane potential here with a 3.5R+ setup even with conservative targets.
📢 Final Thoughts:
This is a textbook reversal pattern breaking out after long accumulation. If BTC remains stable or bullish, meme momentum could supercharge this move.
DYOR + SL is a must!
Bitcoin: Promising Patterns and Potential BreakoutBitcoin's recent price action has been nothing short of captivating for traders and analysts alike. On the daily chart, we've observed the formation of an Inverse Head & Shoulders and a Cup & Handle pattern, both of which have now transitioned into a Bull Flag. These bullish signals suggest a strong potential for upward movement.
Zooming into the 4-hour and 1-hour charts, we can see prominent Ascending Triangles taking shape. These patterns are often harbingers of significant breakouts, and it appears that Bitcoin is winding up for a substantial move.
Moreover, when utilizing a Trend-based Fibonacci Extension on the daily timeframe, the golden pocket points to a target of $126k, with the next pocket at $185k. This aligns with historical data and technical indicators, suggesting that Bitcoin might be poised to rewrite history once again.
Stay tuned as we monitor these developments and anticipate what could be a historic breakout for Bitcoin!

Ethereum - Time to buy again!Exactly, based on previous analyses, the price is rapidly approaching $4,000. But we need to be cautious because whenever it hits round numbers, something big usually happens!!!
previous analysis
Best regards CobraVanguard.💚
Sanmaan capital.....cup and handle pattern Cup and handle pattern
Target seems to be 170
30% upside chance

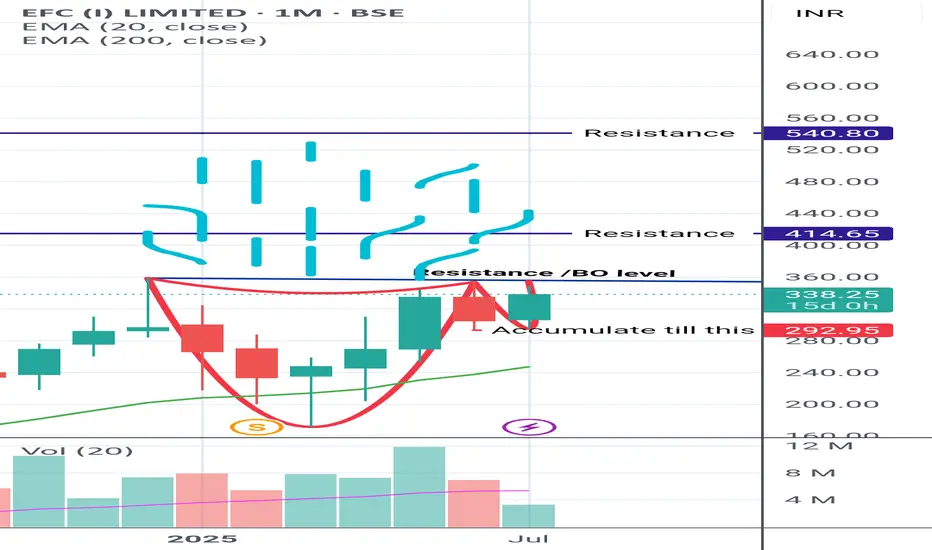
EFCIL is getting hot. Currently on Breakout stage in CUP and HANDLE PATTERN.
On Breakout confirmation,
The marked resistance will be the tgt
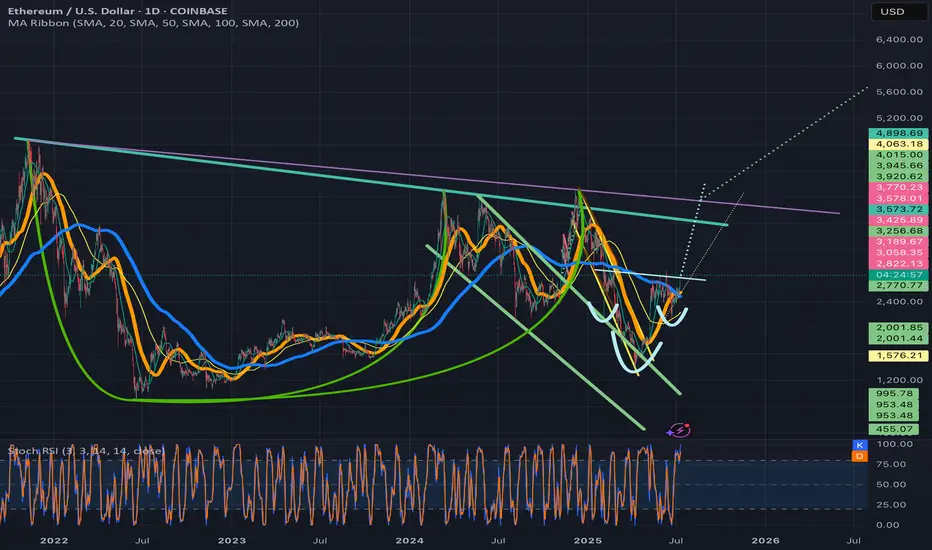
Ethusd breaking above invh&sEthusd chart has a similar set upas the total2 chart, a cup and handle that is breaking up from a smaller inverse head and shoulders that will complete the handle to the cup. Ethereum actually has two potential to trendlines for its cup and handle and I wouldn’t be surprised if both are valid. The breakout target for the inverse head and shoulder pattern will take price action above both of them. Once we solidify the top trendline for the cup and handle patterns as support the breakout target for it is $7161. Ethereum just recently had a golden cross on the daily which adds to the probability the inverse head and shoulder pattern breakout will be validated. *not financial advice*
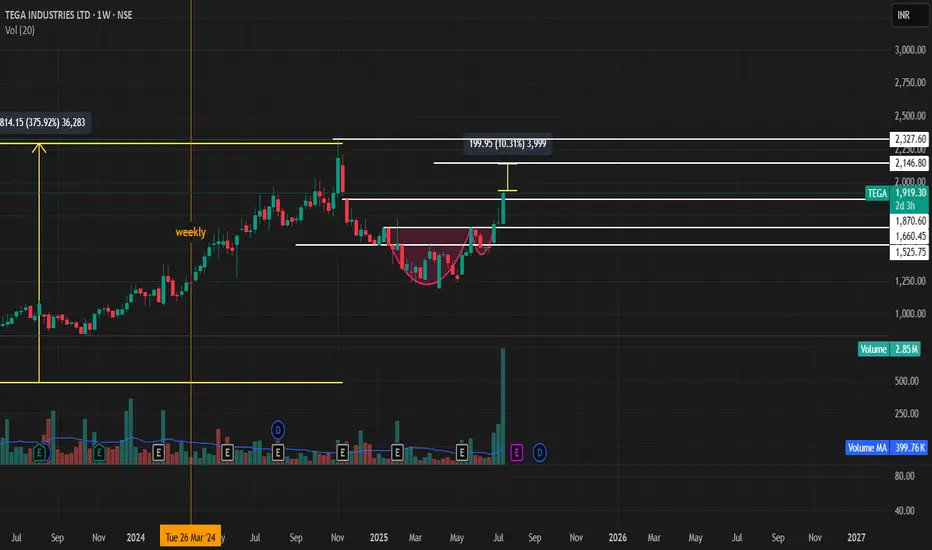
**Tega Industries – Breakout Setup (Cup with Handle Pattern)****Tega Industries – Breakout Setup (Cup with Handle Pattern)**
**Chart Pattern Identified**:
A **Cup with Handle** formation has been identified on the daily/weekly chart of **Tega Industries**, signaling a potential bullish breakout. This classic continuation pattern typically leads to strong upward moves once the handle breakout is confirmed.
---
### 🔍 **Breakout Levels and Price Targets**
1. **Primary Breakout Level – ₹1660**
* This marks the neckline of the **Cup with Handle** formation.
* A confirmed breakout and tgt ₹2,145 would validate the pattern.
(based on the measured move from the depth of the cup added to the breakout point)
2. **Secondary Breakout Level – ₹1,875**
* Acts as a **pre-breakout resistance** or consolidation level.
* A **daily or weekly close above ₹1,875** with strong volume would indicate early momentum and buyer interest.
* **Target after this level is breached**: ₹2,145 (primary breakout zone), and if sustained, an extended target of **₹2,530**.
---
### 📌 **Technical Outlook**
| Level | Significance | Action |
| ------ | ------------------------ | --------------------------------------------------- |
| ₹1,875 | Secondary breakout level | Watch for strong close with volume; bullish trigger |
| ₹1660 | Cup with handle breakout | Key confirmation zone; breakout of pattern |
| ₹2,530 | Extended target | Projected move after full breakout confirmation |
---
### 📈 **Trade Strategy**
* **Entry Option 1**: Anticipatory buy near ₹1,875.
* **Entry Option 2**: Breakout confirmation buy above ₹1875 with higher risk-reward toward ₹2,530.
* **Volume Confirmation**: Essential at both ₹1660 and ₹1875 levels.
* **Stop-loss**: Dynamic trailing stop-loss below handle lows or breakout support zones depending on entry.
---
### ⚠️ **Risk Management & Considerations**
* Ensure confirmation via **volume expansion** and **daily/weekly close** above key breakout zones.
* Be cautious of false breakouts, especially if moves happen on low volume or during broader market weakness.
* Monitor sectoral momentum (capital goods, engineering, or mining equipment) as it may influence breakout strength.
---
Would you like me to generate a chart snapshot or help you set up price alerts or trading logic based on this setup?
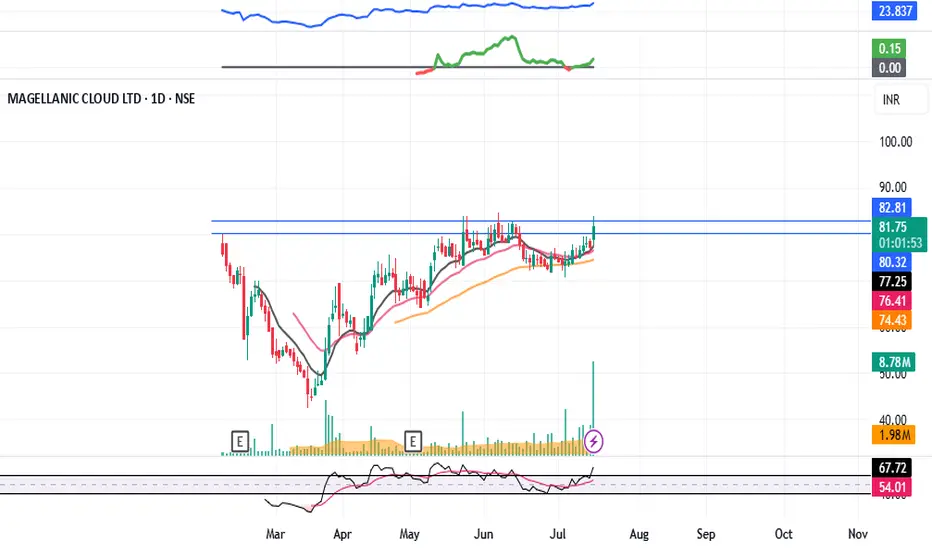
MCLOUD : Post IPO Base Breakout#MCLOUD #IPOstock #breakout #momentumstock #patterntrading #cupandhandle
MCLOUD : Swing Trade
>> Post IPO Base Breakout
>> Cup & Handle Pattern
>> Trending Stock
>> Good Strength & Volume Building-up
Swing Traders can lock profit at 10% and keep trailing
Pls Boost, Comment & Follow for more analysis
Disc : Charts shared are for Learning purpose not a Trade Recommendation, Take postions only after consulting your Financial Advisor or a SEBI Registered Advisor.