CAMS !! Perfect Cup and Handle Formation on Weekly ChartCAMS !! Perfect Cup and Handle Formation on Weekly Chart
- can give good up move above 2950 close on weekly basis
Cupandhandlepattern

Bullish fish-hook or cupand handleBreaking out possible soon out of a fish-hook or cup and handle. If GRPN can break resistance at 15 it can fly to 20 and break through til it hits old support levels and resistance at 25.

Cup and Handle Pattern
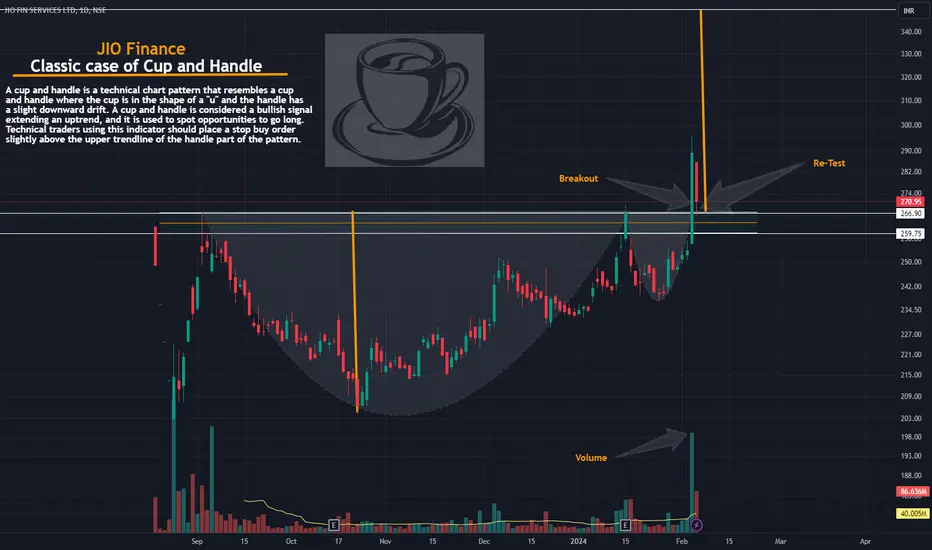
]A cup and handle is a technical chart pattern that resembles a cup and handle where the cup is in the shape of a "u" and the handle has a slight downward drift.
A cup and handle is considered a bullish signal extending an uptrend, and it is used to spot opportunities to go long.
Technical traders using this indicator should place a stop buy order slightly above the upper trendline of the handle part of the pattern.
Very bullish chart for $LINA buy at 0.007 tp at 0.02 or 0.03Bullish:
1. Weekly stoch bottomed, one of the first ones
2. Lower time frame bullish divergence
3. A falling wedge forming since June 2023
4. A cup handle pattern is formed, left side is April 2022, right side June 2023
5. Team is making a lot of partnerships almost every week, check out Twitter and Medium
6. Although the Chinese CEO has left, this used to be a China Hong Kong coin and thus still benefits from the HK narrative (ETF whatnot)
7. Linear 2.0 is in full development, they are partnering up to make a DEX
8. BNB broke out, a BSC coins could have their turns now
Bearish:
1. Monitoring FUD
2. BTC is on a suspicious rising wedge, maybe we have major bull trap first pumping the living hell out of altcoins before the crash

Strong technical potential for up to 60% advance PLTR was a true market leader back in 2020, but in brutal bear market of 2021-2022 the price was devastated almost by 90% of decline.
While price still is far bellow its all time highs and thus has substantial overhead supply, my technical analysis shows substantial potential for at least one more wave higher in 2023.
Thesis : until price respects and holds its Sep'23 lows 13.6, I expect price to form continue forming the right side and handle of the cup, following by the break-out to 23-28 ideal resistance zone.

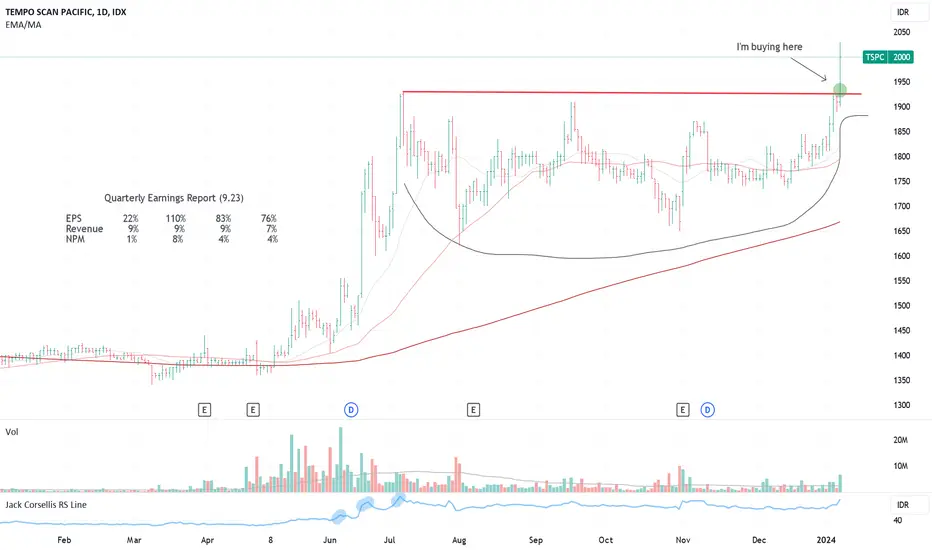
TSPC - CUP WITH HANDLEI bought my positions today
January 8, 2024
Reasons:
1. Low-risk entry point
2. Confirmed stage 2 uptrend
3. A long base cup and handle formation
4. One inside day pause in the handle area
5. The base has VCP characteristics
6. High relative strength
6. Volume dries up as less supply coming to the market
7. Huge volume on the breakout
Flaws:
1. The market is still in a hard-penny environment with only 31% of total stocks above the 200-day MA
2. The index is moving higher but there are still less stocks setting up.
I like to see some follow through action from now.
🚧Bitcoin is Bullish now🚧 & many Traders don't see it 👀!!!Hi.
COINEX:BTCUSDT
As you can see , t he price was able to break the cup&handle and reach the first target, now the price is in an ascending triangle, which can easily reach the desired target after the break.
🟡 Summery:
-btcT has been Bullish Recently!
-The odds of another Bullish Movement is High!
-Bullish Pattern is Visible on The chart!
-AB=CD
-On the way to 45k
🤑Stay awesome my friends.
_ _ _ _ _ _ _ _ _ _ _ _ _ _ _ _ _ _ _ _ _ _ _ _ _ _ _ _ _ _ _ _ _
✅ Thank you, and for more ideas, hi t ❤️ Like ❤️ and 🌟 Follow 🌟!
⚠️ Things can change...
The markets are always changing and even with all these signals, the market changes tend to be strong and fast!!
Previous Analysis:

Skipper Ready for Double Skip :)Skipper had a Blast of nearly 15% today and ended right at the BO zone of Multi year Rounding Bottom BO
On Daily Chart - there is a Cup and Handle Pattern with same BO zone. Above 275 WCB for target of 340
On Monthly Chart - There is a Rounding Bottom pattern with BO above same 275 WCB for Target of 530 almost 2x from CMP
Disclaimer:
Stocks-n-Trends is NOT a SEBI registered company. We do not provide Buy / Sell recommendations - rather we provide detailed analysis of how to review a chart, explain multi--timeframe views purely for Educational Purposes. We strongly suggest our followers to "Learn to Ride the Tide" and consult your Financial Advisors before taking any positions.
If you like our detailed analysis, please do rate us with your Likes, Boost and share your comments
-Team Stocks-n-Trends

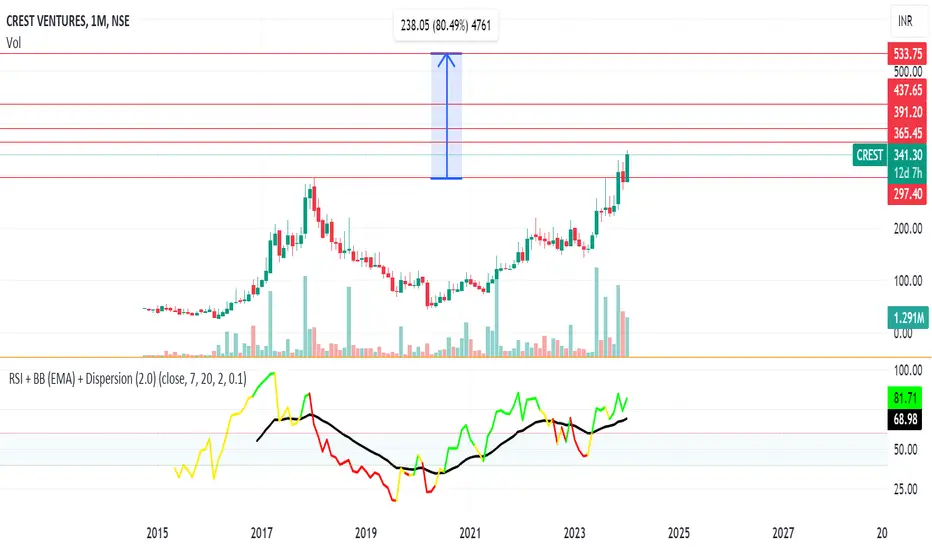
CREST VENTURES - Upto 50% ROI in the Mid to Long TermThe stock is about to break it's All time high, 5 year old BO in Monthly. --> Cup and handle - Rounding bottom.
It has been consolidating for the last 8 weeks, Monthly shows inside candle.
Daily shows good volume BO.
One can look for swing opportunity till 365. 7% ROI.
If there is a strong weekly close , one may enter on dips for ,
Target 1 - 365
Target 2 - 391
Target 3 - 437
Target 4 - 533
I'm Finally Blasting "IFB" Industries :) - Part 2IFB Industries on a longer term has formed a Big Flag Pole pattern and Cup and Handle Pattern.
After the Flag BO, it is creating newer patterns - Watch from Right to Left - as the stock increases it is creating Fresh Rounding Bottom patterns at each step - each Cup (Rounding Bottom) bigger than the previous one causing bigger upside Targets
Targets
1) 1500
2) 1990
3) 2800
4) 4000
Disclaimer:
Stocks-n-Trends is NOT a SEBI registered company. We do not provide Buy / Sell recommendations - rather we provide detailed analysis of how to review a chart, explain multi--timeframe views purely for Educational Purposes. We strongly suggest our followers to "Learn to Ride the Tide" and consult your Financial Advisors before taking any positions.
If you like our detailed analysis, please do rate us with your Likes, Boost and share your comments
-Team Stocks-n-Trends

power mechwell-known company
EPC project
The Indian government plans to invest in projects
this stocks leads in this counts
cup with handle patten breakout
stock at a lifetime high

GROK BULL RUN STILL POSSIBLEGood morning traders
A few days ago i posted about GROK and the potential it has of starting its bull run
We seen a heavy sell off last night back down to a previous support level that was set in the previous weeks
If we take a look at the volume it shows that it could be a measured move for traders to add more to their bags at lower prices before the bull market resumes
I am still very bullish on GROK at this time and the cup and handle pattern is still valid
An invalidation would be shown when the bottom of the cup pattern is breached and closed lower
Until then i will continue to add to my GROK holdings at a discount
Another thing to point out is we have now started to form a bullish ascending triangle pattern on all higher timeframes and we could be in for a bit of sideways action until around 4th February 2024 by which time i do believe we can break to the upside depending on other fundamental factors involved
Thanks for reading and if you could leave a like and a follow i would be very grateful as this helps me reach more users with my market analysis
MY TAKE ON COMMUNITY...
Do not join their telegram channel as if you ask any questions they will mute you pretty quickly and the moon kids will give you abuse for not living in pure hope alone, I found their community very toxic from the off and i left within 5 minutes, not a good luck for them as a team of mods with selective punishment based on their moon boy energy
Don't become a moon boy, it is not logical to invest in to something based on hope, do your own due diligence and more if you can to make yourself comfortable with your investment decisions
Enjoy the rest of your day!

AWHCL BREAKOUT ?Looking for a Breakout.
Ascending Triangle along with Cup & Handle Pattern.
Small Stoploss .
Ride with EMA.
Disclaimer : This is not a Buy or Sell recommendation. Please consult your financial advisor before making any investments . This is for Educational purpose only

Cup with Handle on IBM Attempting to Break $140 Resistance LevelWe have a nice looking Cup with Handle on IBM and it's currently Challenging the $140 Psychological Resistance Level, if it can get above that i think we will see IBM's stock price push towards the $175-$180 measured move. On a side not i also believe the Dow will be the strongest performing Maor US Index and reach all time highs before any other index and that IBM will be one of the more major stock leading the way along with Microsoft and Intel.

AMZN solid earnings high volume for 10 months Cup and HandleAMZN has risen lately above the lip of the cup of the pattern on this 4H chart. The pattern
suggests $ 50 USD upside or 35% beyond present price. The chart shows the buying coming
in once price reached a rounded bottom an began an uptrend. Earnings beats have been
significant especially compared with the miss a year ago. AMZN is like the massive river with
branches feeding the volume of the river's depth and breadth downstream. Its dominance
and resilience is impeccable like others in the titans of tech. Price is now in the ascending
bullish continuation portion of the handle. I see this as a setup for a long swing stock trade
as AMZN heads into the next earnings. Another long play is call options in five weeks at
$ 156 or six months expiration at $176 strike which is the head and shoulders pattern of 2021.

CRV ADAM AND EVEIn this chart, BINANCE:CRVUSDT is forming a cup and handle pattern from an intraday perspective. The pattern is suggesting a bullish move for the coin from its past downtrend movements. I'll provide more updates on this thread below. Happy trading!

REEF has flashed a potential buy signal.REEF has been on a roller-coaster ride as of late. The last time that REEF flashed this buy signal it experienced significant gains in the months following.
Choose your entries wisely, and always use a stop-loss, always!
Good luck!

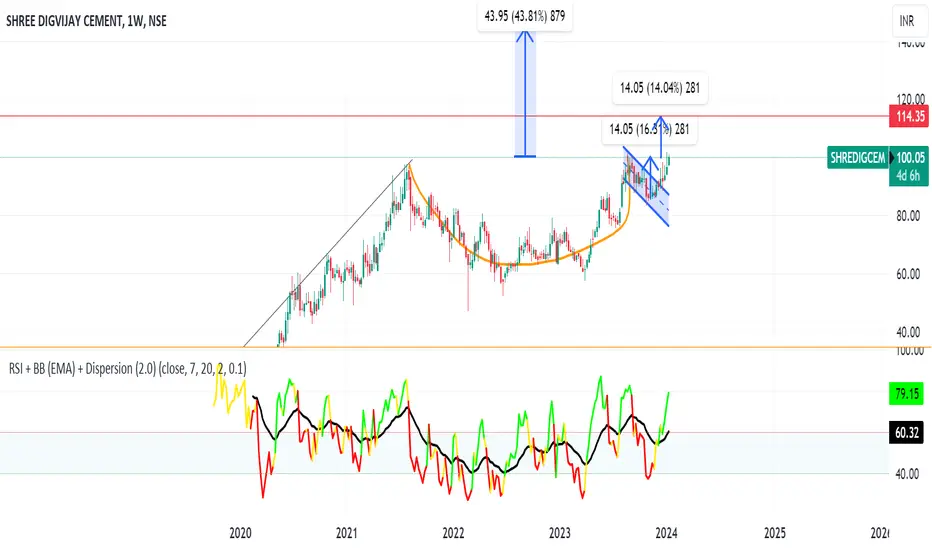
SHREEDIGICEM - Poised for a 10-15% upmove from cmp.The stock is breaking out of 2 year old consolidation, once can expect 40-50% ROI in short to mid term.
For Swing trade, one may look to enter at current price and trail profits post 114, 14-15% ROI.
The stock is in uptrend in all higher timeframes. The stock is clearly indicating cup and handle pattern in weekly.
Gold price today and prediction of upcoming trendsHello everyone!
Today, we witness the continuing downtrend of gold prices, currently hovering around the 2023 USD mark. It's a decline of 5 USD for the day and over 30 USD since the beginning of the week.
This decline is primarily attributed to recent positive news about the USD, which has shaken the confidence of traders, leading to selling gold to secure profits.
Looking at the technical analysis charts, gold seems to be forming a 'cup and handle' pattern, reinforced by a bearish signal from the reversing EMA 34. If gold breaks through the critical support level at 2015 USD, we might see a more significant drop, aiming next at the buyers' defense zone around 1982 USD.
What do you think about the future of gold prices? Do you expect it to rise or continue its current downward trajectory? Share your thoughts!

CYBER in Coming Days.CYBER broke out of a triangle and Cup and Handle pattern with high volume👀
Further bullish continuation anticipated either now or after another retest.
AB=CD.
❗ Note that if the PRZ zone is broken down with the power of descending candles, our analysis will fail.
🤑 Stay great my friends.
_ _ _ _ _ _ _ _ _ _ _ _ _ _ _ _ _ _ _ _ _ _ _ _ _ _ _
Thank you and for more ideas ❤️like❤️ and 🌟follow🌟!

GTRA - FLAT BASEI bought my positions today
January 15, 2024
Reasons:
1. Low-risk entry point
2. Confirmed stage 2 uptrend
3. Develops a mini cup and handle with VCP characteristics
4. Dried-up volume, indicating all the selling has been exhausted
5. Huge volume on breakout
6. High relative strength stock
7. More stocks are setting up and breaking out
Flaws:
The market is still in a hard-penny environment with only 31% of total stocks above the 200-day MA

TEZOS FORMING A POSSIBLE CUP AND HANDLEIn this chart of BINANCE:XTZUSDT , the coin is forming a possible cup and handle formation,
a bullish pattern in trading. In this idea, I will provide some keys and strategies in trading at this stage. So, stay tuned for the updeates on the idea threads below.
Happy trading and may all of us more profitable this 2024!

ES - SP500 futures Forming Cup and HandleCurrent bullish cup and handle pattern forming. The move from a breakout of this pattern could take it to all time highs.
