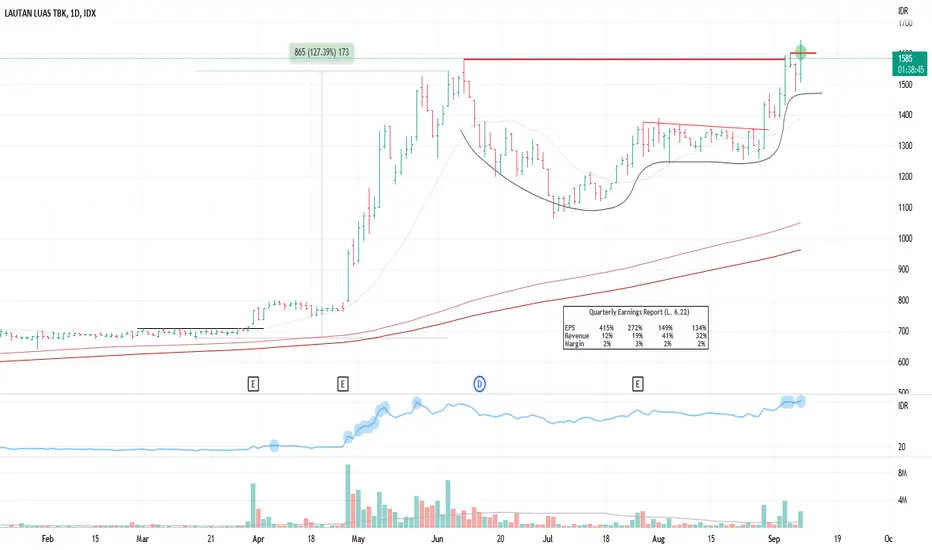
LTLS - CUP WITH HANDLEI got my pilot position today on the handle.
The stock broke out with huge volume. It has a perfect 3C for earlier entry beforehand.
Cupandhandlepattern
Cup and handle on fluxHi guys!
I see a cup and handle pattern forming out in the chart of flux, and if we take that it will become the most profitable alternative for miners to mine, besides the continuous development of the flux ecosystem, I think there is a significant chance for flux to reach higher levels in this year, and maybe make it to another ATH in the next months.
Not financial advice, just my opinion. DYOR!

Ravencoin Cup With Handle on the Hourly TimeframeRavencoin sits at the 61.8% Rertrace of a Potential Cup With Handle at the PCZ of a Bullish 5-0 with Hidden Bullish Divergence on the RSI. This isn't my most convicted trade ever but i think it's still worth giving decent a shot to see if Raven Can hold this PCZ level, if it does then we could then see Raven make a 200% Retrace to complete the Measured Move of the pattern.

BLDP - Handle FormationBLDP has formed a large curved structure which could be considered a cup and will be my me in this analysis
The handle is yet to form and we will see a retest of the high along the white horizontal line once this handle is complete

MAHARASHTRA SCOOTERSHello and welcome to this analysis
MAHSCOOTER has given a Cup & Handle breakout in monthly time frame.
It can be accumulated between here and 4500 for a target of 7500

Good momentum and volume in CCD, up towards 75+In weekly timeframe, having trendline resistance around 77 ( where as monthly club is around 71) forming possible Cup and handle pattern with good volumes ...(last few sessions volumes shows strength)..
If it continues the strength then next targets would be 75, 100+ in 6 months.
Note: This is just educational purpose and not for recommendations at all.

Possible Cup & Handle pattern and can go long In weekly timeframe, Tinplate formed possible Cup& handle pattern from 2018.
So, as per my view in next couple of months it can go till 450 and if pattern breakout then it can go till 800 next 9-12 months.
Next few weeks would be key to understand pattern depth or deviation if any.
Note: This is just educational purpose and not for recommendations at all.

DKS Breakout Long TradeDicks Sporting Goods (DKS) is breaking out from a textbook cup with handle pattern.
After nearly doubling in price between May and August, the stock stalled and formed a small pivot at the $115 resistance level.
Relative strength has been climbing for several months - a sign that Dicks has been leading the surge higher and outperforming the rest of the market.
Even in the late August market selloff, DKS held its ground and posted higher RS readings.
I’m looking for a continuation of the breakout that began on Friday.

Cup and Handle Pattern BREAKOUT in DLFHere We have analysed completely on the basis of pure price action strategy.
CMP:- 396
Target :- 440 - 500 - 650
SL Below:- 300 (swing low)

TSLA Cup and Handle approaching Breakout LONGTSLA 's Cup and the handle is progressing with rising relative strength and inflowing
relative volume noted on the chart. Once price hits 311 it should breakout into
bullish continuation possibly with a retest all in the week upcoming.

AMZN Has a Broken Handle!Amazon has a broken handle!
The handle of the classic cup and handle broke this afternoon on the weekly chart.
I am bullish on Amazon for this reason and because SPY is trading above 400!
I strongly believe that Amazon has a strong move ahead of today.
Blessed beyond measure,
MrALtrades00
*This is not financial advice.


Cup and handle breakout in Swan energySvan energy has given Cup and Handle breakout
254 coming soon
Volumes increasing
Stay tuned!

Valiant Cup and Handle breakout coming soonReversal pattern found in Valiant Organic
Cup and handle
Breakout above 735
Stay tuned

A bull 🐂 trapHello traders
If btc make a strong support above 21k/22k then it's ok
But if btc fall again to 18k then there is no chance to save btc from 16k to 12k
So be aware
Note
Cup and handle formation is going to take place

CARE Flag, Cup and handle brokenCanslim IBD A+ stock broke handle. If market good tomorrow. Classic cup and handle

CTRA Energy Stock Cup and HandleCTRA is showing a cup and handle on the daily chart now with the handle underway.
The Bull/Bear power indicator is at zero showing some equilibrium.
The RSI / Ichimoku indicator shows relative strength sitting on cloud support.
I see this as a good swing long setup and will take a trade when I see spot oil and natural
gas uptrending.

US Stock In Play: $ACVCA$ACVA - Consumer Cyclical | Auto & Truck Dealerships
pretty sure none of us gonna miss this trade if it breaks

EOS cup and handle can rise price to $3#EOS/USDT
$EOS shaped a cup and handle pattern.
now price is below upper line of descending channel that can be considered as handle, and it is the same with neckline.
🐮 break out from neckline or upper line of channel can increase price as high as cup which is around $3.
🐻 break down from 0.5 fib level will invalidate this scenario.

WOCKPHARMA - C&H Breakout + good VolumeWOCKPHARMA - C&H Breakout with good Volume,
Quaterly Results Improved

SHIB C&H (D)Cup and & Handle pattern on the Daily timeframe. Currently forming a falling wedge pattern for the 'Handle' part of the cup. Looking primed for a move up. I predict more consolidation until the end of September where the 'Merge' and Shibarium are rumored to come out. Wealth transfer here we come. When this makes a massive move to the upside know that God is the one who did this and His Glory will be known. #RedSeaMoment #PraiseGod

LG Balakrishnan Bros ltdLG Balakrishnan Bros ltd
cup and handle breakout
volume breakout
buy= 776
1st target =833
2nd target=892
stop loss=710

Is the NAS100 losing steam?Is the Nas100 losing steam on its downward momentum? The RSI has cooled down to previously seen levels, however the value is a lot higher.
This price action could signal a reversal point for tech stocks.
