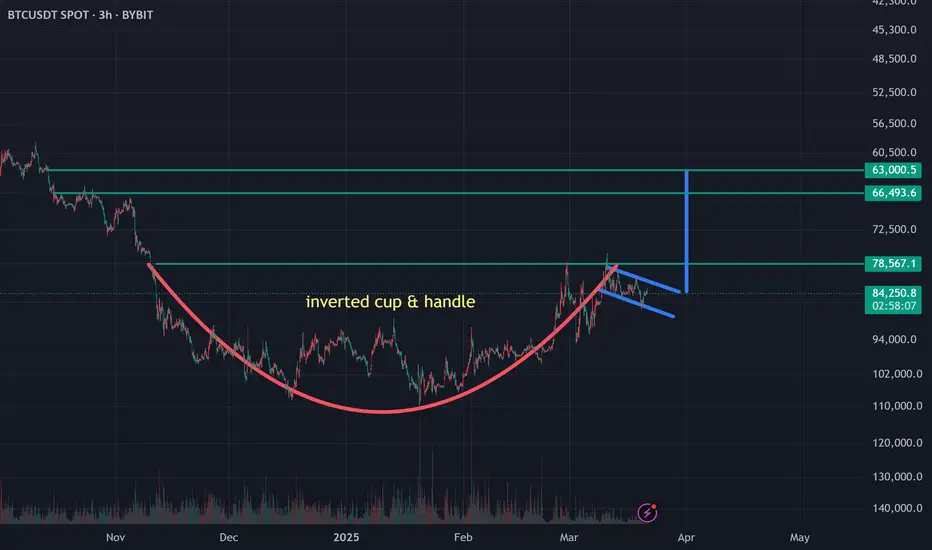
Bitcoin Inverted Cup & handle Bitcoin is forming an inverted Cup & handle pattern with a target of 63k-66k. I was surprised to see this when I inverted the chart. Just sharing with you what I see, and I hope the pattern changes and we continue to go up. However the highest probability at the moment is further downside, but we may still have a bounce toward 89k-91K before seeing the blood.
Cupandhandlepattern
CHF/USD Bullish Cup Formation | Support & Breakout Target Pattern Formation: Bullish Cup & Handle Breakout Setup
The price action on this CHF/USD 1-hour chart exhibits a Cup & Handle pattern, which is a well-known bullish continuation setup. This pattern suggests that buyers are gradually gaining control and a breakout could be imminent.
1️⃣ Understanding the Cup Formation
The cup shape (curved blue line) signifies a gradual accumulation phase, where price initially declined, formed a rounded bottom, and then started recovering.
This indicates that buyers are regaining momentum after a consolidation period.
The lowest point of the cup formed around March 16, from where the price began a steady upward move.
2️⃣ Key Support & Resistance Levels
Support Level: The strong demand zone is established around 1.1300 - 1.1320, as shown by multiple price bounces.
Resistance Level & ATH (All-Time High): The price struggled to break 1.1450 - 1.1470, indicating a major resistance zone where sellers previously took control.
3️⃣ Handle Formation & Pullback
After reaching resistance, the price formed a slight retracement (small descending wedge), which created the handle of the pattern.
The pullback was necessary to clear short-term overbought conditions before a potential breakout attempt.
4️⃣ Trading Strategy & Price Projection
🔹 Entry & Breakout Confirmation
If CHF/USD breaks above 1.1450 - 1.1470 with volume confirmation, this will validate the Cup & Handle breakout.
A confirmed breakout suggests further upside momentum toward 1.1570 - 1.1600, aligning with the pattern’s measured move.
🔹 Stop-Loss Placement
A logical stop-loss should be placed below the handle’s low (~1.1300 - 1.1320), in case of a false breakout or sudden market reversal.
🔹 Target Projection Based on Pattern Measurement
The height of the cup (~200 pips from bottom to resistance) is projected upwards from the breakout level.
This results in a take-profit target of 1.1575 - 1.1600.
5️⃣ Additional Technical Confluences
✅ Trendline Support: The price is respecting an ascending trendline, indicating continued higher lows and bullish sentiment.
✅ Bullish Momentum: The series of higher lows confirms a strong uptrend, favoring buyers.
✅ Potential Fakeout Risks: A failed breakout below 1.1300 could invalidate the bullish outlook, leading to a deeper retracement.
6️⃣ Final Thoughts: Is This a Good Setup?
📌 Overall Bias: Bullish ✅
📌 Breakout Confirmation Needed: Above 1.1450 - 1.1470
📌 Target: 1.1570 - 1.1600 🎯
📌 Risk Management: Stop-loss below 1.1300
If CHF/USD sustains momentum above resistance, traders can anticipate a strong bullish rally toward the projected target. However, it’s essential to wait for confirmation before entering long positions. 📈🔥

PRL WEEKLY CHART TOWARDS 60 ??PSX:PRL
1. Weekly chart suggests that price is working in cup shape.
2. AB:CD pattern is in play since 2023.
3. DEC23 : 35, Dec24: 45
4. Safe bet for PRL with current patterns is 55-60

XCN beautiful 2000% gainWith XCN popping off and everyone now wanting a piece of the action. XCN is not finished. I entered XCn on the 3 vertical orange lines. Every entry and exit was more beautiful than the last first 125% then 230% or so then 2000%. We are now at $0.012 roughly and holding above the 200EMA
Forming a clear cup and handle, (if your new to the game check out DIMO, the cup and handle formed right before multiple major take offs)
Bitcoin is showing support, and we all know what happens when that happens. Now is a better entry than ever, we could se a bit lower but I doubt past $0.01
However looking at June 15th 2022 we see a major push down followed by an immediate rejection, this is still possible but overall I believe this will hit its ATH and more being $0.10, $0.18, $0.35, $0.50 potential
Not financial advice but if your kicking yourself for missing a very very easy 2000%
It’s not over.
Good luck and have fun with it
Not Financial Advice

The handle is now forming on a massive cup & handle on SOL.SOL is now forming the handle of a massive cup-and-handle pattern that has taken over three years to develop. If SOL breaks out of this pattern in the coming months, we could very well see a four-digit price moving forward.
Keep your eyes on this.
Good luck, and always use a stop-loss!

DAX 🗝️ LEVELS TO WATCH 👀AND WHY 🤔Hello awesome traders, let's have a look at the DAX. I have a new analysis today as the previous exchange seems to be shut down.
Here are the details: The DAX on a weekly chart is trading a cup and handle pattern, and the price is now trading below near the target zone 1 at 62%: 19078.70. After a successful breakout from 16305.21, the target zones are as follows:
Target Zone 1:
62%: 19078.70
78%: 19817.23
Pattern Height:
100%: 20784.96

TOTAL CRYPTO MARKET CAP is back-testing the cup & handle patternIt's no mystery that the crypto market has been getting hit pretty hard since mid-December. However, the total market cap—which had previously broken out of a nice cup-and-handle pattern—is now backtesting the rim line and looks to be setting up for what could be an incredible move upward over the next 6 to 9 months, with the potential for a double within that timeframe.
Good luck, and always use a stop loss!

ONDO appears to have a bright future ahead!ONDO is a favorite cryptocurrency of many investors and traders alike. The entire crypto market has been dragged down since December after the massive gains from the "Trump election pump" caused many cryptos to go ballistic. However, the future looks bright for ONDO, as the current weekly chart suggests it's setting up for another leg up.
Good luck, and always use a stop-loss!

Learn How to Trade Cup and Handle Pattern on Forex & Gold
If you are studying a price action, you should definitely know how to identify and trade Cup and Handle pattern formation.
Being applied properly, it can generate big profits.
In this educational article, I will teach you how to identify this pattern. We will discuss its psychology and I will share with you 2 trading strategies.
📏And let's start with the structure of the pattern.
The pattern has 3 important elements:
Cup - long-term correctional movement that tends to move steadily from a bearish trend to a bullish trend.
Handle - short-term correctional movement with signs of bullish strength.
Neckline - upper horizontal boundary of the pattern - a strong resistance that the price constantly respects.
⚠️Being formed, it warns you about a highly probable coming bullish movement.
The trigger that confirms the initiation of a bullish wave is a breakout of the neckline of the pattern and a candle close above.
Here is the example of a completed C&H with a confirmed neckline breakout, indicating a highly probably coming bullish movement.
Depending on the preceding price action, Cup & Handle Pattern can either be a trend-following or reversal pattern.
📉If the pattern is formed after a bearish impulse. It is considered to be a reversal pattern.
Here is the example of a reversal C&H that I spotted on EURUSD.
📈If the pattern is formed at the top of a bullish impulse , it is considered to be a trend following pattern.
Here is the example of a trend following C&H that I spotted on GBPJPY.
The thing is that while the price forms the C&H, buying volumes are accumulating. Even though, buyers are hesitant and reluctant initially, their confidence grows, and the accumulation leads to explosive neckline breakout.
There are 2 strategies to trade this pattern.
✔️ Strategy 1.
That approach is quite risky , but the reward can be quite substantial.
You should monitor the price action when the price is creating a handle. Occasionally, the price starts trading in a falling channel: parallel or contracting one.
Your trigger will be a bullish breakout of its resistance and a candle close above.
Once the violation is confirmed, you can buy aggressively or set a buy limit order on a retest.
Stop loss will lie below the lows of the channel.
Target will be the closest key resistance.
Here is the example of the handle being a falling channel.
✔️ Strategy 2.
Wait for a breakout of a neckline of the pattern.
Once a candle closes above that, it will confirm the violation.
Buy the market aggressively or set a buy limit on a retest of a broken neckline then.
Stop loss will lie below the lows of the handle.
Target will be the closest key resistance.
Here is the example of the trade based on a confirmed breakout of a neckline of C&P on NASDAQ Index.
Applied properly, the strategies may reach up to 70% win rate.
As always, the best pattern will be the one that forms on a key level.
Try it, test it, and good luck in your trading journey.
❤️Please, support my work with like, thank you!❤️

Bullish on All Time Frames.Bullish on All Time Frames.
Crossing & Sustaining 208 will lead
it towards 260 - 265 & then 300+
Immediate Supports lies around 200 &
then around 183 - 187
Fresh Entry can be made once 208 is
Sustained.

Godfrey Phillips India – Major Breakout in Progress! 📌 Technical Breakdown & Swing/Positional Trade Idea
Godfrey Phillips India is currently breaking out of a 150-day broadening pattern, signalling strong bullish intent with increasing volume participation. Let’s break it down:
Key Levels & Market Structure:
Monthly Resistance Breakout (Yellow Line): The price has convincingly broken above a key monthly closing resistance, marking a shift in trend.
Supply-to-Demand Zone Flip: A critical supply zone (marked in red) was breached and is now acting as an important demand area, where buyers are likely to step in for re-entries at better prices.
Broadening Structure: The stock has followed a classic expanding range (marked by white trendlines), showing volatility compression and breakout strength.
Weekly Counter-Trendline (CT): A hidden WTF resistance line (yellow) from the weekly timeframe was also taken out, adding further confluence to the move.
Cup & Handle Breakout (Cyan Zone): A recent cup & handle breakout with strong volume clusters confirms bullish momentum.
Trading at 50-Day High: The stock is now at a new short-term high, indicating sustained strength in price action.
Glossary (For Better Understanding):
Broadening Pattern: A technical formation where price swings increase in magnitude, forming an expanding structure.
Supply-Demand Flip: A price zone that initially acted as a supply (resistance) but later turned into a demand (support) after a breakout.
Counter-Trendline (CT): A hidden trendline that acts as a resistance within a prevailing trend, often creating liquidity traps.
WTF Hidden Resistance: A key level that isn't easily visible but plays a crucial role in price reactions.
Cup & Handle Breakout: A bullish continuation pattern indicating accumulation before a breakout.
Volume Clusters: Areas where heavy trading activity occurs, often signaling accumulation or distribution zones.
🚀 Conclusion: With multiple bullish confluences, volume backing, and a clean breakout, this trade setup presents a high-probability swing & positional opportunity. However, risk management remains key!
Let me know your thoughts in the comments! Are you tracking this setup?

CAKE Ready for a Breakout? Cup & Handle Pattern in Play!Analysis: #CAKE is in a strong uptrend and is currently forming a cup and handle pattern on the 30-minute timeframe. This is a classic bullish continuation pattern, signaling a potential breakout.
Key Observations:
🔹 Higher Highs (HH) & Higher Lows (HL) indicate a healthy uptrend.
🔹 Bearish divergence spotted—indicating a possible retracement.
🔹 If support breaks, we may see a trend reversal.
🔹 If the handle completes and #CAKE breaks out, it could be an ideal buying opportunity.
Strategy:
🔹 Wait for breakout confirmation above the cup resistance.
🔹 Entry: On breakout with volume.
🔹 Stop Loss: Below recent HL.
🔹 Target: Measure the depth of the cup for a price target.
Final Thoughts:
This setup has high potential, but always use proper risk management.
What’s your take on #CAKE? Will it break out or break down? Comment below!

Ready For Next Bull run! Lets Go To 280,000BTC maintains a strong bullish trend, with the market structure consistently adhering to the Elliott Wave principles, even amid short-term fluctuations. The rounding bottom pattern remains intact, and its full impact is yet to materialize. The price has concluded sub-wave 4, and we are now anticipating the final phase to complete this minor cycle before the larger macro waves take shape.
The overarching outlook points to a surge toward $280,000, a target expected to be achieved when market sentiment is at its lowest, as institutional players and major investors continue to accumulate assets during retail sell-offs.

$GTLB is brewing ... Recent earnings estimate revisions for GitLab Inc. have been positive, indicating that analysts are optimistic about the company's near-term performance, which could be influencing the stock's potential upward trend. Plus the weekly chart showing a cup and handle pattern, which add another positive indication.

NEST - CUP WITH HANDLEPosition Update: February 6, 2025
Key factors :
1. Low-risk entry point.
2. Very clear bases with VCP characteristics.
3. Has gone through its majority line of supply.
4. Moving on its own drummer, the stock price increased while the market crashing down.
5. High relative strength stock.
6. Volume dries up as less supply coming to the market.
7. The breakout was confirmed with a huge surge in volume.
Considerations : The current market environment remains challenging, with broader indices showing uncertain and inconsistent behavior. It is very few stocks that setting up decent bases.
I’d like to see if it can hold up and follow through from here.

About to Sell Your Altcoins? STOP & Read This First!!🚀 Hey Traders! Ready for Altcoins’ Next Big Move? 👋
If you’re finding value in this analysis, smash that 👍 and hit Follow for high-accuracy trade setups! 💹🔥
I know many are frustrated and losing hope in altcoins due to the current market conditions. But selling your spot holdings now—right before a major move—could be the worst decision of your trading journey. Before making any rash decisions, read this update carefully! 👇
📊 What is Total2?
Total2 represents the total market capitalization of all cryptocurrencies except Bitcoin (BTC). It helps us gauge the strength and momentum of the altcoin market.
💡 How to Use Total2 in Trading?
📉 If Total2 is falling → BTC dominance is high, and altcoins are struggling.
📈 If Total2 is rising → Altcoins are gaining strength, signaling a possible altseason.
🔥 Altcoin Market Cap (Total2) Looks Bullish!
✅ Breakout Alert! Total2 has broken out from a cup and handle pattern on the weekly time frame and successfully retested it. This setup is a classic bullish signal, suggesting a strong rally could be on the horizon.
🚀 If this pattern plays out, altcoins could skyrocket! Be patient—your altcoin holdings may soon reward you in a big way.
⚠️ Invalidation Level
If Total2 closes below $1 Trillion on the weekly timeframe, the bullish outlook weakens. Until then, the upside potential remains strong!
💬 What’s Your Take?
Are we about to witness an altcoin explosion, or will BTC continue to dominate? Drop your thoughts in the comments! Let’s ride this market together and secure those gains! 💰🔥

Frankly !!BITCOIN is in the ascending phase by the cup and handle.
BTC is in a large C&H if it follows these pattern, the price will have a nice rally.
⭐The pattern increases the price by the amount of the measured price movement (AB=CD).
Golden analysis
Give me some energy !!
✨We spend hours finding potential opportunities and writing useful ideas, we would be happy if you support us.
Best regards CobraVanguard.💚
_ _ _ _ __ _ _ _ _ _ _ _ _ _ _ _ _ _ _ _ _ _ _ _ _ _ _ _ _ _ _ _
✅Thank you, and for more ideas, hit ❤️Like❤️ and 🌟Follow🌟!
⚠️Things can change...
The markets are always changing and even with all these signals, the market changes tend to be strong and fast!!

BTC | W-BOTTOM Pattern Continuation - UPDATEA quick continuation on yesterday's BTC update, with regards to the bullish W bottom pattern that likely takes us into the new ATH.
There are a few conditions that need to be met in order to "secure" the W pattern, but we're currently not seeing these conditions met. The good news, is that it's beginning to look more like a cup an handle pattern, also a bullish pattern.
This daily lose and especially the weekly close is going to be a KEY candle close to watch.
___________________
BINANCE:BTCUSDT

SILVER | The longest timeframe cup & handle in history!SILVER has been forming a cup-and-handle pattern for the past 45 years. And even though SILVER has made some incredible moves during that time, its price has been blatantly manipulated by the LBMA (London Bullion Market Association), central banks around the world, and a completely fraudulent derivatives market that circulates fake paper silver at hundreds of times greater than the underlying asset. Prices have been artificially suppressed for decades to prop up the global fake fiat currency Ponzi scheme and tighten the grip of control over nearly every asset and human being—making these fake currencies appear legitimate when they are clearly instruments of debt and deception.
This artificial suppression of SILVER and many other commodities is coming to an end as the debt-and-death paradigm unravels before our very eyes.
The day is rapidly approaching when SILVER will enter true price discovery, and people will not believe the price points it will reach in the very near future. Silver is one of the most—if not the most—undervalued physical assets of all time.
Good luck, and always use a stop-loss!

GBPUSD Demand Zone + Rounding OffFollowing on from the last idea I published, it looks GU is bullish and breaking the trendline. Here you would have to wait for a close above the trendline before entering. If it doesn't close above the trendline, it's not a valid entry.
However, this is a slightly riskier trade so keep that in mind.

The last bullish chance of ETHEREUM in Mid term!As you can see, the price is forming two bullish patterns on the 4h timeframe, If my view is correct, ETH will rise to $3700 .
And if this pattern is correct and breaks, higher targets are possible.
Give me some energy !!
✨We spend hours finding potential opportunities and writing useful ideas, we would be happy if you support us.
Best regards CobraVanguard.💚
_ _ _ _ __ _ _ _ _ _ _ _ _ _ _ _ _ _ _ _ _ _ _ _ _ _ _ _ _ _ _ _
✅Thank you, and for more ideas, hit ❤️Like❤️ and 🌟Follow🌟!
⚠️Things can change...
The markets are always changing and even with all these signals, the market changes tend to be strong and fast!!

LINK is bullish now and many Traders don't see it !!!You might wonder why altcoins haven't experienced significant growth compared to Bitcoin. The answer lies in meme coins, as they have caused substantial harm to the market. How many cryptocurrencies do we really need? So, focus on the primary cryptocurrencies in this market. In my opinion, everything is beautiful for the first time, so only pay attention to Dogecoin among the meme coins.
Technically, the cup and handle pattern has broken, which indicates a price increase. The price can easily reach the target . If we measure the AB range, which is $17.5 , we can say that the price will easily grow $37 equal to CD.
Give me some energy !!
✨We spend hours finding potential opportunities and writing useful ideas, we would be happy if you support us.
Best regards CobraVanguard.💚
_ _ _ _ __ _ _ _ _ _ _ _ _ _ _ _ _ _ _ _ _ _ _ _ _ _ _ _ _ _ _ _
✅Thank you, and for more ideas, hit ❤️Like❤️ and 🌟Follow🌟!
⚠️Things can change...
The markets are always changing and even with all these signals, the market changes tend to be strong and fast!!

SOL Forming Cup & Handle?In weekly chart, SOL forming Cup & Handle pattern. As we all know, SOL was Make a new ATH after break previous high on weekly chart, but its not confirm break cause the candle failed to close above previous High. In other PoV we got clear Cup & Handle pattern on weekly chart. If this scenario run, we can see SOL on $371 soon
