Double Bottom for the BREAKOUT of Cup & Handle!?BNBBTC forming Cup and Handle for a long time. We are seeing some really nice Cup and this potential Double Bottom can be our Handle. Double Bottom to the pattern line of Cup and Handle and then a breakout. This is what I see. What do u think guys?
Cuphandle

WAVES CUP HANDLE + DOUBLE BOTTOM FORMATION First rectangle double bottom formation target
Second rectangle cup handle formation target

NULSETH LONG Opportunity ApproachingWatching NULSETH to come off to the 3800 Satoshi level following an inverse-cup-and-handle. BUY around the 3800 with exit 5600-5700. Watch RSI for over-extension of the market sale for buy timing.

NULSETH LONG Opportunity ApproachingWatching NULSETH to come off to the 3800 Satoshi level following an inverse-cup-and-handle. BUY around the 3800 with exit 5600-5700. Watch RSI for over-extension of the market sale for buy timing.

Cup and Handle on $NAV
Cupped formed between last september and mid january
Currently in Handle
Will continue down mini-bear-channel until about 0.618 Fib , then bounce up to finish handle
Distribution weakening/accumulation getting stronger
Support also at 1 fib, if we dump past 1 fib, be concerned
200 ema holding on 4H, watch for price to go below
Feel free to follow on Twitter: @azorahai06


DCT/BTCNot financial advice Just Idea
Should follow cup-handle pattern. Stochastic RSI curving up and moving averages showing up trend.

DCT/BTCNot financial advice Just Idea
Should follow cup-handle pattern. Stochastic RSI curving up and moving averages showing up trend.

Legends Room(LGD) Bullish after completing C&H. Target-29.8k satLGD completed its handle in the previous candle on a 1D chart, Making it bullish
now the previous resistance is what we looking for it to break.
Short Term target - 29,850 satoshi

GBP/USD Cup & HandleIf you are Risk Adverse, can start Long Pos. once support line broken. Otherwise just enter Pos. from now
TP: 1.4x or RSI reaching 70-77
Trade Duration: 7-20 Days
SL1: Closed Candle break below 13EMA
SL2: Closed Candle break below 48EMA, or Reduce exposure
Conviction: 7/10
Discipline: 9/10

BUY Signal APPC - Clear Cup&Handle formation on 4h! 200% GAINSAPPC has just been added to Binance and CoinMarketCap! Their top advisors are Google Play , Goldman Sachs , and Ripple !
Appcoins made by Aptoide, a major compagny. They have already 200Millions active users, a working product, a partnership with Google -0.06% Play and made +70% on a BTC -2.68% bullish without being on coinmarketcap.
This is the future official mobile cryptocurrency.
Aptoide is one of the largest Android App Stores, with over 4 billion downloads, 200 million users and direct engagement with over 12,000 developers including Gameloft and Zeptolab. Aptoide has a network of over 70 corporate partners, including OEMs and Telecom companies such as Xiaomi, Oppo, Meizu and Vivo -0.68% The ICO 0.00% is Backed by Google -0.06% Play / Goldman Sachts.
Appcoins Discord Server:
discord.gg
Upcoming roadmap event:
Open Source Implementation - Release of the first beta version of Aptoide with AppCoins support.
It is an open and distributed protocol for app stores based on the Ethereum 9.12% blockchain, using the ERC20 standard. AppCoins proposes to move three of the most critical flows of App stores to the blockchain: advertising, in-app purchases, and developers' approval to allow transactions to occur through a blockchain-supported cryptocurrency in a decentralized, neutral and open system.
Register to Binance Exchange: www.binance.com
Donate AppCoins: 0xe9add959c8a49780ca0cbeb21f78860a2fcb35c4

Ganesh Housing - Meduim-Term; CBSL 123, Targets 170-180-190 Ganesh Housing Corporation Ltd
NSE Symbol: GANESHHOUC
CMP: 150.8, P/e: 10.05, P/Bv - 0.49, Mcap/sales: 1.02, Div. Yld: 1.38%, D/Eq: 0.90
One can look for buying opportunity in Ganesh Housing, with the Closing basis SL of 123 for the targets of 170-180-190
Key Technicals
* Good volumes
* Cup and Handle Break out
* Trend line break out
Key Fundamentals
* Fundamentally Good stock
* Valuation wise - Under valued compared to peers
* Financially Strong

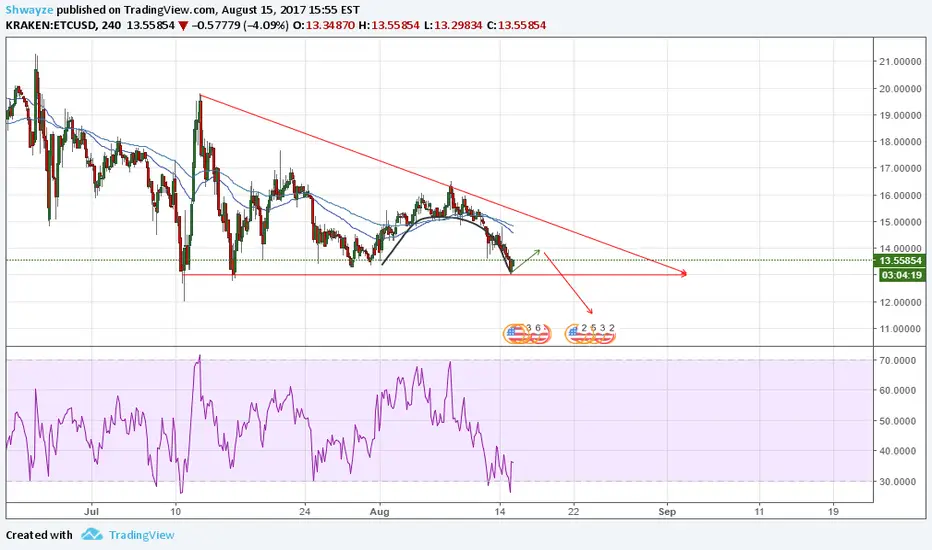
ETC 4HR chart, bearish triangle, inverse cup/handleThere are two ways to look at this chart from what I see. One, there is a double bottom, which also happens to form the bearish triangle. If there was massive volume displayed by the RSI, I would think this could be a reversal signal. But there isn't. Price didn't bounce with much bullish invigoration.
The second pattern I see, is an inverse cup and handle forming at the end of a long bearish triangle. The market has been going steadily down for some time now, maintaining the resistance level at $13.00. However, the market will test this level. We should see a slight up, which will form our handle.
If this pattern plays out, two things will happen. The bearish triangle will breakout at a downward trend, and the volume behind it will be considerable. The price should move down to $11.00, as the depth of the cup will be the blueprint we can use to find our next level down.
If we draw a fibonacci retracement for the entire upward movement on the daily charts, we will see that 11.8 is an important fibonacci resistance level, which is the 50%. But if this breaks, it will continue to 61.8% (longer term, now that I'm on daily charts) which roughly correlates to $9.50. Fibonacci resistance shown in chart below.
However, there is still a chance for a reversal pattern at bottom channel currently. Just keep an eye on volume and if the chart breaks downwards, we can start setting our targets.