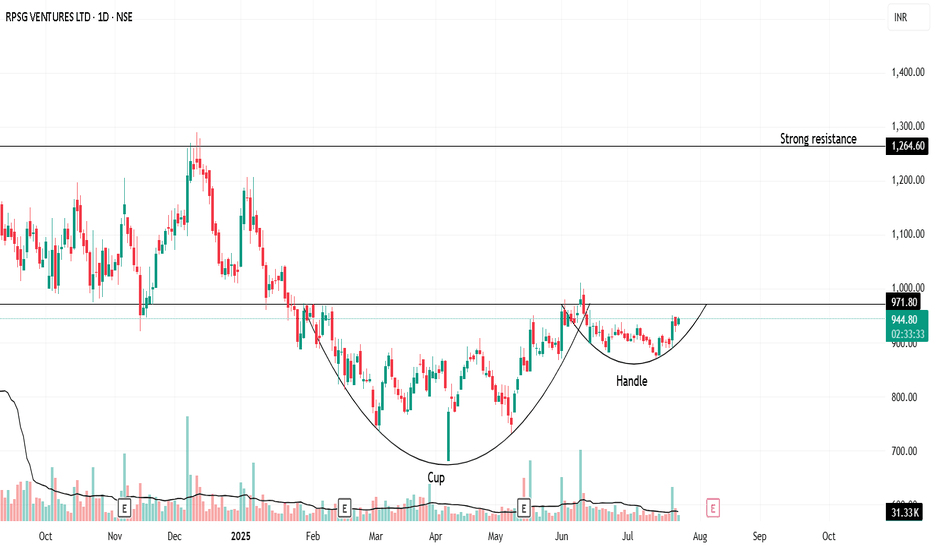
"Handle Tightening… Is RPSG Ready to Explode?"Once upon a trend, RPSG Ventures brewed a picture-perfect Cup & Handle—a structure born not out of coincidence, but crowd psychology and silent accumulation.
After nearly 9 months of consolidation, the stock crafted a deep, symmetrical cup (between November 2024 and May 2025). Traders forgot about it. Volumes dried. Hope faded.
But quietly, the handle formed—short, shallow, and tight. It’s not just a chart pattern—it’s a test of patience. And now, the breakout zone at ₹971.80 is like the rim of a boiling kettle: silent… until the whistle.
🧭 Possible Future?
If it breaks out: A rally toward ₹1,264 isn't just possible—it’s logical.
If it fakes out: Back to base, retest near ₹890.
💬 What makes this unique?
This isn’t just technical analysis. It’s a behavioral pattern. Fear, exhaustion, optimism—they're all baked into this structure. Cup & Handle isn’t bullish because of lines—it's bullish because it reflects crowd hesitation turning into confidence.
🚨 "Spill or Serve?" — comment below .
🧠 Watch the volume.
🛑 Don't jump the gun.
✅ Let the breakout come to you.
📜 Disclaimer:
This is not trading advice—this is pattern psychology in motion. Always consult your financial advisor before making real trades. This story is meant to provoke thought, not profits.
Cuphandlepattern
MYRO has good signals for continuing the bullish movementTechnically, the cup and handle pattern has broken, which indicates a price increase. The price can easily reach the target goals.
Give me some energy !!
✨We spend hours finding potential opportunities and writing useful ideas, we would be happy if you support us.
Best regards CobraVanguard.💚
_ _ _ _ __ _ _ _ _ _ _ _ _ _ _ _ _ _ _ _ _ _ _ _ _ _ _ _ _ _ _ _
✅Thank you, and for more ideas, hit ❤️Like❤️ and 🌟Follow🌟!
⚠️Things can change...
The markets are always changing and even with all these signals, the market changes tend to be strong and fast!!
IDEA:CUP AND HANDLE FORMATIONThe NSE:IDEA is currently forming a classic Cup and Handle pattern. This bullish continuation pattern suggests a potential upward movement once the pattern completes and breaks out. Here's a detailed breakdown of the pattern and the trading strategy:
1. Cup Formation:
The stock has undergone a rounded bottom, creating the "cup" part of the pattern.
The left side of the cup was formed due to a decline in price, reaching a bottom before rising back up to the original level.
This cup formation indicates a period of consolidation and accumulation, where buyers are gradually gaining control.
2. Handle Formation:
Following the completion of the cup, the stock entered a small consolidation phase, forming the "handle."
The handle typically slopes downward or moves sideways, showing a slight pullback.
This pullback is generally short-term and should not exceed more than one-third of the cup's depth.
3. Breakout Point:
The ideal entry point for traders is the breakout above the handle's resistance level.
Traders should look for a significant increase in volume during the breakout to confirm the move.
Target:
The target price can be determined by measuring the depth of the cup and adding it to the breakout point.
Target Price Calculation:
Target Price: 25
Stop Loss:
Place the stop loss below the lowest point of the handle to protect against a false breakout.
Stop Loss Price: 15.
Disclaimer: This analysis is for informational purposes only and should not be considered as financial advice. Always conduct your own research and consult with a financial advisor before making any trading decisions.
HBAR'S biggest percentage gain so far, is YET TO COME!Since I predicted the coming cup & handle pattern well before anyone else on Jan 2nd, HBAR has broken out of the cup's handle and ran for more than a 100% gain. The price peaked, dropped, and retested the rim-line; now it's going to make the biggest gain of the entire pattern.
Buckle your seatbelts!
Good luck, and always use a stop-loss!
WABAG - Cup with handle BO NSE:WABAG
As seen on the chart, Va Tech Wabag Ltd has formed a nice U-shaped Cup, and the volume was low when it was forming the handle and the breakout was with a good volume.
There is a high probability that this pattern will be successful.
Disc - invested, for educational purposes only
Another similar setup was with Finolex Cables
$TATAPOWER - Cup with handleAs seen on the chart, NSE:TATAPOWER has formed a nice U-shaped Cup,
The stock was in an uptrend before forming Cup (up 27% recent bottom)
Took 51weeks to form the complete pattern.
47 weeks for Cup with a correction of ~25%
4 weeks for Handle with a correction of ~6%
Volume dried up during the first part of the cup.
But was good when coming out of the cup and also at the BO of the handle.
There is a high probability that this pattern will be successful.
With regard to recent results,
Total revenue was INR ~15000 cr, 2% Y-o-Y and 18% Q-o-Q.
EBITDA at 3005 cr, 43% Y-o-Y and -3% Q-o-Q.
PAT at 1141 cr, 29% Y-o-Y and 22% Q-o-Q. (after exceptional items)
15 consecutive quarters of PAT growth (Y-o-Y)
NSE:LEMONTREE 's pattern is still in progress
Disc - invested, for educational purposes only
Cup with handle BO in $NSE:SBILIFE NSE:SBILIFE
Pattern details:
Sideways trend before forming Cup with handle pattern
Cup with ~20% correction and length of cup 26 bars
Handle length is 9 weeks and ~6% correction.
Volume needed to increase the success probability
PAT for the quarter ended 30 June 2023 at 381 cr, 45% growth Y-o-Y
NSE:LEMONTREE 's and NSE:TATAPOWER 's patterns are still in progress
Disc - invested, for educational purposes only
$LEMONTREE - Cup with handle BOAs seen on the chart, NSE:LEMONTREE has formed a nice U-shaped Cup,
The stock was in an uptrend before forming Cup
Took 38 weeks to form the complete pattern.
27 weeks for Cup with a correction of ~27%
11 weeks for Handle with a correction of ~10%
Volume dried up during the initial part of the cup and handle.
But was good when coming out of the cup and also at the BO of the handle.
There is a high probability that this pattern will be successful.
With regard to quarterly results,
Total revenue was INR ~222 crores, which increased 16.8% year-on-year.
The net EBITDA margin in Q1 stood at ~47%
The PAT grew by 103% year-on-year from INR 13.6 crores to INR 27.5 crores.
Disc - invested, for educational purposes only
Another similar setup was with Finolex Cables and Va Tech Wabag Ltd
CUP AND HANDLE PATTERNstock took 4 year time complete cup pattern and only 6 month handle build at level of 95 cu and handle pattern breakout completed with high volume.
stock treading PE below the industrial PE.
completing cup and handle at level 95 with runaway gap developed this also indicting stock can go upside
stock debt to equity is high 1.36 debt is high.
no recommendation for but and sell
follow us
PI INDUSTRIES ANALYSIS!!RSI INDICATOR: is something which says the actually part of the price should be placed.
cups and handles is a very bullish price pattern formation.
and top of that, if rsi indicator is forming such pattern, then to speak on to it, the stock is a very great stock.
i have check the fundamentals. the rations, sales analysis are very greatly performing.
the two black line are the trend formation after the corona 2019 crash.
and blue line is the old trend.
the stock did gave its all time high recently. its possible to go more higher, since there is no drawback, or major risks associated to this stock.
recent quarters too outperformed from the analyst projected estimates.
great stock for swing trading and long term .
RELL Cup w/ Handle - Long TradeRichardson Electrics (RELL) makes components for microwaves, power grids, generators and data display monitors. The stock is a rare sign of strength in an otherwise abysmal market.
RELL is completing a cup with handle pattern that began in January, and the stock is currently just 5% from new all-time highs. The relative strength line has been surging for the last 6 weeks. It now has an RS rating of 98/100 on MarketSmith. In other words, RELL is outperforming 98% of all other stocks.
The volume up/down ratio is a bullish 1.39 and we have seen several high-volume up days over the last few weeks - a good sign that institutions are likely building positions in the stock.
I've also overlaid the fundamentals at the bottom of the chart. As you can see, sales are growing at roughly 30% per quarter and profits are advancing at a triple-digit rate. RELL posted $0.25 EPS in 2021 and analysts are forecasting $0.91 in 2022 - a 264% increase year over year.
I think RELL is a buy here. If you want further confirmation, wait to see if the stock hits 15.70 to make new all-time highs.The stop would be beneath the swing low at 13.35 for a 9% risk on the trade.
Cup and Handle baseVCP characteristics.
Exhibiting strong relative strength.
volume dry ups along the base, good buying volumes and trading above key moving averages.
Broader market is weak, therefore sizing 10% of portfolio.
Buy-Stop order set at 249.75
Publishing for my own reference. Not an investment/trading advise.
Cup of SHIB? SHIB has formed a nice cup and handle seen on multiple time frames. I took a long at 0.000023 and leave that open until I see this break one way or another. If I were playing the cup, I'd set the profit like I did above, the price plus the candle height. Don't lose your SHIB if I'm wrong. Stop-loss can be pretty quick in any case, I believe. Mine's anything closing below the handle once the penant breaks.
As always, Im new to TA, so I want to know if y'all disagree or if I'm reading something wrong, let me know what you think.
Nas100 into CPI Data at 08.30 ETNas100 into CPI data, reverse cup and handle and then vshape recovery into us session giving us maybe a nice 4h candle with a big nice wick or doji.
The time doesnt correspond on the chart but it would be ugly to cram it all together. If we bounce, its 30 min before US open about
MakiSwap LongMakiSwap found support on $0.17 and is starting to form a W pattern which means a reversal in the trend to the upside. With the alt coins season coming I would expect MakiSwap reaching the 1.27 of fibo at arround $0.55 by the end of the year,, we could see a cup handle pattern in the next 2 months. Let's see


