HAL cup handle pattern breakout HAL was made a breakout of its cup handle pattern
Buy HAL at 2684
Target 2763 2815 2900 3000
Sl 2520
Cupnhandle

Stellar Lumens - Looks good technical and fundemental - 2023!!This is not financial advise to go all in big, DCA and use risk management otherwise if you like go big on this investment
Stellar Lumens is more than an investment hold to 2025 and more, you can trade it if you like
On the fundamentals side Stellar Lumens has so much going for it. Too many turning a blind eye on this because it moves slowly
Would not be surprised if intuitional investors buy up big in big volumes for 2023
Some links to do with Stellar Lumens for own research
www.coindesk.com (IBM partnership with Stellar Lumens to issue stablecoins through World Wire)
stellar.org (USDC stable coin running on the Stellar Network)
stellar.org (Moneygram partnership with Stellar for remittance payments)
satoshipay.medium.com (SatoshiPay partnership with Stellar for micropayments)
stellar.org (Representing Blockchain on the Commodity Futures Trading Commission’s Global Market Advisory Committee)
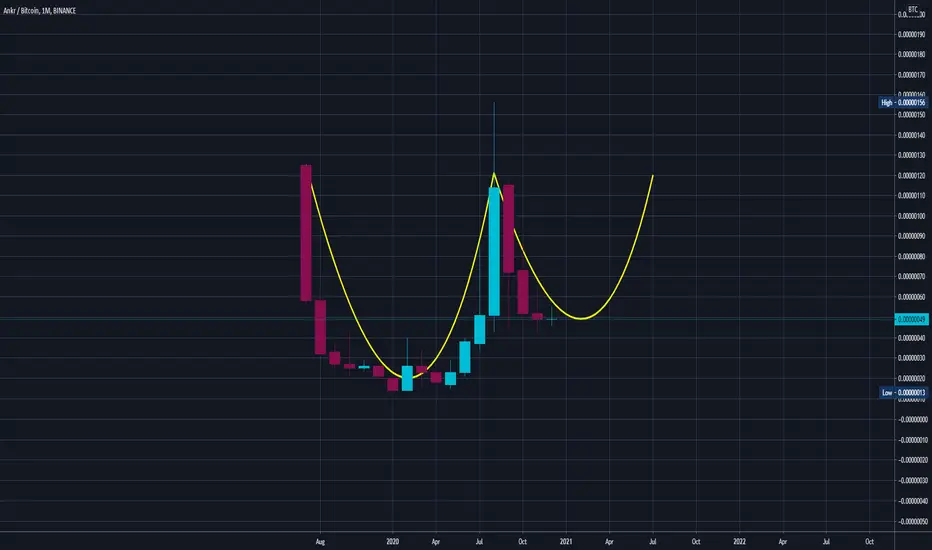
Stellar Lumens Coffee Cup pattern on the Weekly chart - see the handle of the coffee cup? Once break it on the weekly, it has to close above $0.175 US and than it can do 10x - believe it reach $1.75 US, instead of the $0.82 US last high. Now it can bottom out 1 more time till about April 23 around $0.0676 US, the last bottom on the weekly was $0.07 US and believe it has bottom out. You can wait or DCA now. I believe it's still a very good buy now, trying to work out the perfect bottom forget it. On Weekly Stellar Lumens can still be bearish around June 23rd however for that case it going up slowly till it breakouts
If you confident about Stellar Lumens I would like this article post to have more research links for other bullish scenarios for the Stellar Network
Could SWIFT payments be replaced on the Stellar Lumens network as the alternative faster and reliable form of payment transfers?
Could Nasdaq exchange allow digital payments for trading on the Stellar Lumens network?

Balkrishnabalkrishna made cup n handle pattern on daily TF & broke above neckline of 2270(happens to be multiple resistance zone which rejected multiple times) with good volumes.
Could be bought with mentioned stoploss & target.

bullish and bearish cup and handle pattern hello dear traders,
Here are some educational chart patterns that you must know in 2022 and 2025.
I hope you find this information educational and informative.
We are new here so we ask you to support our views with your likes and comments,
Feel free to ask any questions in the comments, and we'll try to answer them all, folks.
What are the Cup and Handle chart patterns?
A cup and handle pattern is a pattern of price movement on a trading chart that resembles a cup with a handle, from which it derives its name. The cup section of the pattern is formed from a U-shaped price movement, while the handle is a short price channel from the edge of the cup. The handle is actually a pullback after the right Swing of the cup.
As is the case with other chart patterns, the cup and handle pattern shows you how the price has moved in the immediate past, which can help you predict future price movements. The time it takes for pattern formation varies: pattern formation can be as short as seven weeks or as long as 65 weeks or more.
There are two types of patterns: the more popular bullish cup and handle pattern that you can see in bull markets and the inverted cup and handle pattern, also known as the bearish cup and handle pattern, that you can see in bear markets.
In the bullish variant, which occurs in an uptrend, the pattern is formed by a downswing (pullback) that gradually turns into an upswing (in the trend direction) followed by a small pullback (a slight downward drift that creates a handle )
The reversal/bearish type, which appears in a downtrend, is formed by an upswing (pullback) that gradually turns into a downswing to continue the downtrend, but then pulls back (handle) a bit.
Understanding the structure and inversion of the cup and handle pattern
The cup and handle pattern can form in any time frame, but as a swing trader, you should focus on the daily time frame. To identify the cup and handle pattern or reversal type, you need to understand the price movements that form its structure. For example, to be a continuation pattern, there must be a prior trend before a cup and handle pattern can form. Let us look at both patterns one by one.
The bullish Cup and Handle pattern:-
An uptrend: For a bullish cup and handle pattern to form, there must be an established uptrend, but the trend must not be too mature because the more mature the trend, the less likely it is to continue. A trend on the daily time frame that is a few months old is fine.
Cup: The cup is formed from a normal bust that gradually curves upward, creating a "U" shape. It should have a bowl or round bottom and not a sharp "V" shaped bottom. The round bottom ensures that there is a consolidation pattern with valid support at the bottom of the "U" cup. In addition, the pattern on both sides of the cup should be of equal height, but this may not always be the case.
Cup depth: The cup should not be too deep. Generally, the cup depth should be around the 38.2% Fibonacci retracement of the previous advance. However, with overreaction in more volatile markets, retracements can range from 38.3% to 50% Fibonacci. In extreme cases, the retracement can reach 61.8% Fibonacci, which is in line with Dow Theory.
Handle: This is a pullback that forms after the higher forms on the right side of the cup. This is a minor pullback or consolidation that sometimes resembles a downward-sloping flag or pennant. This is just a small, final consolidation/pullback before a bigger breakout, but could lead to a retracement to the 38.2% Fibonacci retracement of the swing high of the cup. The smaller the retracement, the more bullish the formation and the more significant the breakout.
Duration: While the cup can last from 1 to 6 months (or several years on a weekly chart), the handle can take about 1-4 weeks to form.
The bearish/inverse Cup and Handle pattern:-
A downtrend (bear market): There must be an established downtrend for the inverted Cup and Handle pattern to be meaningful. However, the trend should be relatively young as downtrends don’t last that much. On the daily timeframe, the trend should be from a few weeks to a few months.
The dome (inverted cup): The dome of this pattern is formed by a normal price rally in a downtrend (pullback), which gradually turns to a downward swing, thereby forming a dome shape. It should have a rounding top and not a sharp pyramid top. A rounding top ensures that the inverted cup is a consolidation pattern with valid resistance at the top of the structure. Both sides of the dome may or may not have equal lows.
Dome height: The dome should not be too high. Usually, the height should be about 38.2% Fibonacci retracement of the preceding downswing, but the retracement could range from 38.3% to 50% Fibonacci in more volatile markets with over-reactions. In extreme situations, it could be up to 61.8% Fibonacci.
The handle: This is a slight pullback that follows the downswing that forms the right side of the dome. It is a small consolidation that often looks like a bearish flag or pennant that slopes upward. The handle can retrace up to 38.2% Fibonacci of the dome’s swing down, but the smaller the retracement, the more bearish the formation and the more significant the breakout.
Duration: The dome may take about 4 to 6 weeks or more to form, while the handle may take about a week or two.
How to trade the Cup and Handle chart pattern:-
The Cup and Handle pattern and the inverse type are potent trend continuation signals. When you see any of them, you have to trade in the direction of the trend. While you can trade these price action chart patterns on their own, it may be wise to confirm the trend with some tools, like trend lines and moving averages.
Trading the bullish Cup and Handle pattern:-
The bullish Cup and Handle pattern forms an uptrend and gives a bullish breakout signal. You might have to fix an uptrend line or a moving average to confirm the trend. Here is how you trade the pattern:
Entry:-
With this pattern, a buy signal occurs when the price breaks out of the upper trend line of the price channel that forms the handle. There should be a substantial increase in volume on the breakout above the handle’s resistance. Go long at the close of the breakout candlestick. Alternatively, you place a stop-buy order slightly above that upper trend line. Sometimes, it is prudent to wait for a breakout above the resistance line established by the highs of the cup.
Stop loss:-
You need a stop-loss order to get you out of the trade if after buying the breakout, the price drops, instead of rising. Your stop loss should be at a level that invalidates the pattern’s signal, and that level is below the lowest point of the handle.
Profit target:-
There are two potential profit target levels for this pattern. The first profit target is estimated by measuring a distance equivalent to the size of the handle, starting from the breakout point. The second profit target is estimated by measuring a distance equal to the depth of the cup, again, starting from the point of the breakout.
Trading the bearish Cup and Handle pattern:-
The bearish Cup and Handle pattern forms a downtrend and is traded as a bearish breakdown signal. So, you can use it to go short on the market if you want. This is how you trade the pattern:
Entry:-
You have a sell signal when the price breaks below the lower trend line of the price channel that forms the handle. There should be a spike in volume when this breakdown happens. You may go short at the close of the breakdown candlestick, or you place a stop-sell order slightly below that lower trend line. It might be wise to wait for a break below the support line established by the lows of the inverted cup.
Stop loss:-
When you are trading the inverse Cup and Handle pattern, you should place your stop loss order above the highest point of the handle.
Profit target:-
Two potential levels are good for your profit target: the first profit level is estimated by measuring a distance equal to the size of the handle, starting from the breakdown point, while the second profit level is estimated by measuring a distance equal to the height of the dome (inverted cup), starting from the point of the breakdown.
Trade with care
If you like our content, please feel free to support our page with a like, comment
Hit the like button if you like it and share your charts in the comments section.
Thank you

US Dollah, WTFork Mate?No fundamentals at all, just a look back to 2020 and where we might be headed near term.
I know the PPT will do what it does but I'm eyeballin' the convergence of some really low hanging fruit metrics
- EMA
- Fib eyeball retrace from long term lows
- fork action long term
- long term Cup & Handle post breakout
Just DCA my dudes and avoid an "all-in" on this maybe.
GL!
* * * not investment advice * * *

Bitcoin Cup & HandleBitcoin is forming a cup and handle pattern on the Daily chart, and is currently close to breaking out. Although we can't know for sure if it will break to the upside or downside, Cup & Handle patterns are known to be bullish, therefore, the potential bullish target is available on the chart.

PVRPVR made cup n handle pattern on hourly/daily charts & broke out of it with very good volumes.
Could be bought with mentioned stoploss & targets.

NFLX: GAP FILL PLAY AND POTENTIAL CUP N HANDLENFLX has lost 76% from its November highs to its July lows.
Looking at the chart from a purely technical point of view, here is what I see:
- the stock has not retraced much of its down move. A 0.382 retrace would be at $366 and a 0.5 retrace would be at $428.
- There's a huge gap between $331 and $249/250. If we were to fill the gap, the target would be $331. To play the gap fill I' d wait for the price to break $250.
- A cup and handle is forming with a target between $331 and $366. However the pattern will only be confirmed should we break $250.
I'm neutral now, but I'm watching the stock closely. A break of $250 would trigger a long entry with a stop at 240.
Keep it on your watch list.
Trade safe.

Possible BOIL Cup and Handle in formation ENERGY PLAY LONGBOIL could be setting up a long continuation trade
Now working on the handle. MACD shows the lines crossed
while under the histogram is very often an excellent sign.
Time will tell- My preferred trade will be call options
expiring in late January or February.
( This is a triple-leveraged natural gas play with
the upcoming winter heating season expected to be
expensive especially in Europe. The inverse is KOLD
which would be a good put option right now.)
AMEX:BOIL

DALBHARATDalbharat is on the way to complete cup n handle pattern on daily charts, its not confirmed yet but i presume it ll so you dont have lose points till breakout.
Risk-Reward is very much favourable to bulls.
Could be bought with mentioned stoploss & targets in a month time. So buy in delivery & hold for good returns.

Acuity Brands Cup and Handle Pattern Acuity Brands, Inc (AYI) is an industrial technology company. They provide lighting and building management solutions in North America and internationally. The company was incorporated in 2001 and is headquartered in Atlanta, Georgia. AYI is a component of the S&P 400 Mid Cap Index
Market Cap: 5.968B
Beta (5Y Monthly): 1.54
PE Ratio (TTM): 16.75
Average Volume: 277,357 (1)
Cup and Handle (Bull Market Stats):
Overall performance rank (1 is best): 3 out of 39
Breakeven failure rate: 5%
Average rise: 54%
Throwback rate: 62%
Percentage meeting price target:
The above numbers are based on 913 perfect trades. (2)
AYI
Daily Volatility (Standard deviation YTD): 2.20%
Annualized Volatility (Standard Deviation YTD): 34.24%
S&P 400 Mid Cap Index
Daily Volatility (Standard deviation YTD): 1.59%
Annualized Volatility (Standard Deviation YTD): 24.76%
(The above were calculated using historical data)
The data above shows the daily and annualized volatility for AYI and the index it is a component of. As you can see AYI has a higher daily and annualized volatility. This can be good or bad. Depending on the way the stock goes and your position. For this pattern, I would say this is a good thing - the pattern requires volatility to breakout and reach the price target.
AYI has formed a cup and handle chart pattern. This pattern, as the name suggests, looks like the top ridge of a cup and the handle. The pattern forms as follows: price rise - left peak forms - price goes down at an angle and forms a trough - price rises again at an angle to form a peak. Sometimes, as in this case, the right peak may form a flag/consolidation pattern as well.
The blue line on the chart above represents a line of support for the stock. The red box represents what could possibly be a previous cup and handle position. However, in this pattern and the one on the right, I'm not that convinced of their authenticity.
The price rise before the pattern formations is not that convincing. I would ideally like to see an upwards trend for at least 3 months. The price has been in a downward trend YTD and then moving horizontally for nearly six months. However, this horizontal movement may be useful - if there is a upward breakout, the momentum could be strong.
Cup and handle patterns are ranked 3/34 patterns - meaning when done right, the pattern can bring good performance. The Breakeven failure rate is 5% which is low and hence a good signal. The Throwback rate is 62% which may be a concern. Especially if the pattern is not that strong - as in this case.
Totaling this all together, I would give this pattern a rating is 3/5. The ROI may not seem sufficient to justify a long position. Henceforth this is a riskier position.
The main issues are:
A previous cup and handle position formed before that did not breakout
Lack of a strong upwards trend before the pattern formation
The pattern duration is around 10 weeks. This is within the range of ideal 7 - 65 weeks, albeit at the lower end of the spectrum.
The price target is the difference between the right peak and trough * the percentage meeting price above:
$204.54
From the current price that represents a 9.13% ROI.
Macroeconomic considerations:
Interest rates are rising and so will inflation. We are most likely already in a recession. I would not be concerned about this for this trading idea. This will most likely be a short-term trade for a couple of weeks once the stock breaks out with a close above the trendline.
Fundamental analysis:
Since this will be a short-term trade, I did not find the need to include any further research- the next earnings is not until January so no concerns.
References:
1 finance.yahoo.com/quote/AYI
2 thepatternsite.com/cup.html

UPLUPL made cup n handle pattern on daily/hourly charts with good volume & also broke/sustaining above previous swing high of 727.
Could be bought with mentioned stoploss & target.

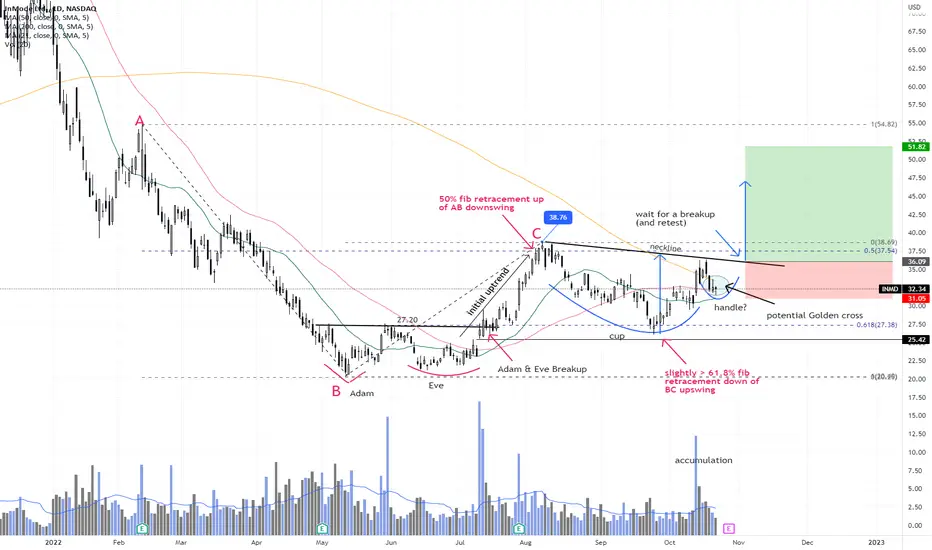
INMD - potential Cup & HandleINMD seem to be a great study on chart patterns and fibonacci retracements! :)
The stock first broke out from an Adam & Eve neckline @ 27.20 on 13 July, propelled 42% from here to a high of $38.76 (which was a 50% retracement up of the intermediate downswing AB).
It then lost momentum and started a steep pull back, finding support only around 61.8% fib retracement of the recent upswing AB. This steep retracement and subsequent action is beginning to shape into a potential Cup & Handle pattern (a pattern which is a lengthy "pause/consolidation" in a prior uptrend).
With earnings round the corner (expected on 3 Nov), will it be the catalyst that propel the stock to successfully break up from this C&H formation? If and when it does, we will have a golden cross (20day MA crossing above 50day MA) as well.
Nothing is guaranteed so we can only wait and see! LOL. Earnings can swing both ways although the strong volume accumulation on 13 Oct seem to suggest expectations are to the upside.
If and when the stock breaks up, then it further consolidates the stock's recovery is well underway (even if it might still be volatile). Long @ breakup or at first initial pullback towards C&H neckline Initial stop loss with be at most recent pivot low (C&H's "handle's" low)
Disclaimer: Just my 2 cents and not a trade advice. Kindly do your own due diligence and trade according to your own risk tolerance and don't forget that money management is important! Take care and Good Luck!
ACCACC made tilted cup n handle pattern on smaller time frames with good volumes.
Could be bought with mentioned stoploss & targets.

BULLISH OP/USDT (Cup & Handle pattern)- Even with a lot of bear market drops, OP held like a boss
- Formed a bullish signal: cup n handle
- Smothed EMAs / MA point to nice support ahead
- OP is a layer 2 solution and ETH just merged.
- OP is still so young... (give it space to grow ☕)
I will keep this post updated with more information I find around there, for now I'm super bullish in Optimism (OP). :)
- If you enjoyed my TA please give it a boost! <3

Cup n handle - BULLISH in OPI believe OP is forming a cup n handle which is a bullish signal/pattern.
Visible in weekly TF and daily.
Bullish! Buy n HODL.
LONG!

Valiant Cup and Handle breakout coming soonReversal pattern found in Valiant Organic
Cup and handle
Breakout above 735
Stay tuned

CanfinHomesCanfinhomes made cup n handle pattern on daily charts with very good volumes & trading above neckline comfortably.
Could be bought with mentioned stoploss & targets.

WAKE UP DEGEN! ETH Cup and Handle !Such an obvious trade, how can you be this stupid to short here.
Blatantly obvious cup and handle opportunity, sure it can be invalidated but the risk to reward here is too high to pass up.
Ripping a fat juicy trade here, not financial advice.

CUP AND HANDLE TO SHOOT US TO BEAR MARKET RESISTANCE LINEIf we can hold this level (which has strong support at the 200d MA, we should be able to form this cup and handle breakout back into the $2000's

#3 Bullish Pattern: Cup and HandleRanked at #3 in the Bullish Pattern series is the Cup and Handle Pattern.
Cup and handle pattern typically takes many months to form but the pattern is unmistakable similar to a cup with a handle.
The pattern begins with a sell off with volume, tapering off and remaining flat before volume picks up and forms the right side of the cup.
There are 2 types of Cup and Handles.
U shaped -A longer, flatter bottoms provide stronger signal.
V shaped - V quickly recovers, should be avoided.
Handles decline can be up to 1/3 of the cups right side with traditional handle performing a test at the 50% retracement level.
The price target is calculated using the bottom of the cup and the handles breakout.
In the case of CHWY, the breakout to the price target is nearly complete (may already be in at 52).
The next bullish pattern is #4 The Bull Flag

ABFRLABFRL made cup n handle pattern on daily/hourly charts & comfortably trading above cup with good volumes.
Could be bought with mentioned stoploss & targets.
