EURUSD: Best buy long term but 4H MA200 needs to breakEURUSD hit the bottom of the long term Channel Up, as well as the 1D MA50, turning the 1D technicals red (RSI = 46.112, MACD = 0.003, ADX = 28.557) for the first time since January 6th. That was coincidentally the last Higher Lows at the bottom of the Channel Up which kick started a +4.20% rally. The previous Higher Lows also made a +4.20% rally so it is a recurring sequence.
Being also on S1, which is holding, we have entered a long aiming just under a new +4.20% projection (TP = 1.11000). The only obstacle is the 4H MA200 which is resisting rather intensively. Failure to break it validates the Jan 3rd - Jan 6th 4H RSI bottom formation, which means that there is one last low to be made before rebounding. We expect that to be on top of S2 near 1.0600, which will be our 2nd buy entry but with a lowered target (TP = 1.1000).
If the bottom of S2 breaks, the uptrend is negated and we will turn net short first to S3 and then to the 1D MA200.
## If you like our free content follow our profile to get more daily ideas. ##
## Comments and likes are greatly appreciated. ##
Currencytrading

AUDUSD: Hit the 1D MA50 and reboundingAUDUSD hit yesterday the 1D MA50 and today at least before Powell's speech, was staging a big rebound. That hit was also made at the bottom of the long term Channel Up started in November. With the 1D technicals neutral (RSI = 49.300, MACD = 0.004, ADX = 28.417), we see this as a good buy entry, targeting on the long term just under the R1 (TP = 0.71350). The short trigger is the 1D MA200, aiming at the top of S1 (TP = 0.66800).
## If you like our free content follow our profile to get more daily ideas. ##
## Comments and likes are greatly appreciated. ##

GBPJPY: Excellent sideways opportunityGBPJPY is bearish on the long term as it remains under the 1D MA50 (right chart) with technicals all in red (RSI = 41.765, MACD = -0.860, ADX = 25.857) despite trading within a range since the end of December.
This range is practically what we want right now as the sideways price action offers the best scalping opportunity for at least the next week. The price is approaching S1 where we will long to R1 and reverse to a short. Repeat until either the top of R1 and bottom of S1 break.
## If you like our free content follow our profile to get more daily ideas. ##
## Comments and likes are greatly appreciated. ##

AUDCAD : Bull tunnel entry post 9 week breakout up! 30.5Simple technicals combined with a broad perspective.
1) Resistance trend-line ongoing since April 5th was broken 24th may, indicating bull trend initiating.
2) Since breakout, connecting lows and highs are parallels indicating a consistent up-trend in the shape of a tunnel.
The range of the tunnel is 0.980 to 0.916 , current rate is 0.911.
A break below 0.980 with a daily close would confirm downside potential to 0.9000.
So buying now and placing a stop lower than 0.980 is the first option with a TP at 0.916.
Second option is to to wait for a 4h candle close break above 0.916 and TP at 0.9222 with a SL back below at 0.9135.
---------------------------------------------------------------------------------------------------------------------
I hope you this was helpful! If you found that it was, please like and follow! Would truly mean a lot.
Thank you so much for reading - I encourage you to ask questions, make comments.. I promise to reply to each one.
I am not a financial advisor and it's best to make your own research and trade cautiously.
----------------------------------------------------------------------------------------------------------------------

germany30ger30, daily thought. where we are right now we in a channel but any break to the levels indicated it will results in one of the predictions made.

EURUSD MARKET ANALYSISHi guys this is my view on eurusd, i think since the market is already bullish price therefore is likely to continue in the direction of the trend and thus my daily support level. I would like to know your views.

EURUSD: Topped on its Channel Up after the Powell rallyEURUSD rallied heavily following the projected 0.25% rate rise but more importantly a dovish tone from Fed Chair Powell. Typically the first euphoric reactions are already priced in, technically the price reached the top of the Channel Up that goes as back as November.
Turning overbought technically on the 1D time frame (RSI = 70.995, MACD = 0.008, ADX = 49.037), as well as having the 4H RSI rejected in a similar pattern as Jan 12th and Nov 15th, we take that as a sell opportunity and aim at the 4H MA50 (TP = 1.0915). If crossed we will extend selling to the HL trendline (TP = 1.08350) where we will place a half-sized lot buy aimed at the March 31st High (TP = 1.11700). The 2nd half of our buy sequence will be at the bottom of S1 (1.07200) which happens to be the bottom of the Channel Up as well.
Breaking of S1 would mean two potential tests of S2 and S3 before the market settles and neutralizes the December-January rally.
## If you like our free content follow our profile to get more daily ideas. ##
## Comments and likes are greatly appreciated. ##

EURGBP preparing for the next big move up to 0.9312Box Formation has formed on EURGBP.
We have the 7 looking to cross above the 21 and already price is above 200MA.
The RSI is above 50 and is making a bullish divergence.
These are all signs that we can expect the price to move up and breakout.
First target 0.9312

EURUSD Re-testing the 4hour MA50Yesterday EURUSD closed below the 4hour MA50 for the first time in almost 4 weeks and confirmed a short term bearish signal. Today it is making a classic counter trend rebound to re-test that level as its new Resistance and confirm the bearish pattern's strength.
As long as it is under it, we are sellers with 1.07800 the short term target. On the medium-term we have the 1.07180 - 1.06950 Support Zone located under the 4hour MA200, which was last hit on January 6th and should be the true trend strength test for buyers.
Follow us, like the idea and leave a comment below!!

AUD/JPY giving mixed signals with bullish bias to 96.02There are two formations that is showing bullishness (price wise)
First there is a small recent W Formation, which the price has broken out of the neckline and is currently coming down to test it.
Second, the price broke up and out of a medium term downtrend. It looks like there might be a conservative entry if we get a bounce up on it.
Technically.
7>21 MA but still <200 MA (Mixed)
RSI >50 but about to test the crucial median level.
My target is 96.02 but I am feeling wary with the mixed signals.

ETHUSD can buyers follow up on Yesterday's rally?Hi, and welcome to today’s update. Today we are focusing on ETHUSD after yesterday’s solid rally.
Today’s format is slightly different as we use a double CCI method to analyse the current price action. These methods are nothing new and are primarily used to validate trend continuation ideas.
Indicators, whether you love them or hate them, are just tools. We still need to look at price stricture and levels to gauge the whole picture. Take today’s report. The MA and CCis point to a potential long position, but we still need to see buyers break yesterday’s high to show buyer momentum is back on track. Just after that point, buyers face key resistance at 1665.
Yesterday’s bar broke out of the minor retracement, but we still need to see fresh buying to confirm a new push higher is happening. We have run over these aspects in more detail in today’s video.
Don’t agree or want to add something? Please feel free to drop us a comment.

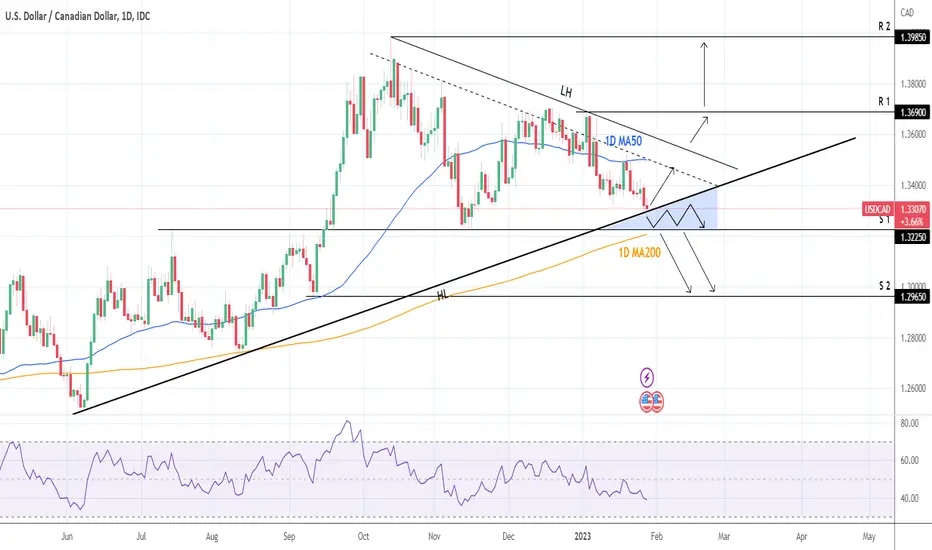
USDCAD: Testing the most important SupportThe USDCAD pair reached the Higher Lows trend line for the first time since August 11th, which has been supporting the bullish trend for the past 6 months. The 1D technical outlook decpits the medium-term bearish correction (RSI = 39.227, MACD = -0.004, ADX = 28.712) but it can't continue unless the HL break.
Since it has been the strongest Support of the past 6 months, there are higher probabilities to see a rebound, at least back to the 1D MA50, if not the Lower Highs trend line. Then R1 (1.36900) comes into play.
A break under the HL is not enough on its own for a short as the S1 (1.32250) level and the 1D MA200 are ready to support. We require a break under both to justify a longer term short, which will be aimed at S2 (1.29650).
## If you like our free content follow our profile to get more daily ideas. ##
## Comments and likes are greatly appreciated. ##
USDJPY: Reached the top of the Channel. Rejection possible.The USDJPY pair has reached the top of the Channel Down after a a rebound two weeks ago near both its bottom and Support 1. The 1D technicals remain bearish (RSI = 43.265, MACD = -1.260, ADX = 20.176) prompting to a continuation of this downward trend.
The short-term target is Support 1, with a break below it capable of inflicting an extension as low as the bottom of the Channel Down. In the same way, a break above the Channel Down is technically capable of testing the 134.475 - 134.750 Resistance Zone where a Double Top wa previously formed, or at least the 1D MA50, which has been unbroken since November 10th.
The RSI's Rectangle can be a guide for buying/ selling inside the Channel Down.
## If you like our free content follow our profile to get more daily ideas. ##
## Comments and likes are greatly appreciated. ##

EURCAD ThesisMarket reversed from daily high (Double top formation) and broke trendline to indicate potential downward movement. Price also broke structure level but we are currently waiting for a retest before going short.

gbpjpy sellprice has recently moved out of the ascending channel that price had previously created, created a correction after breakout and another continuaiton correction for more pushes to the downside.

EURUSD Channel Up intact. Those are our triggers to trade.The EURUSD pair remains bullish long term as the 1D technicals are all green (RSI = 67.498, MACD = 0.008, ADX = 42.429) and the Channel Up since the middle of November intact. Right now the price is supported by the 4H MA50, which is our Bearish trigger. Under it we sell with TP = 1.07200 (bottom of S1). The Bullish trigger is over the top of the Channel Up, above which we buy with TP = 1.11800 (under March 31st High).
## If you like our free content follow our profile to get more daily ideas. ##
## Comments and likes are greatly appreciated. ##

AUDUSD ThesisPrice is testing structure after it broke to the downside, we are currently waiting for another breakout to the downside before going short. What's your thought on this pair?

AUDJPY Analysis Post BOJ Yen moveAUDJPY jumps after BOJ leaves yield curve range untouched.
Hi, and thanks for looking at today’s update. Today we are analysing the daily AUDJPY after the BOJ left the yield curve as is after last month's shock adjustment. The market may have been looking for further moves today, which might be why we saw heavy selling on the Japanese Yen.
Today’s video analysis runs over the last move price action after the shock sell-off and today’s rally. Are a series of higher lows starting to tell us that the market is trying to start a new trend? Today buyers have beaten the range, but we would like to see 91.70 and 93 beaten to show buyers have a new trend underway.
Enjoy your Wednesday, and good trading.

GBPCAD; Bull Market; Parallel ChannelUpdate on the January 3rd, 2023 GBPCAD Trade Idea. Where am I exiting this previous long trade idea? When price reaches the larger parallel channel resistance level, then I will exit the trade. Next, I will wait for a short trade opportunity. I will have to wait and see what opportunities that the market will present.

AUDJPY THESISMarket broke structure and now retested it, we are currently waiting for a break out and candle to close below our line to go short.

GBPUSD 1.4500 long-term targetTwo patterns have been spotted on GBPUSD: an Inverted Head and Shoulders that formed the market bottom on September 26th and a Channel Up that is guiding the price higher. The 1D technicals are marginally above neutral levels (RSI = 55.748, MACD = 0.004, ADX = 34.526), indicating that there is still considerable upside potential.
The price is testing the 1W MA50 for the second time since Dec 15th. The Lower Highs Resistance (LH) is technically the level to beat for the Channel Up and if that happens we will buy into it and aim for the 1W MA200. The Channel Up won't last of course for long but based on the Inverted Head and Shoulders structure the 2X target for the long-term is 1.4500.
## If you like our free content follow our profile to get more daily ideas. ##
## Comments and likes are greatly appreciated. ##
## Also DONATIONS through TradingView coins help our cause of increasing the daily ideas put here for free and reach out more traders like you. ##

EURUSD: 4H MA200 bounce, currently 4H MA50 as ResistanceYesterday's buy is so far working out perfectly as EURUSD bounced exactly after touching the 4H MA200 (1.05278) and just hit the 4H MA50 (1.06355), which is the short-term Resistance. I am now booking my profit as it is substantial for one day and with the 4H technicals turning from oversold to neutral (RSI: 47.296, MACD: -0.002, ADX: 37.053), I will either buy upon a pull-back at 1.05380 or after a 4H candle closes above the 4H MA50.
Again, if the price closes below the 4H MA200, I will take that small loss and open a sell targeting the 1D MA50 (1.03843 and rising) which as I've mentioned many times is the long-term Support and buy entry for me. My attention fundamentally is on the FOMC Meeting Minutes today and more importantly the Non-farm Payrolls on Friday.

EURUSD Market Moves Pre NYHey guys,
Here's a quick Pre New Year Analysis of a Currency market so all know what we are looking for and what explains current PA...
The Market has been slightly subdued and EARLY PA levels hit reacting to the north side.
In this video we look for Risk Averse short zones upwards / Long Zones to the south side.
Watch on for more
