Trade With The Trend You'll Be ConfidentHey Purpose Trader,
Trading with the trend has been the recommended go to for decades of trading. Could it be because there is truth to the actionable statement? I think there is.
Let's take NZDUSD here. You nor I know what can happen next, but you and may be able to agree on 1 thing. This currency pair is trending down.
What does "trending down" mean?
Trending means following and down of course means decrease. When we relate the term to the forex market it means that price is dropping.
The last highest price from where the last decrease came from was around 0.58136. Price then decreased to 0.55123 passing the last lowest price of 0.55658.
And there you have it! The trend!
You know whats cool about this, it didn't take structure to see that. It just took 3 price note tools on the daily timeframe and viola! You have price direction!
This makes me interested in the next move this pair can make.
If today, price closes bearish, it could give me hope that we may see a new Lower low in the future. This will give a favorable risk to reward so I'm going to roll with it.
And just like that we have easy peasy trend trading analysis.
I'd love to know if you agree, have a question, can add value, or if you see something different. Let's chat in the comment section below.
If you liked the analysis share the post. 😍
Happy trading.
Currencytrading

USDCHFThis is how i'm currently viewing this pair on the hour timeframe, what's your view on this pair for this week?

USDCHF 1H shortChannel movement, an ABC structure at resistance, looking for a retracement currently.

dxy us dollar indexTVC:DXY
us dollar looking strong after cpi data released, support respected indicated by the orangey brown line ive drawn, i wouldn't short dxy
possibly a short opportunity for bitcoin

What traded 100 pips actually looks likeHi trading friends.
Do you know what trading 100 pips actually looks like? If not, I'm going to show you in this video. If you have any questions please let me know.
Happy trading!

High Risk To Reward Trade on EURJPYHey friends! This has been my highest Risk to Reward trade of the year on a higher timeframe. I'm happy to share the result with you all today.
The trade was a sell in which I set a sell limit. It was also a countertrend trade which I don't trade a-lot, but this one was too good not to enter.

EURCAD Target Price 1.35148EURCAD Currency Market. Engulfing Candlestick formed on the Daily Time Frame.

Double Top Or Higher High? What Do You See?Double tops and higher highs can be synonymous to some traders. I believe that is ok, but they both speak to different Technical Analysis. A trader who trades may not recognize the higher high as following the trend, but rejection. Where as a trader who trades higher highs may see the high as buyers pushing the market higher and will wait for a pullback.
I created this video to speak to the technical side of both based on a students price chart. He is doing an amazing job simplifying is trading strategy and I loved his POV.
Let me shout out my community Trade On Purpose(recently known as Swing Trader Society). You guys are awesome and I'm grateful y'all allow me to help.
Let me know in the comment section below. What do you see, a double top or a double bottom.

AUDUSD continues to hold at a last line of defence.Hi, thanks for tuning in for today's update. Today we're looking at the AUDUSD as, despite Tuesday's crunching price, contuse to hold at a well-established demand and support area.
There are a few things happening with the AUDUSD atm. First, we can see firm support at the 6720 area. We can also see OBV presenting rough divergence, but it's not what you would call a classic example. Tuesday's sell-off could be an overreaction and possibly an exhaustion bar. For us, the case is rather simple. While the support area holds, we will look for buyers to continue to hold out and possibly set up a new move higher if they can gain momentum. A lot will come down to the USD for this to happen.
If price breaks support, we will look for further downside. A leading factor to watch out for today is US retail sales, and a hot figure could boost the USD as the market remains sensitive to inflation.
US retail sales data will be released today at 8:30 am EST.
As always, we like to hear back from the community. Please feel free to share your comments about the AUDUSD or the USD.
Have a great Thursday and good trading.


Goal: 3342.2 Units (EURZAR)EURZAR Target Price 17.731. Pin Bar tail protrudes through a previous pivot point at price 17.327.

$DXY weakens on this climb US DollarUS Dollar weakening on this climb of worry
RSI & MACD show signs of steam reduction
$TNX is also beginning to show it on a daily chart but that is most likely short lived, if we get another big pullback
UNLESS, they are "forced" to stop raising rates
Interesting indeed as Fed balance sheet is going lower BUT a lot of debt buying

EUR/USD Daily Chart Analysis For September 9, 2022Eurodollar has completed Interim Rebound and continues to hove near the 1.000 threshold by closing slightly below critical Mean Res 1.005. The Key Sup 0.9880 and our open Inner Currency Dip 0.9852 continue to be the main target, with further expansion to the Next Inner Currency Dip 0.9570 and the lower mark is in the making.

EURUSD and GBPJPY set to continue their moves lower? Welcome to Monday’s update. In today’s video analysis, we’re looking at the EURUSD and GBPJPY on the short side.
Friday’s employment data came out mixed, and while we did see a short push higher sellers took control in the NY session, setting up a fade into the end of the week. USD momentum has continued so far on Monday, with the risk majors trading lower after early attempts to push higher.
The EURUSD could be confirming a new continuation lower after last week's LH. A break and close below last week's low could tell us that the current downtrend is set to continue.
The GBPJPY has returned to the base of its descending triangle pattern, and if sellers can break out and hold a close lower, this could be a new downside breakout. We really want to see a firm lower close as we have seen a few examples of false breaks going back to June this year.
What are your thoughts? Please feel free to give us your feedback or ideas if you think differently or if you see something we have missed. We thank you all for stopping by and wish you a good week.
Good trading

Could today’s NFP confirm the USD breakout? Hello all, welcome to today’s update. Today’s video focuses on the USD index after buyers made another strong move in yesterday’s NY session.
In today’s video, we run over the price current price action and trend structure after buyers made a breakout yesterday, clearing 109 resistance that held buyers back during this week.
The USD continues its fantastic run in 2022 as Fed policy maintains buyer demand. Price jumped to new 2022 highs yesterday and continues to track nicely on its current fast trend.
Attention moves to today’s US employment data, as this could maintain the run or lead to a pullback as traders will be waiting to see if we see another hot payroll figure. The last several releases have beaten expectations and come in hotter, so if we do see this pattern continue, will this be the confirmation for yesterday’s resistance break? We think a lower figure will most likely have a negative effect on the USD index and could cause a failed break.
Attention could also be on major risk currencies like the EUR, AUD and GBP as they sold off yesterday, and if we see another push higher on the USD today, this could continue their pain.
Tonight’s US employment data will be released at 10:30 pm AEST / 8:30 am ET.
Thanks for stopping by to check out our latest analysis. Enjoy the rest of your day and your weekend.

Cadjpybased on my prediction jpy currency will getting stronger while usd will getting weaker..hence can short cadjpy for 2-4weeks in order to get big catch 500pips with a very excellent Risk Reward Ratio 1:10..remember trading is about probability + calculated risk..if your accuracy is 60% combine with great RR you can grow your account exponentially..goodluck!!

EUR/USD Daily Chart Analysis For August 26, 2022Technical Analysis and Outlook:
Eurodollar attempted to settle above our Mean Res 1.005. The European currency must close above 1.000 to have a possibility to generate sustainable upside momentum. However, as the currency market continues to trade under the 1.000 threshold, bears will have a fair chance to push it to and under Key Sup 0.9940 and completed Inner Currency Dip 0.9914, and further continue to Outer Currency Dip 0.9765.

EURO USD LONG EUR/USD LONG TO 1,35
As per technical side SANK as per 1M Stoch RSI.
That factor will certainly prevail which will cause stronger EUR and regaining the ratio in a favor of EU currency.
*MACD. multy cross on 1W
*1M KDJ bottomed.
*RSI hit the bottom on 1M timeframe.
Strong EURO will make Europe less competitive and leading towards implosion in certain timeframe (strong currency, bigger export prices, unable to " compete" and participate "under same conditions".
ECB made 2 stimulation packages in an amount of 500 bn + 250 bn euros in order to increase liquity.
US added few trillions too, now continualy increases interest rates.
As every other stornger economy, Europe will become less competitive, (gas price is 3000$) and so on.
Petro dollar benefits from this, but, eventualy, US economy will collide and EU will follow.

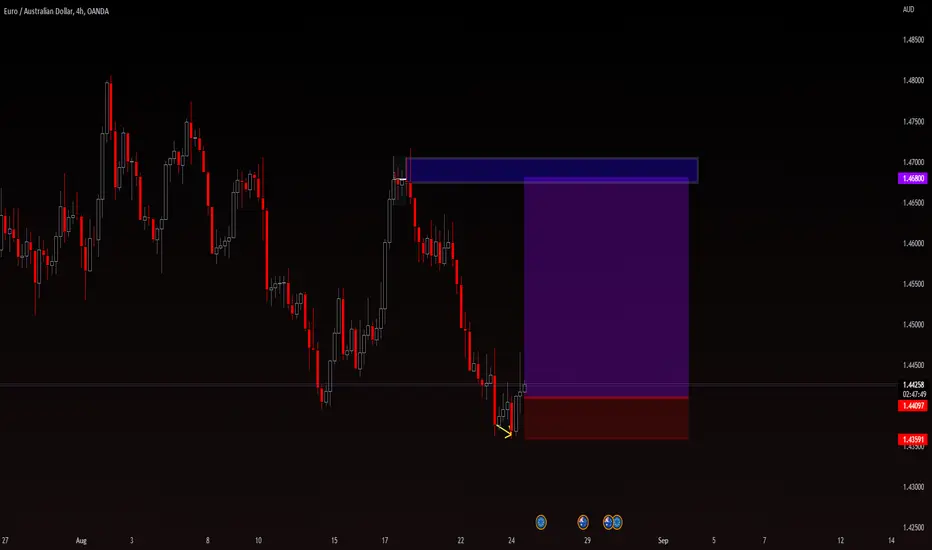
EURAUD 4H LongHere we have beautiufl 4H RSI Divergence into previous Demand, nice and easy gets the job done!
USDCAD setting up for a new push higher? Thanks for stopping by for today's update. Our focus is on the USDCAD as buyers look to be finding new support after last week's range breakout.
The USD has been up, and about recently, we saw the USD index hit 109 yesterday, testing July high. Buyer momentum was short-lived as sellers took control in the NY session, sending price to a lower close, the first in seven sessions.
The USDCAD had shared in the recent bullish momentum, hitting 1.3063 yesterday before the USD lost upward traction and oil made a solid rally. Oil is a big factor for this pair, and typically when it's stronger, the CAD is firmer, so the USDCAD can trade lower.
Last week as the USD made its charge, we saw the USDCAD break above its range at 1.2930. From that point, price continued to rally for four sessions. Yesterday was the first decline since the breakout, and it was a decent one (-0.82%). Price today has seen demand, and we are seeing higher prices that have found support from the previous breakout point, also maintaining the current uptrend.
These are bullish signs, but we need to see yesterday's low hold. If we do, we will continue to look for the current trend to continue higher. But, if we see a new decline that breaks below the green box (shown on the chart), we could be looking at a deeper lower reaction, which could also confirm a trend break.
Pressure is now on buyers to hold today's rally and continue to trade above 1.2935.
Thanks for reading today's update. We hope you enjoy the rest of your Wednesday.

GBPUSD Pullback if price close bullishIf today's candle closes bullish I'll be waiting to see price will pull back towards 1.22948. I'll sell below this price back down to the low.
Trading friends if you like this analysis, or have your own perspective, comment below. Be blessed 😊

Up 500 pips & Student Profited 400 PipsHey hey! Trading isn't always roses but you have to take the wins when you can. Make sure you join me here live at 12:00 pm EST. where I'll cover how you can enter multiple trades on one currency pair.

EURGBP takes first step, but will we see a new continuation?Hi, and welcome to Thursday’s update. In today’s video, we are focusing on the EURGBP. Price formed a solid bar higher in yesterday’s session and could be the start of a new continuation.
Price continues to trade outside the downtrend, and we could be seeing a possible start of a new uptrend after yesterday’s solid close higher. We want to see a break of the current resistance level (.8453) and a break of the existing supply area that runs up to .8470.
If buyers can clear these levels, we will be looking for a new continuation to be confirmed. If the trend does continue, we would be looking at .8533 as the next point of resistance.
The GBPUSD is also a factor, and we will be looking for a break lower on that pair to help boost the case of the EURGBP. A close back below .8435 would suggest that this pattern could be failing, and traders may need to give the market more time.
If you have any thoughts on this pattern or on the EURGBP, we would love to hear your feedback. We hope you are enjoying your Thursday and good trading.
