Let's look at the BITCOIN with Eangle eye.Hello! Friends,
I can with new research an idea but, before to start to talk about technical Let's share your LOVE by giving me LIKES and COMMENTS . Thanks in advance.
Take a look at your Triangles
--------------------------------------------------------------------------------------------------------------------
"" Intraday(30min charts) CHART ""
--------------------------------------------------------------------------------------------------------------------
PART (i):
On the parallel channel (value area) are plotted following analysis-:
At the value high, 4 yellow dotted.
5 touching on the Control Price line
3 Dots having value low
An excess found.
--------------------------------------------------------------------------------------------------------------------
"" DAILY CHART ""
--------------------------------------------------------------------------------------------------------------------
PART (i):
ake a look at your Triangles:-
PART (ii):
Look at the "?" breakout is the question.
2-control lines
parallel channel with value high and low
an excess found(penetration)
Remarkable point:
=> 1) Volume started to rise while last tested at value low(b) which sign of up-breakout. if there's up the breakout, then price not break (b) orange line (gravitation).
=> 2) Point should be noted that many Dots or many times price tried to touch at value low("b" line).
--------------------------------------------------------------------------------------------------------------------
"" WEEKLY CHART ""
--------------------------------------------------------------------------------------------------------------------
Following patterns has been detected-:
initiative movie
two triangles
rounded move with low volume
tails (while u-turn )
Bitcoin is trading in Up-Wave.
!
!
!
!
--------------------------------------------------------------------------------------------
"PAST PERFORMANCE"
--------------------------------------------------------------------------------------------
Successfully followed my steps by bitcoin.
( CLICK ABOVE CHART)
Currencytrading

GBPUSD | Make use of the sell opportunityFriends, please support this idea with LIKE if you find it useful.
I'm seeing a Sell opportunity here. Now price is trading near a wholesale sell area. You may make use of this opportunity. This is the 5th retesting of the supply zone. if the price gets rejected from this level again and manages to break the previous level of support, the price'll fall drastically. Please check my previous post of GBPUSD as well; where I have mentioned more about the possible downtrend.
Disclaimer!
This post does not provide financial advice. It is for educational purposes only! You can use the information from the post to make your own trading plan for the market. But you must do your own research and use it as the priority. Trading is risky, and it is not suitable for everyone. Only you can be responsible for your trading.

EURUSD | Buy Signal | Use the pull back to get inFriends, please support this idea with LIKE if you find it useful.
I'm seeing a buy opportunity here. Use the pullback to get in. You probably would get a sell opportunity as well; around 40 Pips. You may get in if you would like to scalp something out of it. Sell only if you would see some rejection.
Disclaimer!
This post does not provide financial advice. It is for educational purposes only! You can use the information from the post to make your own trading plan for the market. But you must do your own research and use it as the priority. Trading is risky, and it is not suitable for everyone. Only you can be responsible for your trading.

Scallop correlationPossible scallop correlation between EURUSD and USD index
Ascending scallop can be observed on USD and descending scallop on EURUSD
3 down waves can be observed on EURUSD daily chart

Trade Setup by using 30min, daily and weekly timframe. Weekly chart-:
price was rised with volume surged 3x from avarage volume which is clear sign for change in trend or rythm.
Value area on the daily chart-:
The gravitation-line(c) is strong perform as resistance which will be at 110 nearby. Thereofore, 110 is target for you easy and safe.
--> 111.3 is at the value high which is also possible as target.
For the 30min. chart has narrow channel which should not be break , then target is easy given on the chart.

GBPUSD | Sell Opportunity | Low Risk AreaFriends, please support this idea with LIKE if you find it useful.
Like I mentioned on my previous post, last day sellers managed to breach the previous level of support and we've seen some aggressive selling after that breach. If you've missed that opportunity, you could make use of this opportunity to get in. Now we are getting a nice pullback. You could go short from the previous level of support, which probably would act as a resistance area; where the risk would be minimal.
Disclaimer!
This post does not provide financial advice. It is for educational purposes only! You can use the information from the post to make your own trading plan for the market. But you must do your own research and use it as the priority. Trading is risky, and it is not suitable for everyone. Only you can be responsible for your trading.

GBPUSD | Giving Strong Sell SignalsFriends, please support this idea with LIKE if you find it useful.
After a rally in price, we’ve seen some strong rejections whenever the price tested this new level, which I have marked it as a Supply Zone(where majority of sell orders sit) on the chart. And now price is coming back for another retest. It’s been in an accumulation phase from past few days and volume profile shows that a lot volume has been traded. I think they are preparing for the sell. If they manages to break the previous level of support, I believe we would see some aggressive selling.
Thank you for your support, I appreciate it.
Disclaimer!
This post does not provide financial advice. It is for educational purposes only! You can use the information from the post to make your own trading plan for the market. But you must do your own research and use it as the priority. Trading is risky, and it is not suitable for everyone. Only you can be responsible for your trading.

GBPUSD | Buy Opportunity | 15 Min Technical AnalysisFriends, please support this idea with LIKE if you find it useful.
I'm seeing a buy opportunity here. Use the pullback to get in.
Thank you for your support, I appreciate it.
Disclaimer!
This post does not provide financial advice. It is for educational purposes only! You can use the information from the post to make your own trading plan for the market. But you must do your own research and use it as the priority. Trading is risky, and it is not suitable for everyone. Only you can be responsible for your trading.

USDJPY: Target hit. Sell signal ahead.Our last USDJPY trade reached its 109.200 - 109.700 target zone:
The Channel Up on the 1H chart (RSI = 66.020, MACD = 0.480, ADX = 47.769) which we based our call on traded very well and is still valid but is approaching the Higher High zone. We are expecting a rejection within the 110.000 - 110.650 region and will take this sell opportunity to target the 108.500 - 108.000 zone.
We have been following USDJPY closely since the August 2019 bottom:
** If you like our free content follow our profile (www.tradingview.com) to get more daily ideas. **
Comments and likes are greatly appreciated.

AUD/USD SWING TRADE IDEAComo podemos ver el par AUDUSD ha establecido una clara tendencia bajista. La tendencia mayor ahora mismo indica ventas claras. Lo que yo esperaría para entrar en una venta sería esperar el retroceso en el área marcada la cual es es un área importante de soporte/resistencia y niveles de fibonacci. Ojo, es importante esperar la confirmación para entrar en ventas tomando un beneficio en donde indica la flecha.

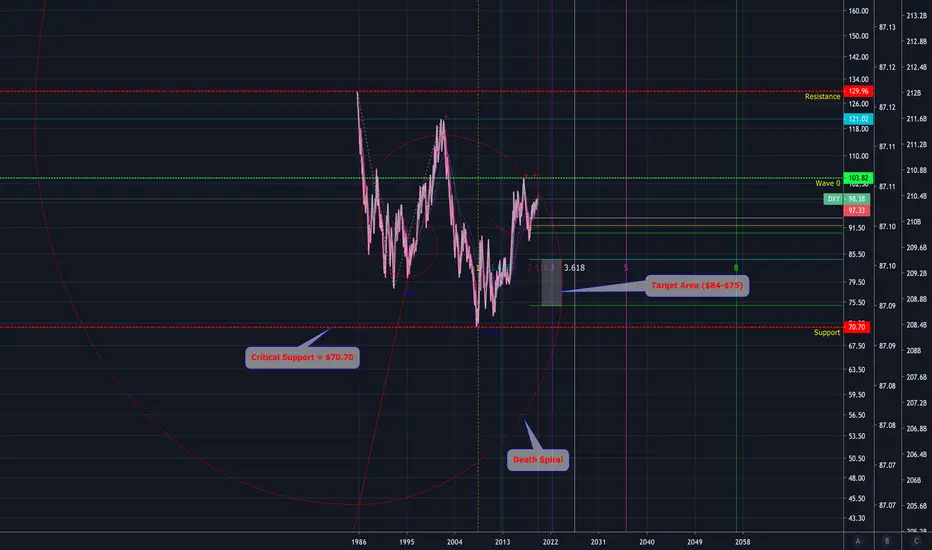
DXY - Short - The Dixie Death Spiral - Fibonacci & WaveTVC:DXY is a SELL.
Analysis Method: Fibonacci & Wave Theory
According to TVC:DXY chart, the dollar is currently in the fiat currency death spiral.
The TVC:DXY needs to break $104 and hold to get out of the Fibonacci 'death spiral'.
Will update.
Please see related ideas for further analysis.
-AB
USDJPY short!Trendline broken. Target is 104 523.83. Lets see how this plays out.
If USDJPY drops, NASDAQ will drop. These two move similar. Compare these two charts and you will notice.
Goodluck!

NY sentiments on EUR/USDOn the D chart EUR/USD has made new HH & HL
Price having broken key support levels @ around 1.11744 and 1.11806 on the 4H, the next significant level will be around the 1.12222 and 1.2400 respectively
A clear break through the trend line, signal a possible bullish trend in the near future

Possible GBP/JPY Scenario, via 4 Hr ChartAs we can see, price has broken out of December's descending trend line. Price eventually found support at 142.940. Right now, it's in a small bullish flag. If price breaks out of that flag, it shall go further til it reaches that level of supply. Will it show rejection from that supply level or break out and retest that level?

GBPAUD: Bullish fractal.GBPAUD is consolidating after the 1.9150 bottom.
Levels to watch:
- The Resistance is at 1.9750 and the Support at 1.9150.
- The MA50 on the 4H chart rejected the first upside attempt and the price is now attempting the second one.
- The MA200 may provide support near the 1.91500 level.
- The RSI is repeating a sequence previously formed after a bottom. This strengthens the bullish case.
- The MACD has turned bullish after the 1.9150 low.
Projection:
- Based on the bottoming sequences on the 4H RSI and MACD, it seems like GBPAUD ahs hit a local low and once a candle fully closes above the 4H MA50, it may repeat a 2.50% rise. If the Support breaks though it should seek contact with the Higher Low trend line.
If you like this idea give us a like, follow and share your thoughts in the comments section below. Remember to stay tuned for future technical analysis , news, updates, and more from PrimeXBT!

EURUSD: Outlook ahead of the Nonfarm Payrolls.This is a break down analysis of EURUSD ahead of the Nonfarm Payrolls.
Fundamental Analysis:
- The U.S. Nonfarm Payrolls for January have a forecast of 160K, higher than the 145K number of the previous month.
- Based on the last 12 Nonfarm Payrolls reports, EURUSD has a 100% probability to go higher on the 4H chart if the Actual number is lower than the Forecast. Similarly on the 12H timeframe if the Actual reading is higher (>) that the Forecast there is a 66.7% chance to go lower, while for the opposite reading (Actual < Forecast) there is a 80% to go higher. The projection on a 2 day timeframe is also 66.7% probability to go lower if the Actual < Forecast.
- Also keep in mind that EURUSD is in the aftermath of the effects by the higher than expected German Trade Balance. This gives a 66.7% probability for EURUSD to rise on the short term (4H and 12H).
Technical Analysis:
- The pattern is still a Channel Down since the December 31, 2019 High.
- The Resistance levels are at 1.11750 and 1.12400 while the Support at 1.09800 and 1.08800.
- Death Cross (MA50 crossing below the MA200) formed on the 4H chart.
- The RSI is bearish on the September Support.
The above mix indicates that EURUSD is bearish both fundamentally and technically on the long term and as the 1.09800 Support 1 broke, targets the 1.08800 Support 2. On the short term though, with the German data supporting an up move and if the U.S. Nonfarm Payrolls report lower than expected numbers, we may see a brief spike, which would make an ideal Lower High on the Channel Down technically and can be seen as the longer term sell opportunity. If however the 1.094 level breaks first, then the Channel Down is invalidated and we will most likely see the 1.08800 Support 2 sooner than expected.
If you like this idea give us a like, follow and share your thoughts in the comments section below. Remember to stay tuned for future technical analysis , news, updates, and more from PrimeXBT!

Inverse H&S Pattern formed, hinting a trend reversalOpportunity to enter before the shoulder is complete, a great catch.

GBP SHORT OPPORTUNITY( GBP / GBPUSD ) Similar Patterns I recognise as well as being oversold on RSI. Just a tad over our short term res./supp. Good time to short

EURUSD : Long SetupThe EURUSD has broken the Trend line upwards and may develop attacks towards resistance levels.
Parameters :
Position Size : %1
Risk/Reward Ratio : 1/2.82
Stop-Loss : Closing Below : 1.10
Goal : 1.13

USDCAD More upside to come.USDCAD is on an uptrend since forming a support at 1.29500.
Levels to watch:
- The rebound on the support has formed a channel up similar to another two occasions.
- The price just hit the MA50 and is consolidating.
- The long term pattern is a bearish megaphone.
- The bearish megaphone's lower highs are made when the price crosses the MA200. This is a top confirmation.
Projection:
- With the MACD still on a bullish trend, we expect the price to continue rising inside the channel up until it crosses the MA200 and makes a lower high on the megaphone.
If you like this idea give us a like, follow and share your thoughts in the comments section below. Remember to stay tuned for future technical analysis , news, updates, and more from PrimeXBT!

EURUSD Buy structure to the 4H MA50.The price rebounded on the 1.10370 Support. Since the pattern is a Channel Down (clear Lower Highs and Lower Lows) today's low is most likely the Lower Low of the structure.
Levels to watch:
- The 4H MA50 has been a Resistance since January 17.
- The RSI hit 29.85 which has been a Support since November 11.
- The 4h MA200 has been a pivot in recent months (Support on uptrend, Resistance on downtrend).
Projection:
- The price rebounds on the current Lower Low and Support until at least 1.10900. The 4H MA50 and MA200 form a Resistance Zone then, Lower High is formed and sellers take action again.
If you like this idea give us a like, follow and share your thoughts in the comments section below. Remember to stay tuned for future technical analysis , news, updates, and more from PrimeXBT!

Still long GOLD, since 2009 [DETAILED]Gold is still a preferred long term asset for wealthy individuals & governments. I've been long since I got into financial markets back in 2008. A wealthy client of mine (whom I did sports recovery on from a Pro Baseball career) suggested I buy gold back then. I had no idea about it, I just bought it & held on. I sold it around 2011 to start another business & have continued to be an investor/trader since.
Currently awaiting to continue buying pullbacks to the (long term) green line. This is a wealth play that I expect to simply hold long term. I BUY PHYSICAL GOLD & track the price value with the chart. You must understand market economics & the historical valuation of GOLD to understand why I approach it this way. GOLD IS NOT A "SAVE THE DAY" ASSET. It is simply a part of a long term asset building strategy to add to a balanced portfolio.

EURAUDConclusión: Después de la explosión, se está acomulando aún así durante esa acomulación podemos ver como está cerca de retestear el P3 de la tendéncia alcista, cosa que podría hacer; aunque teniendo en cuenta que se nos ha creado un HCH invertido que está siendo retesteado, si nos confirma ese retesteo puede que ya suba directo, de todas maneras, esperaremos un poco más para ver si tanto fibo como la tendencia deciden retestear el 61% para así tener una mejor entrada pero en definitiva, va a SUBIR, aunque podría bajar para subir.
The currency can rise now because we have a HCH or we can wait for a better entry in 61% of fibo
