GBPUSD: Analysis and ThoughtsToday's focus: GBPUSD
Pattern – LH low test
Support – 1.2456
Resistance – 1.2510
Thanks for checking out today’s update. Today, we have run over the GBPUSD, breaking down the overall price picture and levels and incorporating moving average and RSI into the analysis.
The GBPUSD continues to push lower after yesterday’s session. Price created a new LH and has moved back down to a minor level of support and started to test that area today. Sellers could be looking at a new leg lower if they can clear that area with a firm close lower. The RSI has moved lower and remains below the 50 point. The moving average also backs up seller momentum with its current slope.
If buyers can reject a push lower with a failed low, that’s a worry for seller strength. To show sellers are in control, we would like to see a new firm low and further selling, possibly testing 1.2365.
Have a great day and good trading.
Currencytrading

EURJPY: Thoughts and AnalysisToday's focus: EURJPY
Pattern – Range support test post LH trend break.
Support – 157.05 – 155.85
Resistance – 158.40 – 159.40 (area)
Thanks for checking out today’s update. Today, we have run over the EURJPY, breaking down the overall price picture and levels we are watching.
The JPY has started the week on a strong note with solid gains so far to the EUR, GBP and USD. The GBPJPY is also showing similar signs to the EURJPY, but we zoned in as there have been a few price signals in a row that could be backing up a new move by sellers.
Sellers continue to test the range bottom after breaking the fast trend and setting up a new lower high around 158.40 resistance. From here, if sellers are going to try a new run, we would like to see a decent to strong close lower that beats the range and 157.05 support base. Then, we will look for a new move lower that could test 155.85 or below.
If price can fight back and close back above 157.05, this could be a sign that seller strength might not be that strong.
Have a great day and good trading.

DXY Futures DX1! ~ Weekly Swing ChartChart mapping/technical analysis of ICEUS:DX1! for developing long-term Swing Trade strategies.
ICEUS:DX1! TVC:DXY AMEX:UUP AMEX:UDN

DXY Futures DX1! ~ Weekly Swing Chart V2Update: same chart, same timeframe, wider view.
Chart mapping/technical analysis of ICEUS:DX1! for developing long-term Swing Trade strategies.
ICEUS:DX1! TVC:DXY AMEX:UUP AMEX:UDN

DXY Futures DX1! ~ 4hr Intraday ChartChart mapping/technical analysis of ICEUS:DX1! for developing short-med term Intraday Trade strategies.
ICEUS:DX1! TVC:DXY AMEX:UUP AMEX:UDN

USDCAD: Best sell signal since March.USDCAD is trading inside a Channel Down pattern that has almost completed 11 months of trend. The technicals on the 1D time-frame are overbought (RSI = 70.266, MACD = 0.007, ADX = 57.395) and that enhances the sell sentiment as the price approaches the top of the Channel Down.
The previous LH was priced a little over the 0.786 Fibonacci level. The formation of a Bearish MA50/100 Cross was after the top was in and technically we are only a week away from the new formation.
Consequently, we treat this as a sell opportunity, waiting to sell on the 0.786 Fibonacci, targeting the 0.118 (TP = 1.32000) as the April 14th low.
## If you like our free content follow our profile to get more daily ideas. ##
## Comments and likes are greatly appreciated. ##

GBPJPY: Rejected at the top of the 2 year Megaphone. Sell signalGBPJPY hit the HH trendline of the two year Megaphone pattern and that has so far put a pause to the uptrend. The 1D timeframe has turned neutral (RSI = 52.182, MACD = 0.480, ADX = 25.579) and is supported by the 1D MA50. The MACD formation reveals that the pair could be ahead of a 0.382 - 0.236 Fibonacci correction as in June/July 2021.
As a result there are higher probabilities for a short term sell. We are targeting the 1D MA200 not lower than the 0.382 Fib (TP = 177.000).
## If you like our free content follow our profile to get more daily ideas. ##
## Comments and likes are greatly appreciated. ##

Text Book Cup and handle for CAD JPY- Nice buy soon!Notice I said the word SOON.
There has been a text book cup and handle formed on the CAD/JPY/
It's just about to complete the handle forming its brim (resistance).
Now only once the price breaks out, closes above and opens above the brim - will it signal a decent long.
Until then, I'm waiting.
We have other bullish signs along the way.
7>21>200
RSI >50
Target 123.20

EUR/USD Daily Chart Analysis For Week of September 1, 2023Technical Analysis and Outlook:
The Eurodollar rebounded off to our Mean Res 1.090 and some more; however, as a solid ongoing pivotal move, sentiment mode is dictating the designated target of the Outer Currency Dip 1.070 is inevitable.

EUR/USD - JUST A CORRECTION?
The price unfolds as previously forecasted.
Currently we finished 5 subwaves in the upside that formed the corrective Wave A, as part of the Wave 4 from the bigger 5 Waves on the downside now.
We will expect the corrective Wave 4 to continue to unfold, before we can say for sure that the Wave 5 impulse started on the downside!
See the chart for a more clear idea of what I'm talking about. Thank you!
From a fundamental perspective, there are a number of factors that are weighing on the euro. The European Central Bank (ECB) is expected to keep interest rates low for the foreseeable future, which makes the euro less attractive to investors. Additionally, the eurozone economy is facing headwinds from the ongoing war in Ukraine and rising inflation.
From a technical perspective, the EUR/USD pair is trading below the 200-day moving average, which is a bearish signal. The pair is also trading below the support level of 1.0832. If the pair breaks below this level, it could decline to the next support level of 1.0609.
However, there are some technical indicators that suggest that the EUR/USD pair could be bottoming out. The Relative Strength Index (RSI) is approaching oversold levels, and the stochastic oscillator is crossing over from oversold territory. This suggests that the pair could be due for a rebound.
Overall, the EUR/USD exchange rate is facing a number of headwinds from a fundamental perspective. However, there are some technical indicators that suggest that the pair could be bottoming out. Traders should closely monitor the price action in the coming days to see if the pair can break out of the current downtrend.
I hope this post is helpful.
This analysis represents only my personal thoughts and knowledge at the date it is posted.
This analysis does not represent professional and/or financial advice.
You alone assume the sole responsibility of evaluating the merits and risks associated with the use of any information or other content found on this profile before making any decisions based on such information.
Any feedback is encouraged and appreciated. Thank you and have a nice day!

Eightcap: USDCAD Analysis Today's focus: USDCAD
Pattern – Support hold, retracement
Support – 1.3517
Resistance – 1.3597, 1.3640
• USDCAD price sits at a junction.
• USDCAD failed at its latest key resistance test.
Hi, and thanks for checking out our latest market update. Today, we have run over the USDCAD on the daily chart and discussed oil and the USD index, as well as upcoming news that could influence the current picture.
Price could be seen in a small squeeze at the moment. Will we see short-term support hold and potentially feed a new shot at key resistance? Or do we see support break and price make a new move back towards the main trendline?
Data to watch today: US unemployment claims and core PCE price index. Tomorrow, US employment data.
Have a great day and good trading.

EUR/USD Daily Chart Analysis For Week of August 25, 2023Technical Analysis and Outlook:
This week's price action of the Eurodollar turned out to be nothing but down modish as projected, by fulfilling our Outer Currency Dip of 1.087 and drifting to the next Outer Currency Dip of 1.070. However, the dead-cat rebound to Mean Res 1.090 should not be ignored.

Double bottom necklineAt a daily timeframe there is double bottom neckline pattern.
if the neckline breaks, the bull in the market will get stronger.
The daily and weekly support looks strong.
Disclaimer : The CMP is at the monthly strong resistance so trade with tight SL.

AUD/CHF Double Top and Support BreakPrice confirmed 0.58800 zone and formed bearish reaction. We can see double top at 0.58600 level. Price continued to go down and broke and retested 0.58100 zone. I expect to see bearish continuation.

EURAUD FORECASTAs we can see the market making a double bottom pattern; if market breaks the resistance then we can place a trade in upward direction when market comes for a retest

EUR/USD Daily Chart Analysis For Week of July 28, 2023Technical Analysis and Outlook:
During this week's session, the Eurodollar decreased and reached our Mean Support level at 1.100 and lower, which suggests that it may continue to decline toward the Outer Currency Dip of 1.087. It could also rise and retest the Mean Resistance level at 1.109 to eliminate weak long positions. It's essential to consider this upward movement known as a "dead cat bounce."

AUDUSD will buyer momentum continue?Today's focus: AUDUSD
Pattern – HL
Possible targets – 68.11 – 68.85
Support – 67.17
Resistance – 67.75
Could we see further upside from the AUDUSD? Currently price is bouncing off short-term support. This could continue if some of this week's key news goes in favour of risk markets. The USD has had a solid run recently but could any hints at future rant holds set off a new pullback? If so this could be fuel for the AUD to continue its push.
Australian CPI is also due out on Thursday, its forecast to come in slightly lower Could a miss also help drive buying?
For now, we will continue to watch price as it holds off short-term support with a new HL and see if it can continue to push higher reclaiming some of last week's lost ground.
Have a great day and good trading.

USD/JPY HHs and HLsWe can see strong downtrend here, but price then started to form higher highs and higher lows. Bulls gained control, but I expect to see bearish pullback and new higher low formation. Keep your eyes on 140.300 zone.

Short On GBCADPrice have reached an Higher timeframe Supply (Order block) and it has shifted the Lower timeframe Structure to bearish, So I'm a patiently waiting for a retest on the H4 OB as my entry. Sell limit Orders -1.72670

Retracement on GBPCHFAm expecting a bullish retracement on GBPCHF Before Going Short again, although price might be bullish I wont be taking any Longs Because we are on a bearish Trend.

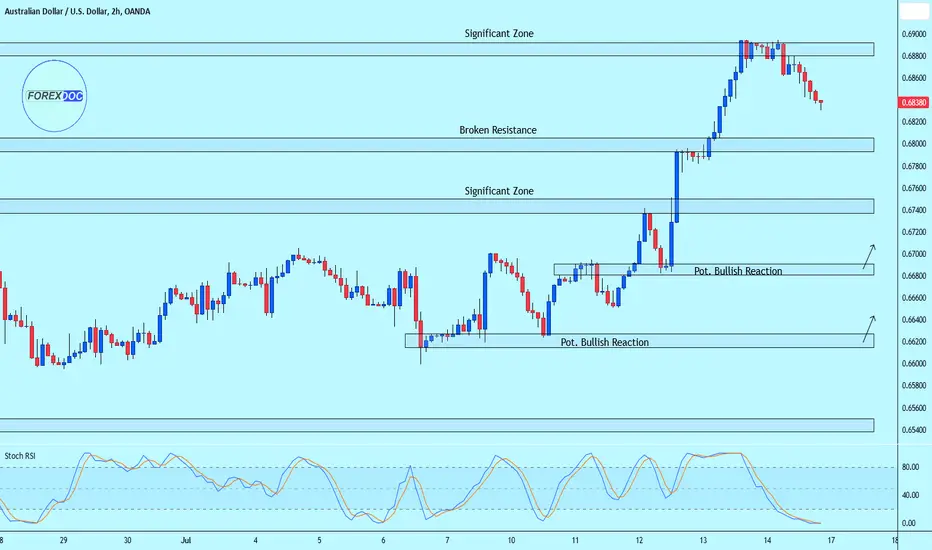
AUD/USD 🇦🇺/🇺🇸 Bearish ReactionPrice reacted to our significant zone and we can see bearish reaction. If price continues to go down, it is possible to see retest of 0.68000 zone.
GBP/USD 🇬🇧/🇺🇸 Strong UptrendHere we can see massive bullish trend. There is a minor resistance zone at 1.31400 level.
Possible bearish reaction to 1.32500
Possible bullish reaction to 1.30000
If this bullish trend continued I will look for the opportunities to buy.

AUD/USD Reaction to Resistance ZoneVery strong bullish move occurred and price reached our significant zone 0.698850. We can see bearish reaction now, and it is likely to continue.
