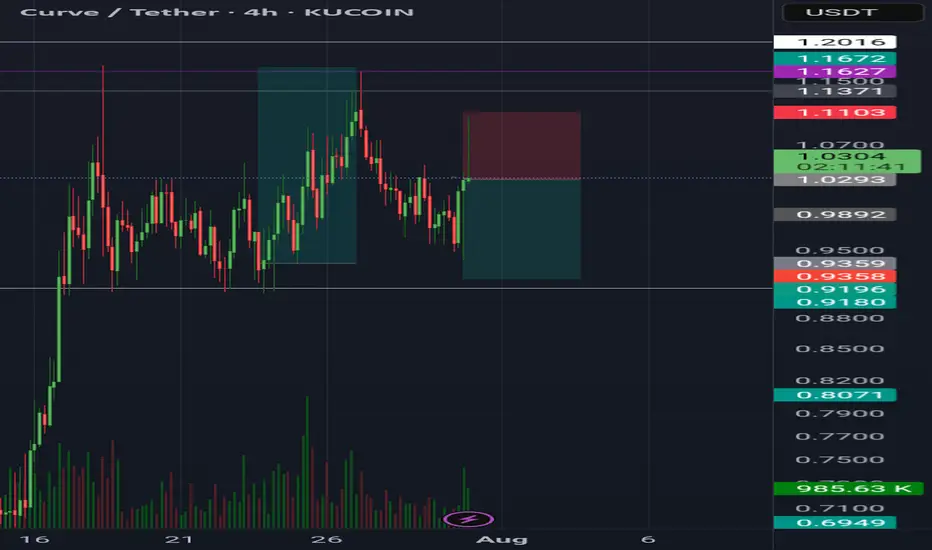
CurveCrv usdt daily analysis
Time frame 4 hours
Risk rewards ratio >1.3
Target 0.92$
Short position because of earthquake in the Russia
Curvepattern
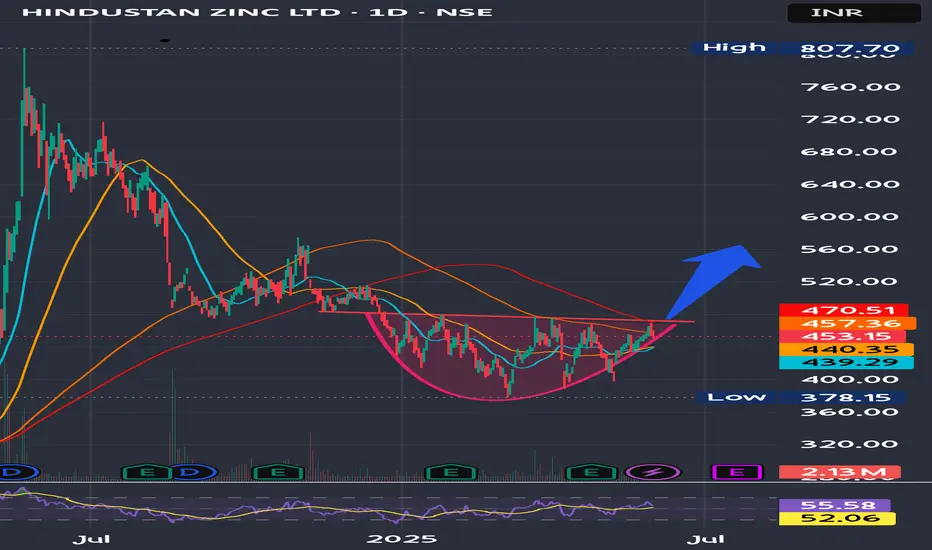
Hindustan Zinc Ltd at near breakout Hindustan Zinc Ltd. (Hindzinc) is one of the world's largest integrated producers of zinc, lead, and silver.
It is near a crucial resistance level and making higher lows indicating a breakout upwards soon.
Trading Levels-
Tgt Price-564
SL-448.5
JPY/USD Breakout from Curve Line – Targeting Upper Resistance JPY/USD presents a classic curve bottom formation, which is a powerful technical structure indicating accumulation by smart money. It’s supported by key price action behaviors like support/resistance flips, retesting confirmation, and a well-defined target zone.
Let’s break it down piece by piece.
📉 1. Curve Formation – Accumulation Phase
The most noticeable element here is the parabolic (curve) structure formed between October 2024 and March 2025. This kind of structure often reflects a slow accumulation process:
Price dips over several months form a rounded bottom — also called a saucer pattern.
This shows institutional players are quietly accumulating, while retail traders are often trapped in sell-side positions.
As the curve matures, the volume and momentum begin to shift, signaling the beginning of a bullish breakout.
This accumulation curve is bullish by nature and becomes even more potent when followed by a breakout and retest.
🔄 2. SR Flip Zone (Support-Resistance Interchange)
One of the most critical concepts in price action is the SR flip — where old resistance turns into new support. In this case:
The yellow-shaded zone previously acted as resistance — confirmed by multiple rejections.
After the breakout, this same zone is being retested as support — a healthy technical confirmation that the market has accepted higher prices.
This flip zone is a launchpad for continuation to the upside.
📍 3. Retest Confirmation – Smart Entry Opportunity
Zooming into recent price action:
The market pulled back cleanly into the SR zone and the curve line.
The confluence of horizontal support and the curved trendline makes this an extremely strong retest zone.
Buyers stepped in with force, suggesting that demand is active at this level.
This retest is where risk-to-reward is optimized. The ideal entries usually happen when price confirms structure after a breakout — not before.
🎯 4. Target Zone – Next Bullish Objective
The next logical target is shown in the blue box above (~0.00705–0.00710). Here's why this zone is important:
It marks a previous supply/resistance area.
It aligns with psychological round numbers and past consolidation.
A measured move from the bottom of the curve also aligns with this target.
In essence, it is the profit-taking zone where the market is likely to pause or reverse temporarily.
🔎 5. Insider Supply & Central Zone – Institutional Traces
The chart labels an “Insider Supply” area at the base of the curve. This implies:
Hidden accumulation likely occurred at this level.
Institutions tend to trap retail sellers during these periods with false breakdowns.
Once they’ve loaded up, price shifts upward in a controlled fashion — exactly what has happened here.
The Central Zone is the battlefield — the area where prior indecision took place, which has now turned into a stepping stone for upward movement.
💡 Strategy Recap:
Parameter Value
Entry Retest of SR Flip (0.00680–0.00685)
Stop Loss Below curve base (~0.00670 or lower)
Target 0.00705–0.00710
R/R Ratio 1:2 or better
This strategy is technically sound, supported by structure, and has strong reward potential.
🧠 Market Psychology:
Smart money accumulates when price is quiet and sentiment is bearish.
After accumulation, a controlled markup begins, with retests engineered to confirm the breakout.
Retail traders tend to enter late or get faked out — while institutions already hold positions.
This chart is a textbook example of how professional traders operate and manage structure-based risk.
🏁 Final Thoughts:
This is a high-probability technical setup built on multiple layers of confluence:
Curve structure
SR flip
Demand zone retest
Momentum shift
If momentum continues, the 0.00710 zone is a very realistic short-term target. Traders should manage risk tightly and monitor price behavior near the upper resistance box.

NIVABUPANIVABUPA showing resistance breakout with decent volume and can go up to the recent arc curve depth ie approx 18%. It is very strong on weekly chart as well. Closing below 85 may change the view. keep it in your watchlist

Curve meaningDo curved lines mean anything? This one lines up exactly with my weakest Bitcoin target. #Cryptomarket #Bitcoin #Trading #Chartpatterns

SOUND HOUND AI Uptrend possible runSound Hound under the Umbrella of AI plays. Slowly curving up out of Inverse head and shoulders.

ENVX - ARMY Contract Maybe Undervalued* Meant to put this on the ENOVIX thread*
A Couple things to note is Enovix has been on a steady rise and has had bullish catalyst released. It's on the hook to hit the next leg. Lame pun for the Hook showing on the chart pattern
" Enovix said the agreement moves the program toward full volume production. The cells will be used to build pre-production CWB packs.
The advanced silicon battery company said the deal is for it to produce commercial cells for use within U.S. Army soldier's central power source, called the Conformal Wearable Battery.
" - MarketBeat
This launched the stock price to $19 ON JULY 6TH.
SPY being on an extreme bull run and new 52 week high ENVX following a similar pattern.
ENVX, RSI on close to oversold, Williams showing the stock is curling. ENVX is currently aligned with SPY and have the same exact pattern It may run up with SPY so long as it remains bullish.
I Expect it to touch at least $25 but theres a lot of turbulence up there as thats where it's been consolidating in the past. General consensus PT is $38.
ENVX has an average rating of buy and price targets ranging from $15 to $100, according to analysts polled by Capital IQ.
Trade Responsible,
#TradeTheWave

WTI BULLISH SCENARIOSanctions, demand, supply, production, and china resuming live to normal before COVID temps, all those factors and the pretty clear curve that can be found on the D chart from Mid May 22' until today suggest that we can see some upward movement. Of course, many other factors that are not present today can either catalyze that movement or do a 180 turn, OPEC has done some moves that eliminate all other factors. The curve range is 15$-20$ which can be utilized on multi-day trades.
Risk Disclosure: Trading Foreign Exchange (Forex) and Contracts of Difference (CFD's) carries a high level of risk. By registering and signing up, any client affirms their understanding of their own personal accountability for all transactions performed within their account and recognizes the risks associated with trading on such markets and on such sites. Furthermore, one understands that the company carries zero influence over transactions, markets, and trading signals, therefore, cannot be held liable nor guarantee any profits or losses.

BTCUSDTBitcoin situation from the point of view of Andrews fork and curved trendline
The price is breaking the trendline and in the upper channel of the swing fork, which usually tends to reach the middle line of the fork.

BTC BEAR MARKET ENDED (BTC leg)we also can see we are out of Bearish Curve trend!
We can see what steps financial institutions have taken on the Bitcoin chart ;) Goodluck!

GameStop Logarithmic ExponentialsParabolic analysis of GameStop, a fascinating chart in term of trend behaviors and algorithmic short-selling.

Probable (in my opinion) Demand/Support level for CURVE????I have seen CRV test this area between $1.86 and $2.20 5 times fairly recently as you can see from my drawings on this daily chart. Looking for feedback from the trading community on what you guys think of my analysis, and whether I am on the right track with a lot of the analysis that I publish, most I don't, and I probably should because there are no losses unless you do not learn from them. Especially with something as diverse information wise as trading, investing, etc. Look forward to what everyone thinks of Curve and the De-Fi sector in general....happy trading guys and I hope EVERYONE OUT THERE IS MAKING MONEY. Lets break the system because you know none of them were built for that much success. The only ay to do that is to help each other get better at the finer points of technical and fundamental analysis. Take it easy everyone, this toooooo shall passs......I also think Curve and the De-Fi sector in general will get a bump coming into the end of the year, need money , holiday season, by the way....let me know ladies and gents, and be safe out there...
One more thing, lets see if we see some buyer exhaustion in the current candle with a "top" and reversal, if that happens, I could really be onto something....

OTHERS - SLOW BLEED OR CONSOLIDATION?OTHERS needs to bounce here and otherwise next level on the trend line. Possible that this was a hopium bounce and we turn into a downtrend again.

OTHERS - BREAKOUT TO THE UPSIDEGreat price action. Next month most greenish month in BTC history aswell seems very promising for an even greater breakout longterm to last ATH.

$ORAI - ZK-ROLLUP GEMSome important lvls, trendlines and a fibb.
Dont miss out anon.
Gains to be made :D

$DUSK - START ACCUMULATION NOW!!!ZK-SYNC testnet live, good to buy zkrollup plays right now after they got huge corrections. DUSK has very decent twitter shillings and should be a good play to ride up in a bullish CT space. Expecting some huge moves for sure coming years.

BTCUSD curvilinear support resistance levelsMy curvilinear shows support & resistance levels.
Not an investing advice, DYOR !

Is the future of Bitcoin already written?This is what the logarithmic chart is telling us. Looks like we are approaching the top around 135k dollars this December-January and then a bear season is expected all the way down to the previous ATH around the 20k dollars level. If correct, next cycle would take us to the 1 million dollar level. Time will tell.

DJI Elliot Wave and its HistoryBy using parabolic curves and the logarithmic chart I have found something very consistent and interesting with the DOW starting from its inception.
***Note: IF this has been discovered before then all credit to them, this will just be a decent idea to think about now and to bring up given recent events and trend.***
The Great Depression marked the first parabolic curve break on the chart but after I drew more parabolic curves using these guidelines:
- Each curve must touch the initial bottom back before 1900 and the bottom of the Great Depression (~1932) and must touch the start of Wave 1 and the bottom of Wave 4 for each of the cycles throughout DOW's history.
- There had to be 5 waves that match the rules correctly on the Monthly chart
- There had to be a matching A,B,C style correction after each cycle once the parabolic curve broke
- The 1973-74 recession was more of a W,Y,Z where it ended in a zig-zag type pattern
- Also, the pandemic fall back was very fast but still had a quick A,B,C which I left off the charts since it was too small to view
- Each parabolic curve break had to be after or during an important part of U.S History and sometimes World History as with COVID-19
In the end it seems to be pointing towards a large scale 1 - 5 Elliot Wave on a Super-millennium type cycle. Now this is just pure speculation but proper to ponder as an idea as the rules do fit currently to be so.
If there are debates to this please let me know as I am still a bit intermediate level with Elliot Waves. Same goes for each of the cycles I have shown.
So what does this mean for a possible future?? Once again high speculation here.
- If this is true then this current possible pullback is just a number 2 on the Monthly Elliot scale of this cycle which, if history repeats, would be a 50%-62% retracement back to 22-25k range and should be completed by mid-year next year (2022).
- That means a 3 would reach ~53k with a wave 4 to touch that current parabolic wave at ~36k. Then it would follow a wave 5 pushing towards 55k area.
- After this parabolic break I would speculate that it would be the last and it would end wave 5 of the super-millennium type cycle that DOW has been on since inception
- Once broke it would result in a large scale and long scale bear market that could last many years and see a correction pushing past 80%, 9.6k seems to be a good area with strong support as an eventual target
- Another possibility that points to this being the end of a very large cycle is that each of the parabolic curves are getting more narrow showing the overall rapid price rise as this has aged.
- Also, drawing out the Elliot Waves for this cycle showed 3 and 5 being very close for their tops with 1 and 4 nearly matching in price as well.
- Current Wave 1 has been riding the bottom of the last parabolic wave for some time now.
- Each correction in these Waves have been either been related to a big economic or historic event (sometimes both) so looks like this one could be another housing industry bubble as has been speculated to happen soon.
- IF this stays on course as shown then it would point towards the second half of 2027 as a huge historical event to come especially one that could cause a break of the long-term cycle. This would also be devastating too all markets as well if it happens.
This is just something I did and thought it would be a good idea to share. The DOW has been showing signs of a large correction coming and the speculation of another housing bubble bursting has got some thinking of a 2008 recession. What I have found does show a correction but it is at this time pointing to a much larger correction to come but at a later date this decade.
I would speculate though any monthly close below 20k on the DJI could mean serious trouble indeed as it would break this parabolic curve and each time it has at least meant a multi-year bear market to follow.
Anybody have anything to add or to help correct me on (I'm still not quite to an expert level with Elliot waves) then let me know be glad to comment back!
***Disclaimer: I am not a financial professional/expert and all ideas from me are all speculation based off of my own research. Please do your own research as well as I am not responsible for others when it comes to their financial decisions.***

XTZ/USD: The last confirmation to buy Tezos!!!Tezos it's look so bullish in Daily timeframe. As I'm from $5.27 USD since past week. I believe that Tezos it's prepare to go to pump to $8 dollar soon
Now, I want to share the H4 period where I look that Tezos it's making a curve pattern to make a bullish movement like a styrocket. This it's so interesting how the market structure it's explain that Tezos it's preparing to climbing soon.
So, there's not much update, the only update it's that Tezos made the last confirmation to buy now in Daily timeframe as Tezos will explode soon.
I keep my SL at $4.80 USD, but very protected my long entry. I'm in profit in Tezos and also in Chainlink, my two trades for the moment.

Bitcoin Curve channel that we should keep an eye on itBefore we had the same curve channel for Btc ATH
now its probably going through the same pattern
if it hits the top of the channel it can reach 51.5K we can expect a pullback to 50K
what do you think?


$CRV with More Curves $crv finally looks to be ready. as mentioned last time, I believe $crv will have an explosive breakout. levels in the right are fib levels, and tp levels are marked with green (and yellow if you have weak hands). other fib lines (purple) can be used as stop losses in profit. info lines in the center are experimental, and show the possible heights $crv can reach on this third parabolic step breakout run (calculated using the first two parabolic steps). bar pattern is $fil which also saw tons of accumulation before breakout. scaled to size to show possible market movement and fit too perfectly with my fib levels and curves not to add lol. having fun with this one but confident with this prediction.
good luck all! lmk what you think
