$ETH - Top DownBYBIT:ETHUSDT.P Top Down (10/06/25)
V-Levels Bias
Weekly = Bullish
Daily - Bullish
10-Hour = Bullish
1-Hour = Bullish
V-Levels Momentum
Weekly = Bearish FA
Daily = Neutral
10-Hour = Neutral
1-Hour = IB Range (Neutral)
DeCode Market Breakdown
Macro Context
Weekly Chart
Strong bullish MS, printing clean HHs and HLs.
Price has rejected from the same V-Level multiple times.
Rejections are paired with high relative volume and aggressive selling footprints → indicates strong passive interest above.
This area is not ideal for aggressive long entries.
Daily Chart
Still in bullish structure, holding above key POCs and range lows.
The Failed Auction at IB lows has added fuel for upside momentum.
However, we’re trading right into a potential liquidity pocket just below resistance.
Context calls for a wait-and-see approach: either clear breakout or rejection confirmation.
Intraday Picture (10H & 1H)
10H Chart
Still within an Inside Bar (IB) range.
FA at range lows suggests momentum continues upward — but we are at the top of the range.
Key risk: trap above range highs → ideal area for shorts if we get absorption and selling imbalance.
1H Chart
Market is rotating inside the current IB range.
No breakout confirmed yet.
Best short setup: Rejection from IB Highs + Absorption on CVD / Footprint charts.
Breakdown scenario: Short on range low breakdown with volume confirmation.
Longs: Only valid if HTFs confirm breakout → then look for bullish retest or mid-retest entries.
⸻
Summary & Trade Plan
Big Picture: Still bullish, but this isn’t the area to long blindly.
Short Setup 1: Rejection from IB Highs with clear absorption + imbalance.
Short Setup 2: Breakdown below IB Range Lows with volume follow-through.
Long Setup: Wait for HTF confirmation of breakout. If confirmed → retest of prior resistance as support.
Final Notes
This is where traders get chopped. HTF resistance meets LTF momentum.
Let price prove itself. Let volume confirm the move.
No breakout = no long. No trap = no short.
CVD

Understanding Volume In TradingVolume is one of the most crucial yet often overlooked aspects of trading. It represents the total number of shares, contracts, or lots traded in a given period and provides insight into the strength of price movements. By analyzing volume effectively, traders can identify trends, confirm breakouts, and detect potential reversals before they happen.
Unlike price action alone, volume adds a critical layer of confirmation. A price move supported by high volume is more likely to be sustainable, while a move on low volume may indicate weakness or manipulation. Institutions, hedge funds, and large market players leave footprints through volume, and understanding these patterns can give traders an edge.
Volume Types 🎯
Volume
Buy/Sell Volume
Delta Volume
Cumulative Delta Volume
Relative Volume
Cumulative Relative Volume
Open Interest
Volume Profile
01. Volume 🔥
In trading, volume refers to the total quantity of assets traded during a specific time frame, whether they are stocks, futures contracts, options, or currencies. It measures the activity level of a security and provides insights into the strength or weakness of price movements.
Key aspects:
Market sentiment: High volume often indicates strong interest in a security and can signal the strength of a price move. Conversely, low volume may suggest a lack of interest and can indicate that price movements may not be sustainable.
Liquidity: High volume generally indicates better liquidity, meaning it is easier to enter and exit positions without significantly impacting the asset’s price. Low volume may lead to higher slippage and greater price volatility.
Volume spikes: Extremely high volume after a prolonged trend may signal the end of that trend (blow-off tops or panic selling bottoms).
Market types: Volume can vary by market type. In stock markets, it is usually reported in shares. In futures and options, it is reported in contracts, while in Forex, it is often measured by tick volume (the number of price changes).
Impact on market orders & liquidity
High Volume = Lower Slippage: Large orders can be executed more efficiently in high-volume environments.
Low Volume = Higher Volatility: Thin order books in low-volume markets can lead to erratic price swings and wider bid-ask spreads.
02. Buy/Sell Volume 💹
Buy volume and sell volume are key metrics that indicate the level of buying and selling activity in a market. They help traders assess the strength of price movements and market sentiment.
Buy Volume
Buy volume represents the number of shares, contracts, or lots traded at the ask price (or higher). It occurs when buyers are willing to pay the seller’s asking price, indicating buying pressure and potential bullish sentiment.
How buy volume is measured:
Transactions that execute at the ask price are counted as buy volume.
In some cases, aggressive market orders (where buyers take liquidity) are considered buy volume.
Buy volume is often compared to total volume to determine demand strength.
Sell Volume
Sell volume represents the number of shares, contracts, or lots traded at the bid price (or lower). It occurs when sellers accept the buyer’s bid price, indicating selling pressure and potential bearish sentiment.
How sell volume is measured:
Transactions executed at the bid price are counted as sell volume.
Market sell orders (where sellers take liquidity) contribute to sell volume.
Higher sell volume relative to buy volume suggests downward price pressure.
03. Delta Volume ✨
Delta Volume (often referred to as Volume Delta) is a key order flow metric that measures the difference between buy volume and sell volume over a given period.
Calculation
Delta Volume is defined as: Delta Volume = Buy Volume − Sell Volume
Where:
Buy Volume is the total volume transacted at the ask price (aggressive buying).
Sell Volume is the total volume transacted at the bid price (aggressive selling).
Interpretation
Positive Delta (Buy Volume > Sell Volume): Indicates more aggressive buying, suggesting bullish momentum.
Negative Delta (Sell Volume > Buy Volume): Indicates more aggressive selling, suggesting bearish momentum.
Near Zero Delta: Indicates a balance between buyers and sellers, often seen in range-bound markets.
04. Cumulative Delta Volume ⚡
Cumulative Delta Volume (CVD) is an advanced order flow metric that tracks the cumulative sum of Delta Volume over time.
Calculation
CVD t =CVD t − 1 + (Buy Volume − Sell Volume)
Where:
Buy Volume = Volume transacted at the ask price (aggressive buying).
Sell Volume = Volume transacted at the bid price (aggressive selling).
CVD*t = Current cumulative delta value.
CVD\*{t-1} = Previous cumulative delta value.
Interpretation
Rising CVD (Positive Delta Accumulation): Buyers are dominating, indicating bullish momentum.
Falling CVD (Negative Delta Accumulation): Sellers are in control, signaling bearish momentum.
Flat or Divergent CVD: A divergence between price and CVD can indicate potential reversals or absorption by large traders.
05. Relative Volume 📉
Relative Volume (RVOL) is a key trading metric that measures current trading volume compared to its historical average over a specified period. It helps traders assess whether a security is experiencing unusual trading activity and provides insights into liquidity, volatility, and potential price movements.
Calculation
Relative Volume is typically expressed as a ratio:
RVOL = Current Volume / Average Volume Over A Given Period
Where:
Current Volume = The total shares/contracts traded in the current period (e.g., 1-minute, 5-minute, daily).
Average Volume = The average volume over a past period (e.g., 10-day average, 50-day average).
A higher RVOL (>1) means the security is trading at above-average volume, while a lower RVOL (<1) indicates below-average activity.
Interpretation
RVOL > 2: Indicates significantly higher-than-normal volume, often linked to news events, earnings reports, or breakout trends.
RVOL around 1: Suggests normal trading activity with no unusual volume spikes.
RVOL < 1: Indicates low trading activity, which may lead to weak price movements and lower liquidity.
06. Cumulative Relative Volume 💥
Cumulative Relative Volume (CRVOL) is an advanced volume metric that tracks the total volume traded throughout a session relative to its historical average at the same time of day.
Calculation
Cumulative Relative Volume compares the ongoing total volume at a given point in time to the average cumulative volume at that same time over a historical period.
CRVOL = Cumulative Volume at Time X / Average Cumulative Volume at Time X over N periods
Where:
Cumulative Volume at Time X = The total volume traded from market open up to time X.
Average Cumulative Volume at Time X = The average total volume at that point in time over a selected historical period (e.g., 10 days).
N periods = The number of historical sessions used for comparison.
A CRVOL > 1 indicates higher-than-normal trading activity, while CRVOL < 1 suggests lower-than-average activity.
Interpretation
CRVOL > 1.5: Significantly higher trading activity than usual, often linked to news events, earnings reports, or institutional participation.
CRVOL ≈ 1: Normal trading volume, suggesting typical market conditions.
CRVOL < 0.8: Below-average trading volume, often indicating low liquidity and reduced volatility.
07. Open Interest 📊
Open Interest (OI) is a key metric in derivatives markets (futures and options) that represents the total number of outstanding contracts that have not been settled or closed. It is an important indicator of market activity, liquidity, and trader commitment.
How it works?
Open Interest increases or decreases based on the interaction between buyers and sellers:
OI Increases: When a new buyer and a new seller enter the market, creating a fresh contract.
OI Decreases: When an existing buyer and seller close their positions (either by offsetting trades or expiration).
OI Unchanged: If an existing contract is transferred between traders (one trader closes, another opens an equal position).
Interpretation
Rising OI + Rising Price: Suggests strong buying interest, indicating a bullish trend with conviction.
Rising OI + Falling Price: Indicates strong selling pressure, confirming a bearish trend.
Falling OI + Rising Price: Signals a short-covering rally or weakening trend, as traders close positions.
Falling OI + Falling Price: Suggests a lack of commitment to further declines, indicating potential trend exhaustion.
08. Volume Profile 🎢
Volume Profile is a powerful market analysis tool that plots trading volume at different price levels over a specific period. Unlike traditional volume indicators, which show volume per time interval, Volume Profile reveals where the most buying and selling activity occurred, helping traders identify key support and resistance levels, market structure, and potential price reactions.
Components
Volume Profile is displayed as a histogram on the vertical axis, showing the amount of volume traded at each price level. It is built using tick data or intraday price action and is often calculated for different timeframes (daily, weekly, monthly, or custom sessions).
Key components of Volume Profile include:
Point of Control (POC): The price level where the highest volume was traded, acting as a major support/resistance zone.
High Volume Nodes (HVN): Price areas with heavy trading activity, indicating consolidation zones where price is likely to stabilize.
Low Volume Nodes (LVN): Price areas with little trading activity, often leading to fast price movements as there is little resistance or support.
Value Area (VA): The price range where 70% of the total volume was traded, representing the "fair value" zone of the market.
Value Area High (VAH) & Value Area Low (VAL): The upper and lower boundaries of the Value Area, acting as dynamic support and resistance levels.
Types
Session Volume Profile: Analyzes volume for a single trading session (daily or intraday).
Composite Volume Profile: Covers a longer period (weeks, months, or custom-defined ranges).
Fixed Range Volume Profile: Analyzes volume for a specific price range or custom-selected area.
Developing Volume Profile: Updates dynamically throughout the trading session to show real-time changes in volume distribution.
Interpretation
POC as a Magnet: Price tends to revisit the POC due to high liquidity and market agreement at that level.
Breakouts from Value Area: If price breaks above VAH with strong volume, it signals a bullish trend; if it breaks below VAL, it signals a bearish trend.
Reaction at LVN: Price moves quickly through LVN areas but may reverse or stall when approaching HVN.
Rejections at VAH/VAL: If price rejects VAH, it may return to POC or VAL, and vice versa.
09. Indicators 📦
Volume indicators help traders gauge market strength by analyzing the number of shares or contracts traded.
Volume (Default) – Displays the total volume traded per candle, often color-coded based on price movement.
Volume Profile (Fixed Range, Session, Visible Range) – Shows volume distribution across price levels to identify support and resistance zones.
Volume Weighted Average Price (VWAP) – A dynamic support/resistance line that calculates the average price based on volume.
On-Balance Volume (OBV) – Measures cumulative volume flow to detect price trends and confirm breakouts.
Money Flow Index (MFI) – A volume-weighted RSI-like oscillator that identifies overbought and oversold conditions.
Volume Delta – Measures the difference between buying (ask) and selling (bid) volume.
Cumulative Delta Volume – Tracks the cumulative sum of volume delta over time to assess buying/selling pressure.
Relative Volume (RVOL) – Compares current volume to historical averages to highlight unusual trading activity.
Key Takeaways 📋
Volume is a crucial market indicator that reflects trading activity and liquidity, often preceding price movements.
High volume confirms trends and breakouts, while low volume can signal weak or false moves.
Volume Profile identifies key support and resistance zones, with High Volume Nodes (HVNs) acting as strong barriers and Low Volume Nodes (LVNs) allowing fast price movement.
Relative Volume (RVOL) highlights unusual market activity, while Delta Volume and Cumulative Delta reveal buying and selling pressure.
VWAP serves as a dynamic support/resistance tool commonly used by institutional traders.
GBPCHF is all set to continue its downward movement!The price is moving down within a descending channel. Right now, it bounced off the upper limit of the channel and hit a key weekly resistance. A candlestick pattern with a long upper wick and a small body has formed. Plus, the price has formed a triple top with lower highs. A short trade looks good based on price action and backed by volume analysis, which clearly shows a clear exhaustion of buyers. GBPCHF is moving towards the major volume activity price range around 1.12. On top of that, volume analysis backs this up, indicating that buyers are getting stronger and ready to push the price down.
Time Frame: daily
Idea support:
- Price action
- Volume Analysis
- Trend analysis

USDCHF ready to continue the upward move! Hello traders!
Price making a candlestick with a long lower shadow indicating a bounce into support. The downtrend was broken a few candles ago. Price at 61.8% Fib after a correction. Volume and CVD supporting the idea.
Timeframe: daily
Idea support:
- Price action
- Volume Analysis
- Trend analysis

NZDJPY is all set to continue its upward movement! The price is moving within an ascending channel and has just hit the lower limit again, bouncing back up and forming a bullish candlestick with a long lower wick and a small body. This suggests that sellers have made another unsuccessful try to change the trend, even creating a higher low that backs up the uptrend. The price is also bouncing off the 50% Fibonacci retracement level. NZDJPY is moving towards the major volume activity price range around 90.5. On top of that, volume analysis backs this up, indicating that buyers are getting stronger and ready to push the price up.
Time Frame: daily
Idea support:
- Price action
- Volume Analysis
- Trend analysis

CVD AI PRO - 3.1 Conservative Day Trader CVD AI PRO - 3.1 Conservative Day Trader (updated)
Summary:
This advanced technical indicator combines Cumulative Volume Delta (CVD), Dynamic Average True Range (ATR), and Percentage Change analysis to generate long trading signals. Designed for the discerning trader, it integrates a comprehensive approach by considering volume, price volatility, and trend momentum to identify potential market entry points.
Features:
• Timeframe Selector: Allows users to specify the desired analysis timeframe, enhancing the indicator's flexibility across different trading strategies.
• Conservative Signal Filter: An optional filter that prevents the generation of consecutive buy or sell signals without an alternating signal, promoting a disciplined trading approach by ensuring that each buy signal is followed by a sell signal and vice versa.
• ATR-Based Stop Loss Calculation: Utilizes a dynamic ATR multiplier to determine optimal stop loss levels, adjusting to market volatility.
• Cumulative Volume Delta (CVD): Offers insights into market momentum by accumulating volume changes, providing a unique perspective on market sentiment.
• MACD & Confidence Level Analysis: Incorporates MACD line movements and a custom confidence level based on CVD normalization to refine signal accuracy.
• Volume Filter: Enhances signal reliability by including volume trends in the analysis, with options to activate or deactivate this filter based on user preference.
• Customizable Parameters: Includes user-defined inputs for ATR length, CVD length, MACD settings, and more, offering a tailored analytical experience.
• Signal Labels with Enhanced Visibility: Marks buy and sell signals directly on the chart with labels featuring increased font size, improving readability and decision-making speed.
• Directional Trend Labels: Provides immediate visual cues about the market's direction, aiding in quick assessment of current market trends.
Use Cases:
Ideal for traders looking for a comprehensive, multifaceted technical analysis tool, this indicator suits various trading styles, from swing trading to longer-term investment strategies.
The Conservative Signal Filter and enhanced signal labels particularly benefit users seeking to minimize risk and focus on clear, well-defined market entry and exit points.

CVD PRO Buy Sell Signals for scalping in Crypto FuturesCVD PRO v3.0 - Crypto Capital International
Indicator Overview:
This indicator combines several key elements to provide insights into market trends and potential trading signals. It incorporates Cumulative Volume Delta (CVD), Dynamic Average True Range (ATR), Percentage Change, MACD (Moving Average Convergence Divergence), and G-Trend filters. By analyzing volume, price movements, and momentum indicators, it aims to identify potential buying and selling opportunities.
1. How It Works:
• CVD (Cumulative Volume Delta): CVD is calculated by cumulatively summing the volume multiplied by the sign of price changes. This helps gauge the strength of buying or selling pressure.
• ATR (Average True Range): ATR measures market volatility, providing insights into potential price movements. The dynamic aspect adjusts ATR based on market conditions.
Percentage Change: This indicator calculates the percentage change in price over a specified period.
• MACD: MACD is a trend-following momentum indicator that helps identify trend direction and potential reversals.
• G-Trend: G-Trend identifies bullish or bearish trends based on price movements relative to a moving average.
2. How to Use It:
• Buy Signals: Generated when confidence level surpasses a threshold, MACD signal is bullish, CVD is positive, and optionally, volume filter conditions are met.
• Sell Signals: Generated when confidence level surpasses a threshold, MACD signal is bearish, and optionally, volume filter conditions are met.
3. Market Conditions It Works In:
The indicator is suitable for various market conditions, including trending, ranging, and volatile markets.
It's particularly effective in identifying trends and potential reversals during periods of significant volume and price movement.
4. Base Indicators Explained:
CVD: Measures volume-based buying or selling pressure.
ATR: Indicates market volatility and potential price ranges.
MACD: Identifies trend direction and momentum.
G-Trend: Helps confirm bullish or bearish trends.
5. Volume Filter:
The volume filter optionally includes green (bullish) or red (bearish) volume bars to confirm buy or sell signals.
Traders can toggle the volume filter based on how many signals will be filtered from the daily volume inflows or outflows
Volume Bar Colors:
The volume filter compares the current volume bar color with the previous volume bar color.
A green volume bar indicates that the closing price of the current bar is higher than the closing price of the previous bar, suggesting bullish sentiment.
A red volume bar indicates that the closing price of the current bar is lower than the closing price of the previous bar, suggesting bearish sentiment.
Filter Logic:
For buy signals, the volume filter confirms bullish momentum by checking if the current volume bar is green (indicating buying pressure).
For sell signals, the volume filter confirms bearish momentum by checking if the current volume bar is red (indicating selling pressure).
Usage:
Traders can choose to enable or disable the volume filter based on their trading preferences.
Enabling the volume filter adds an additional confirmation criterion to buy and sell signals, potentially increasing the reliability of trade decisions.
Disabling the volume filter ignores volume bar colors and relies solely on other criteria (such as MACD, CVD, and confidence level) for generating signals.
Considerations:
The volume filter is optional and can be toggled on or off based on individual trading strategies.
It's important to consider the overall context of price action and volume trends when interpreting volume bar colors.
Traders may adjust the sensitivity of the volume filter or combine it with other volume-based indicators for more nuanced analysis.
Implementation:
The indicator code includes logic to check volume bar colors (green or red) and incorporates this information into signal generation.
Buy signals are confirmed by green volume bars, while sell signals are confirmed by red volume bars.

Bitcoin Price Action and Data Analysis: A Trading OverviewIn the realm of Bitcoin (BTC) trading, it is vital to pay close attention to both price action and data analysis in order to formulate effective strategies. Here's a brief overview of some key elements I have noticed in recent trading patterns.
Firstly, concerning BTC price action analysis, a notable event is the sweeping of the monthly high. This means that BTC's price has not only touched but exceeded the highest point it has reached within this month. While this can be a bullish indicator, it's also worth noting that there's a monthly level resistance, another critical factor to consider. Monthly resistance is a level where sellers tend to enter the market in larger numbers, pushing the price down.
With just 24 hours left until the U.S. stock market opens on Monday, it would be wise to take a pause. Rather than rushing into a decision, I will wait until Tuesday, after the formation of Monday's high and low points. This way, I can devise subsequent strategies based on more concrete data.
Switching focus to BTC data analysis, several observations are worth discussing. To begin with, early positioning at the bottom has been squared off. This essentially means that traders who had opened positions expecting the price to drop further have now closed their positions.
Moreover, Cumulative Volume Delta (CVD), a technical indicator used to show the difference between the Buy and Sell volume, has not been able to keep up with the recent local highs. This could potentially signal a lack of buying pressure in the market. (Check in updated ideas)
A slight increase in the long-short ratio is observed, indicating a modest growth in the number of long positions compared to short ones. However, it's crucial to acknowledge the multiple large-scale short squeezes that have happened, where the price of BTC rises sharply forcing short sellers to close their positions.
These factors, coupled with recent market conditions, are fostering a bias towards the bearish side. However, it's crucial to remember that market sentiment can quickly shift. While these factors can guide strategic decisions, they should not be the sole basis for making trades. Always conduct thorough research and maintain a comprehensive understanding of the market's volatility.

Bitcoin - BTC near points of bullish power🔴Bitcoin BTC
The Cumulative Volume Delta (CVD) displays the cumulative volume changes based on the volume traded by sell aggressors🟢versus buy aggressors⚫️
Points of switch to bullish power🔴
Are we here dear Crypto Nation?👀🚨🚀
Comments💭, Likes♥️ & Follow🔗appreciated
Disclaimer:
Not financial advice
Do your own research before investing
The content shared is for educational purposes only and is my personal opinion

📊 Cumulative Volume Delta (CVD)📍 CVD describes the number of contracts bought at the offer minus those sold at the bid. It simply measures the "aggressiveness" of buyers versus sellers. If the sellers are aggressive, they place limit orders instead of market selling and vice versa. CVD is the easiest method to use delta in your trading.
🔹UPTREND EXHAUSTION
Price is making new highs but CVD isn't. This shows a lack of interest coming from aggressive buyers who would be needed to continue the price increase. We can expect a short term reversal to the downside.
🔷UPTREND ABSORPTION
CVD is making new highs but price isn't. This shows that there is a lot of activity from aggressive buyers trying to push the price higher but their market buy orders are getting absorbed by limit sell orders.
🔷DOWNTREND EXHAUSTION
Price is making new lows but CVD isn't. This shows a lack of interest coming from aggressive sellers who would be needed to continue the price decrease. We can expect a short term reversal to the upside.
🔷DOWNTREND ABSORPTION
CVD is making new lows but price isn't. This shows that there is a lot of activity from aggressive sellers trying to push the price lower but their market sell orders are getting absorbed by limit buy orders.
👤 @AlgoBuddy
📅 Daily Ideas about market update, psychology & indicators
❤️ If you appreciate our work, please like, comment and follow ❤️

CVD, OI, & PRICE - real-time understanding of PACVD, OI, & PRICE - lets you have a look into
▶️ shorts vs longs
RULE OF THUMB:
- longs opening = bullish
- shorts closing = bullish
- longs closing = bearish
- shorts opening = bearish

Another BTC Short Squeeze coming? Can we go higher today?CME:BTC1! INDEX:BTCUSD BYBIT:BTCUSD
Yesterday I took a long on Bitcoin as I saw a short squeeze playing out.
This morning I'm seeing almost an identical situation unfolding. Massive market shorts opening at a weekly support and at the lows of the candles.
If we have big demands for longs turning up, we will see over leveraged shorts closing up and a possible move up above current resistances.
I take you through the scenarios that could play out and what to look out for.
I'm still in my long trade from yesterday, with stops in profit.
BTC will also move with the traditional markets. If the ES pumps, so will bitcoin, so be sure to keep an eye on that asset.
Keep good risk management in your trades!
Not Financial Advice. DYOR. Papertrade before trading with real money.
Hope you have a profitable trading day!
Shawn

BTC Short Squeeze spotted-CVD and Order Flow for the win!BTC Short squeeze spotted-CVD and Order Flow for the win! (Long Trade!)
Why it's important to be able to read order flow and CVD. So many youtubers get super bearish at support and super bullish at resistance.
I show you how I spotted the short squeeze before it happened and my reasons for entering a long trade on BTC
Not Financial Advice. DYOR. Papertrade before trading with real money.
Hope you have a profitable trading day!
Shawn

Unfi Short Scalp using CVD to confirm the trade - 84.86% profit BINANCE:UNFIUSDT BYBIT:UNFIUSDT COINBASE:UNFIUSD
Educational post on CVD or Cumulative Volume Delta and how I use it to confirm scalps and swing trades
Unfi Short Scalp using CVD to confirm the trade - 84.86% profit in 30 minutes!
Delta only shows us market orders. NB!!!
Bearish CVD: (used in this trade)
Price making LH but CVD making HH. People are aggressively market buying, but highs in price can’t be taken out. Bigger limit order trader has absorbed price
Bullish CVD:
More people market shorting (CVD) but Price forms HL. CVD makes LL.
if price making HL and more people market shorting, then a bigger trader or traders has come in with a limit order and absorbed the market shorts
Both leads to trapped traders and you can expect a decent follow through.
Not Financial Advice. DYOR. Papertrade before trading with real money.
Hope you have a profitable trading day!
Shawn

C98USDT Ready to break out? Bullish OBV and CVD DivergencesBYBIT:C98USDT
Coin98 is currently bouncing off the range POC. If we get bullish price action here and hold this level, we could see a breakout happening.
Bullish OBV and CVD Divergences are forming on the 30m and 1hr chart.
We also have a massive Falling Wedge pattern. If we break out of the upper trendline, we could see big moves ahead, especially if Bitcoin breaks out and starts heading towards $35000.
TP areas in the video as per levels marked on the chart.
SL according to your risk tolerance.
Not Financial Advice. DYOR. Papertrade before using real money.
If this analysis helped you, please give it a thumbs up and follow.
Trade Safely,
Shawn

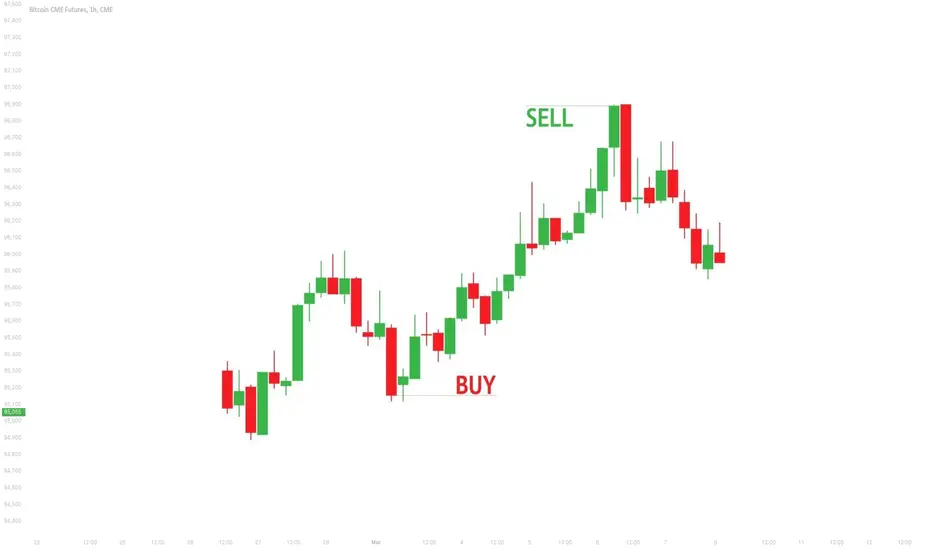
Bitcoin turning pointCandles that paint a divergence in price and cumulative volume delta act are important turning points.
Significant area has formed and held as a support level with 2 strong bullish candles.
Pampet

COMP- Wait for the deep retracement to finish before going longDeFi lending governance tokens such as MKR and COMP are the ones that started the DeFi gold rush!
Though LINK may have benefited the most regardless of which governance token wins out at the end because of the pick and shovel effect.

Bitcoin- Bearish retracement vs Bullish reversal? Answer insideHello traders!
I would really appreciate it if you can like my post and follow me if you find my post useful :)
Short-term perspective- Derivative exchanges such as Bitmex and Okex (Both have high trading volume and oI) seem to be betting against bulls at this moment. Even though buying pressure was fierce yesterday at Bitmex, it was not able to break through major sell walls. More likely, we will see the BTC price retraces below 9k once the price reaches 9.2k-9.3k because the volume is on the slow decline as the price went up.
I would continue to buy on the dip up to 8.7k lvl as long as there is no violent price rejection at 9.2k-9.3k lvl. Of course, being cognizant of the fact that BTC could very likely be in the bearish retracement phase, keep the positional size small, stop loss tight and take profit aggressively.
Mid-term perspective- Strong technical confluence and sell walls are located around 9.5k-9.7k lvl. Even if bulls can blast through 9.3k, I see bears step in and potentially end this bearish retracement. Good time to flip short at 9.5k- 9.7k lvl.
If bulls can convincingly break through 9.8k lvl and find the support at the price lvl, then we can safely assume this little correction is over.
No matter what your directional bias is, I would definitely keep buy orders between 7.8k-8k range as I still believe that is the price lvl where bullish reversal/bottom for this correction will take place.
Until next time, happy trading
