CVNA EARNINGS TRADE IDEA — July 30 (AMC)
## 🚗 CVNA EARNINGS TRADE IDEA — July 30 (AMC)
**Carvana (CVNA)**
📊 **Bullish Confidence**: 85%
📈 **Earnings Play Setup**
💣 Big Volatility + Strong History = Explosive Potential
---
### ⚙️ FUNDAMENTALS SNAPSHOT
✅ **Revenue Growth**: +38.3% YoY
🔁 **8/8 EPS Beats** (114.5% avg surprise)
🟡 **Profit Margin**: 2.7% (Thin but improving)
⚠️ **Debt-to-Equity**: 344.78 (High leverage risk)
💬 **Sector Rotation**: Growth favors high-beta names
💡 **Beta**: 3.60 → Big post-earnings swings likely
---
### 📊 OPTIONS FLOW HEATMAP
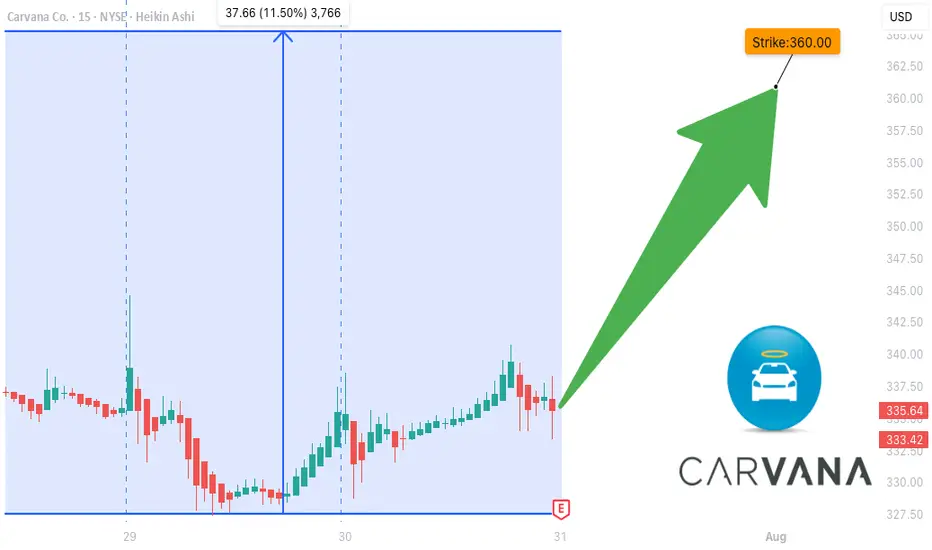
🔥 Heavy Call Volume @ \$360–\$370
🟢 Bullish OI Stack
📉 Put/Call Skew: CALL DOMINANT
💥 IV Elevated = Lotto ticket pricing
---
### 📈 TECHNICALS
💵 Price: \$336.50
🧱 Resistance: \$343.68
📉 RSI: 44.5 (Neutral – Room to Run)
📊 200D MA: \$252.21 → Long-term bullish positioning
---
### 🔥 TRADE IDEA:
**CVNA 08/01 \$360 CALL**
🎯 **Entry**: \$11.25
🚀 **Target**: \$33.75 (200% ROI)
🛑 **Stop**: \$5.60
📊 **Size**: 1 contract
⏰ **Entry Timing**: Pre-Earnings Close (AMC play)
---
### 📉 RISK / REWARD
* 🟥 Max Loss: \$11.25
* 🟩 Profit Target: \$33.75
* ⚖️ RR Ratio: 1:3
* 💼 Portfolio Risk: 2–3%
---
### 🧠 STRATEGY INSIGHTS
✅ Historical beat rate = STRONG
✅ Bullish options skew = CONFIRMED
⚠️ High debt = risk, but momentum > fear
📌 Tip: If IV crushes post-earnings, exit fast. This is a *structured speculative play* — not a hold-and-hope.
---
📢 "Speculation is fine. Structure it."
💬 Tag a trader who *YOLOs with stop losses* 👇
\#CVNA #EarningsPlay #OptionsTrading #TradingView #HighBeta #LottoPlay #RiskManaged #CallOptions #BullishSetup #IVCrushProof #EcommerceStocks #EarningsSeason
CVNA
Carvana Leading Auto Retail – Outpacing LAD & AN-Financial Performance & Momentum:
Carvana reported a record-breaking adjusted EBITDA of $488M in Q1 2025, up $253M YoY, with an EBITDA margin of 11.5% (+3.8pp YoY). The company's strong operational efficiency positions it as a leader in the auto retail industry, nearly doubling the margins of competitors like Lithia Motors (LAD) and AutoNation (AN).
- Competitive Positioning & Growth Outlook:
Carvana’s EBITDA quality is superior due to lower non-cash expenses, enhancing long-term sustainability. The company expects sequential EBITDA growth in Q2 and targets 13.5% EBITDA margins within 5-10 years.
-Peer Comparison:
- Lithia Motors (LAD): EBITDA margin at 4.4% (up from 4% YoY), facing tariff-related headwinds that could impact pricing and demand.
- AutoNation (AN): SG&A as a percentage of gross profit rose to 67.5% in Q1, expected to stay between 66-67% in FY 2025, pressuring margins further.
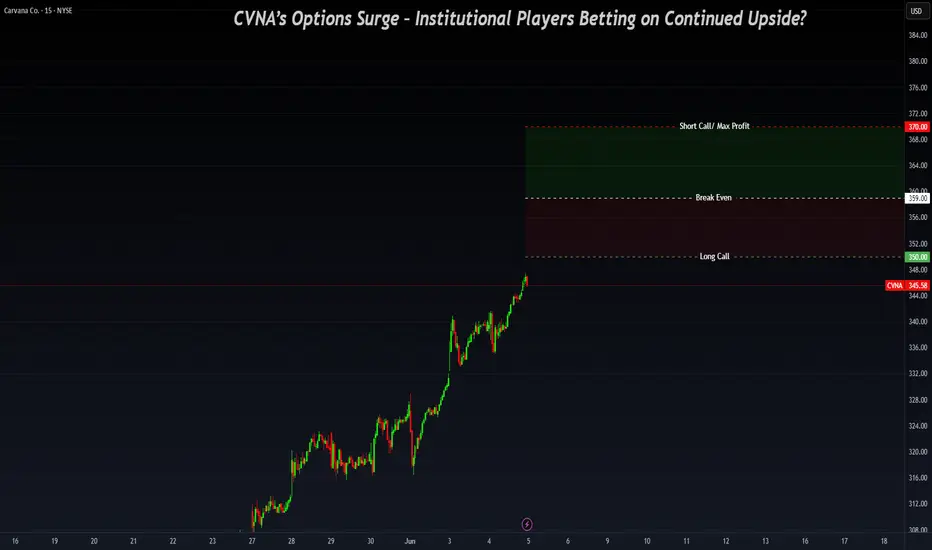
-Options Flow & Institutional Activity - Key Levels: $350/$370
Recent institutional flow activity indicates strong positioning around $350/$370 strikes, potentially signaling a vertical spread in play rather than outright selling:
1️⃣ Momentum Confirmation:
- CVNA has strong upside momentum following its Q1 results, reinforcing a bullish outlook for near-term price action.
- Institutional traders may be accumulating bullish vertical spreads rather than unwinding positions.
Vertical Spread Setup ($350/$370 Strikes)
- Long Call ($350 Strike) → Signals expectations for further upside.
- Short Call ($370 Strike) → Caps max profit while reducing cost.
- Breakeven Price: $359 → CVNA must close above $359 for profitability.
Profit & Risk Zones
- Above $370: Maximum profit achieved.
- Between $359-$370: Partial profit zone (spread remains in play).
- Below $359: Spread loses value, making recovery dependent on extended upside momentum.
CVNA Swing Trade Plan – Bearish Breakdown (June 13, 2025)🛑 CVNA Swing Trade Plan – Bearish Breakdown (June 13, 2025)
📉 Setup Summary:
CVNA is flashing strong bearish momentum across 15-minute and daily charts, confirmed by multiple AI models. Although slightly oversold in the short term, the overall directional thesis remains intact: downside toward $293–$295 seems likely in the coming sessions.
🔍 Multi-Model Technical Consensus
Trend: Bearish across 15-min and daily; weakening on weekly
Momentum: MACD bearish, RSI near oversold but no bullish divergence
Volume: Spike on red candles confirms seller strength
Support/Resistance Zones:
• Resistance: $310–$320
• Support: $292–$295
Max Pain: $320 (may act as a temporary gravitational pull on bounce)
🧠 AI Model Signals
✅ Grok/xAI: $310 PUT — bearish, aligns with max pain retrace
✅ Llama/Meta: $300 PUT — short-term continuation
✅ Gemini/Google: $280 PUT — deep OTM swing toward structural support
✅ DeepSeek: $305 PUT — best balance between liquidity, risk/reward, and chart structure
🧩 Conclusion: Slight preference for the $305 PUT for its technical alignment and capital efficiency.
📈 Trade Recommendation
🔻 Strategy: Buy Naked PUT
Ticker: CVNA
Strike: $305
Expiry: 2025-06-27
Entry: At market open
Target Entry Price: $10.50
Profit Target: $15.75 (+50%)
Stop-Loss: $7.35 (–30%)
Confidence: 75%
⚠️ Risk Considerations
Short-Term Bounce Risk: Extremely oversold 15m RSI might trigger intraday upticks
Macro Reversal: Broader market rally or surprise CVNA news could invalidate the bearish thesis
Premium Sensitivity: CVNA is volatile; strict stop-loss adherence is key
Max Pain Risk: Reversion to $320 could neutralize gains quickly
💬 Swing traders — what’s your play here?
Do you ride the momentum lower, or is this oversold enough to fade?
Drop your take 👇 and follow for daily AI-backed trade setups.

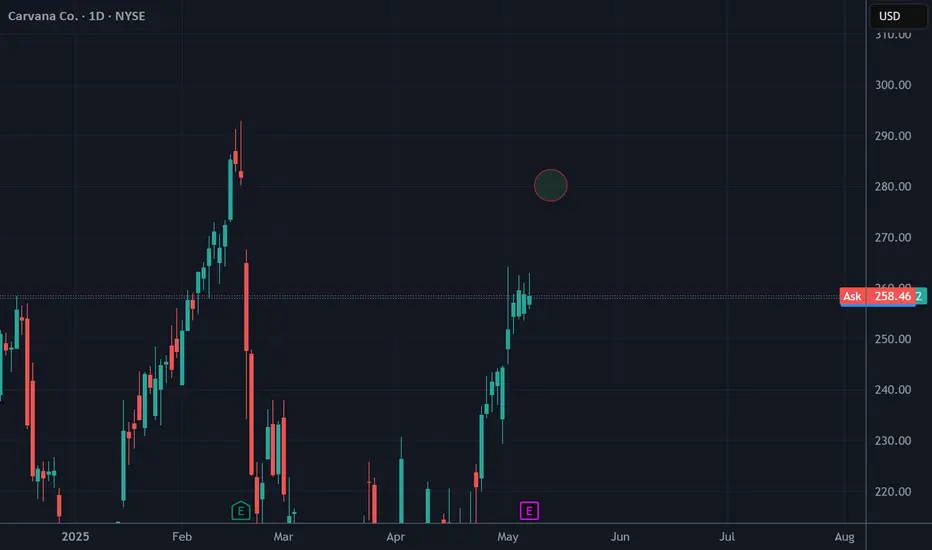
CVNA - Carvana at upper extreme. I'm shorting again!I stand by my posts about CVNA.
It's fishiy and it stinks!
Chart wise, price is at the upper extreme again.
A nice short is setting up, and this time for a much larger move...I think, feel, expect.
"...but, isn't there more to say? You MUST explain WHY and WHEN...", I have people saying.
No, it's not a joke.
I leave it with that §8-)

$CVNA - 260CallHi all,
My ai pinged me suggesting a 260 Call expiring around the 6'th of June on CVNA.
This model's performance is not terrible, but i;m not comfortable listening to my own AI which is suggesting to buy a call literally just before earnings. 2.6 Sharpe isn't bad but it's no 3.6 meaning it's not a guaranteed win.
imgur.com
I am more keen on seeing whether the AI right or wrong and letting you guys know about the trade.
Now my AI also suggests that other CAR sector related stocks may experience moves as well, maybe more than CVNA itself. Unfortunately i do not know which ones those are. I just know the CAR sector good.
Carvana - More Fish To Come? You Bet!After the first post about CVNA, I bailed out on a small loss (see linked Chart). But then Immediately loaded Puts and had a good "Steak & Lobster" time §8-)
Price behaves like textbook when we consult the Medianlines trading framework and rule set.
First price reached the red Centerline, followed by the expected pullback to the white Lower-Medianline-Parallel.
If the "Fish" can't manage to jump back into the white Fork, then I expect much more downside to come. If this is the case, we have two good looking PTG's at PTG1 & PTG2.
To me, this Scam Company (see my first post) is done. It's just a matter of time.
For the longer time frame, I will check out ITM LEAP-Puts and let them profit from the ride to the south.
And for short term trades, I just wait for pullbacks as it did now, and take it short to finance some of my LEAPs, Dinner and Weekend Holidays.
Isn't it nice, how we can find good even in bad? §8-)
May the Fish be with us!

Carvana's Fundamentals And Chart Screeming For A ShortFrom a very well known Short-Seller in the markets I read a concerning letter this morning:
"Carvana Trades At An 845% Higher Sales Multiple Than Online Car Peers Like CarMax and AutoNation, And A 754% Premium On A Forward Earnings Basis."
...ummmhh... §8-()
The Chart does look very scary too.
This exponential move can't sustain very long. As we see, the first bounce already alerts me to prepare for a big short.
If this plays out as projected, we see a heavy dump in the coming weeks and months.

Get Prepared! Watch This BEFORE Markets Open on Tuesday!Weekly Preview:
- Inflation Talk from last Week
- Economic Calendar for this week
- Earnings Preview with Technical Analysis
Enjoy Friends!
Not financial advice

Major Price Movement Incoming for CVNA!Signalist has detected a precise pattern in NYSE:CVNA trading activity, signaling that a substantial price movement is imminent. This isn’t a random fluctuation—it’s a carefully analyzed precursor to a significant market event.
📅 What to Expect:
⌛ Timeline: Anticipate a major move within the next 1 to 4 upcoming 3-hour candles.
📈 Monitor the Charts: Keep an eye on CVNA’s price action over the next few candles.
Prepare Your Strategy: Whether you’re bullish or bearish, have your trading plan ready to capitalize on the move.

Carvana & RatesCarvana has seen boom, bust and now boom, bust? But what is drives the market's views on Carvana? I think one answer is rates.
Rates seem to have a very strong inverse and leading effect on Carvana stock price. What do you think?
Disclaimer:
The ideas I post are my opinions and not recommendation or advice. They are intended for discussion purposes only.

CVNA Carvana Sell-Off: Hindenburg Research Short PositionIf you haven`t bought CVNA at $25:
Carvana Stock Now Faces Major Risks: A Price Target of $127
Carvana Co. (CVNA), currently trading at $199, faces mounting scrutiny after allegations from Hindenburg Research. The short-seller’s report, titled “Carvana: A Father-Son Accounting Grift for the Ages,” accuses the company of unsustainable growth fueled by lax underwriting standards and questionable insider dealings.
Key Concerns:
Insider Selling: CEO Ernest Garcia III and his father, Ernie Garcia II, sold $3.6 billion in stock between 2020-2021, with an additional $1.4 billion sold last year after a 284% stock surge.
Loan Portfolio Risks: Claims suggest Carvana approves nearly all loan applicants, increasing exposure to subprime defaults as economic conditions tighten.
DriveTime Transactions: Allegations of inflated revenues through sales to DriveTime, owned by Garcia II, raise conflict-of-interest concerns.
Manipulated Results: Extensions on subprime loans reportedly delay delinquencies, misrepresenting financial health.
Outlook:
While the stock has shown resilience, we believe these risks significantly outweigh the rewards. With questionable accounting practices and a vulnerable loan portfolio, our price target is $127.

Carvana (CVNA) AnalysisCompany Overview:
Carvana, a leader in the online used car market, is transforming its business model following its acquisition of ADESA's U.S. physical auction business in 2022. This acquisition has positioned Carvana as the second-largest used car company in the U.S. and is driving a shift towards a more profitable marketplace model.
Key Highlights:
Strategic Acquisition: The acquisition of ADESA's auction business is expected to enhance Carvana's profitability by transitioning towards a marketplace model, which offers higher margins compared to its traditional retail operations.
Competitive Advantage: Carvana outperforms competitors like CarMax and AutoNation in terms of gross margin and profit per unit, bolstered by its strong online platform.
Cost Efficiency: The company has successfully reduced over $1.1 billion in annual selling, general, and administrative (SG&A) expenses, demonstrating a commitment to improving operational efficiency.
Financial Flexibility: Carvana secured a deal with creditors to extend loan maturities, providing the company with greater financial flexibility to navigate future challenges.
Investment Outlook:
Bullish Outlook: We are bullish on NYSE:CVNA above the $116.00-$118.00 range.
Upside Potential: With an upside target of $230.00-$240.00, investors should consider Carvana's strategic shift, competitive advantages, and improved financial flexibility as key drivers for potential stock appreciation.
📈🚗 Carvana is driving towards profitability—consider it for a potentially lucrative investment opportunity! #CVNA #UsedCars 🚗🚀

CVNA Carvana - Is it on your watchlist?CVNA Carvana is starting to move above the 200 day EMA 'watermark'. As interest rates level off and eventually come down, the consumer will have a green light to make big purchases again. CVNA shows a lot of opportunity (800%?) between current price and all-time highs. Why is Carvana not on your watchlist?

CVNA , US Stock120.50 below trendline breakdown
118/116/113/105/100/90 can test to fill the gap
21 ema below close yesterday

Did you know Carvana is up 15X?! OMG :)Look what we have here.
Incredible price action from this stock..
what should you do if you hold it...
or if you are feeling #FOMO
maybe this idea will help.
Inverse Head and shoulders there for all to see.


CVNA continuationCVNA is looking like a solid continuation setup. Strong earnings gap, then pullback to trend seems to be a pattern with this name similar to the other circled areas.

Carvana Shares Spike 35% on Earnings Beat First Quarter Results
Carvana ( NYSE:CVNA ) stock Skyrocketed more than 30% during Thursday's market open after the used car retailer reported record results and turned a profit during the first quarter.
Company's Performance
Earnings per share: 23 cents — it was not immediately clear if it was comparable to the loss of 74 cents expected.
Revenue: $3.06 billion reported Vs. $2.67 billion expected
Carvana ( NYSE:CVNA ) reported record first-quarter net income of $49 million, compared to a $286 million loss during the prior-year period. Carvana ( NYSE:CVNA ) also posted an all-time-best adjusted earnings before interest, taxes, depreciation, and amortization, or EBITDA, of $235 million, up from a $24 million loss a year earlier.
Carvana's ( NYSE:CVNA ) gross profit per unit, or GPU, which is closely watched by investors, was $6,432. Carvana’s adjusted EBITDA profit margin for the quarter was 7.7%.
Carvana’s net income included a roughly $75 million gain in the fair value of Carvana’s warrants to acquire Root Inc. common stock. This did not impact its GPU or adjusted EBITDA.
“In Q1, we delivered our best results in company history, validating our long-held belief that Carvana’s online retail model can drive industry-leading profitability while delivering industry-leading customer experiences,” Carvana CEO and Chairman Ernie Garcia III said in a release.
He reiterated that the company’s performance was driven by efficiency gains in its operations, especially the reconditioning of vehicles for sale as well as selling, general, and administrative expenses, among other areas.
Carvana ( NYSE:CVNA ) expects to continue to grow its adjusted EBITDA profit margin further as the company continues to grow, according to Garcia. He declined to disclose how high the company believes it can grow those results.
The company anticipates further cost reductions or efficiency gains to increase profitability through areas such as advertising as well as overhead and operational expenses.
Garcia said Carvana ( NYSE:CVNA ) is working on increasing vehicle reconditioning and profitably rebuilding its vehicle inventory, which was nearing an all-time monthly low of 13 days’ supply in March. It has increased its reconditioning capacity of vehicles to prepare for sale by roughly 60% during the past year.
he told CNBC that “Acquiring inventories, generally speaking, feel relatively straightforward to scale, but growing the recondition capacity is difficult,”. “Inventory today is certainly tighter than we would like for it to be. We’re working hard to build it back up, but we’re extremely well-positioned to do it.”
Over the past two years, the results follow a major restructuring by the company to focus on profitability rather than growth, after bankruptcy concerns when Carvana’s stock lost nearly all of its value in 2022.
Carvana ( NYSE:CVNA ) Shares have recovered since then. They had climbed roughly 67% year to date before the company reported its first-quarter results. The stock closed Wednesday up about 5% at $87.09 per share.
For Q2, Carvana ( NYSE:CVNA ) said it expects a sequential increase in its year-over-year growth rate in retail units, and a sequential increase in adjusted earnings before interest, taxes, depreciation, and amortization.
Technical Outlook
Carvana ( NYSE:CVNA ) stock is trading within the overbought region with a Relative Strength Index (RSI) of 82.10 posing a threat of a trend reversal in the near term. Furthermore, the stock indicates a breakaway gap which occurs when the price gaps above a support or resistance area due to a news or fundamental.

CARVANA $CVNA | RANGE BREAKOUT BEFORE EARNINGS - Apr. 23rd,CARVANA NYSE:CVNA | RANGE BREAKOUT BEFORE EARNINGS - Apr. 23rd, 2024
BUY/LONG ZONE (GREEN): $72.50 - $81.25
DO NOT TRADE/DNT ZONE (WHITE): $68.50 - $72.50
SELL/SHORT ZONE (RED): $60.00 - $68.50
Weekly: DNT
Daily: DNT
4H: DNT, lean bullish
This was requested at the end of last week but I didn't get around to it. I drew up this NYSE:CVNA chart analysis yesterday as I was entering a new trade, but wanted to wait until today to post it. I did not adjust the zones and kept them as they were yesterday, even though today price has already broken into the bullish zone, there is still room to enter new trades to the upside, or if bears want to take on some extra risk they could enter extremely early here if they expect a pullback. Earnings release next Wednesday, May 1st, 2024, and I'm looking to take advantage of possible volatility. NYSE:CVNA has broken down structure on the weekly timeframe, developed bearish structure on the daily (which is now broken as of today), and had a defined range on the 4H (which was also broken as of today).
Previous NYSE:CVNA trade idea is linked below!
This is what I would personally look at before entering trades, everything is subject to change on a daily basis and as I analyze different timeframes and ideas.
ENTERTAINMENT PURPOSES ONLY, NOT FINANCIAL ADVICE!
trendanalysis, trendtrading, priceaction, priceactiontrading, technicalindicators, supportandresistance, NYSE:CVNA , carvana, carvanastock, cvnastock, cvna, carvanaearnings, earningsreport, earningsrelease, carvanaearningsreport, carvanatradeidea, carvanapricerange, rangebreakout, rangebreakdown, carvanarange, rangetrading, chartpatterntrading, chartpatterns,

CARVANA $CVNA - Feb. 15th, 2024CARVANA NYSE:CVNA - Feb. 15th, 2024
BUY/LONG ZONE (GREEN): $48.00 - $60.00
DO NOT TRADE/DNT ZONE (WHITE): $40.00 - $48.00
SELL/SHORT ZONE (RED): $25.25 - $40.00
By request. My main focus would be on the range between $40.00 - $48.00, this area has determined the trend five times, which are seen each time price touches and breaks or touches and rejects. Currently I'm looking at a bull trend that was set after a breakout of the range in the $40-$48 zone. Any data before June 2023 I was not considering. If I had to look for an upside target, assuming the trend stays bullish long term once price reaches $60, the next logical point would be $103. Due to the lack of data and because price is trading away from the start of my bullish zone, I personally would not look to enter until there is a reaction to the $60 area or a pullback to the $48/$49 zone.

How to trade CarvanaCVNA, now at 80.7 on MArc-15-2024 :
Per EW, this is in wave4 of wave5 uptrend
Buy few at cmp,
Buy few if this falls to 65,52
Uptrend confirmation at 90.34
Tehreafter levels to watch --> 102.07, 109.32, 115.2, 121
Expected gains from cmp --> 50%

Carvana's Journey Through Shifting Economic Tides Carvana Co.( NYSE:CVNA ) stands as a testament to resilience and adaptation. As the online car retail giant braces for lower interest rates amid tightening lending standards, it navigates through challenges with strategic maneuvers and a steadfast commitment to its vision.
In a recent interview with Bloomberg News, Carvana's Chief Financial Officer, Mark Jenkins, shed light on the company's proactive measures in response to escalating delinquency rates across the industry. Recognizing the pressing need for prudence, Carvana ( NYSE:CVNA ) has implemented higher down payment requirements and capped maximum payments, signaling a shift towards a more selective approach in extending credit.
The decision to tighten lending standards comes at a critical juncture for Carvana ( NYSE:CVNA ), which, like many others, has witnessed a surge in delinquencies amidst the backdrop of rising used-vehicle prices and interest rates. However, these challenges haven't deterred Carvana's pursuit of innovation and growth.
Founded in 2012, Carvana ( NYSE:CVNA ) initially garnered attention for its innovative approach to online car sales, epitomized by its iconic vending-machine towers. Yet, as the pandemic reshaped consumer behavior and economic dynamics shifted, Carvana ( NYSE:CVNA ) faced headwinds, reflected in a significant decline in the wealth of its founders, Ernie Garcia II and Ernie Garcia III.
Despite these setbacks, Carvana's ( NYSE:CVNA ) recent financial performance showcases resilience and potential. With a reported net income of $150 million for 2023, coupled with a total revenue of $10.8 billion, the company demonstrates an ability to adapt and thrive in challenging environments. Notably, a strategic restructuring initiative resulted in a one-time gain of $878 million, underscoring the company's commitment to financial health.
Wall Street's optimism towards Carvana ( NYSE:CVNA ) is palpable, evidenced by a 43% surge in stock value within the first two months of the year. Furthermore, robust gross profit margins and prudent expense management paint a picture of operational efficiency and sustainability.
Looking ahead, Carvana ( NYSE:CVNA ) remains poised for growth, buoyed by expectations of lower interest rates and an optimistic outlook for the automotive market. With forecasts projecting adjusted earnings before interest, tax, depreciation, and amortization to surpass $100 million in the first quarter of 2024, Carvana ( NYSE:CVNA ) is positioned for continued success.
Moreover, the company's strategic hiring initiatives, coupled with expansion plans for its vending machine network, underscore a commitment to operational excellence and customer-centricity.
However, challenges persist, particularly concerning the company's debt burden. Despite a successful restructuring effort, Carvana ( NYSE:CVNA ) faces scrutiny regarding its leveraged business model and reliance on securitized consumer loans. Analysts warn of potential risks associated with loan securitizations, highlighting the need for a cautious approach to balance sheet management.
In conclusion, Carvana's ( NYSE:CVNA ) journey reflects the resilience and adaptability inherent in successful enterprises. As it navigates through turbulent economic waters, the company's commitment to innovation, prudent financial management, and customer satisfaction serves as a beacon of hope amidst uncertainty, reaffirming its status as a pioneer in the automotive industry's digital transformation.

CVNA- consolidation after the earnings gap higher LONGCVA on the 30-minute chart shows a high tight flag pattern after the big report of profit
on an annual report. Inflation is affecting auto stocks and recession is increasing the
number of used care purchases while inflation hangs in there. URLs for both a description
of the pattern and the news are embedded in the drawing. The RSI indicator shows a quick
move of the faster RSI line over the slower RSI line. The pattern is typically said to forecast
bullish continuation out of the consolidation. I will get shares at fair value in the consolidation
and follow price for signs of that continuation. Another observation of the consolidation
is the price getting above the third upper VWAP bandline then settling down onto the
support of the first upper line. I look to target 78 from an entry of 68 for a 15-18% upside
with risk constrained by the earnings report and current relative trading volume.
