Daily Checklist Before The Market Opens | Sep-15 2021Hello and thank you if you are a regular reader 🖖 Welcome if you are new to my daily publication... 👍
Publishing this post on a daily basis helps me avoid distractions and sets my focus to be fully in line with the now in the marketplace.
Knowing you read me keeps me accountable and forces me to be objective in my analysis which helps with my own trading emotions and temptations 😉
This selfish moment may also serve you well 😁 as my findings may guide you into understanding the markets better, or may simply act as a second opinion after you have performed your own analysis 👏
The rationale of my analysis is detailed on the chart itself so you don't need to look up and down.
Below you will simply find the results of my process applied to other four relevant markets I always check before I trade.
Trade well!
OIL: NYMEX:CL1!
1️⃣Market CLIMATE
🎯Current: UP
🎯Confirmed: YES
🎯Stats: 3 out of 6.55
2️⃣Buy and Sell UFOs
🛸Sell UFOs: 74.23-72.93
🛸Buy UFOs: 60.77-58.73
3️⃣Options IV: 33.63%
🚀Daily Expected Move: ±1.52
🚀Weekly Expected Move: ±3.34
🚀Monthly Expected Move: ±6.94
GOLD: COMEX:GC1!
1️⃣Market CLIMATE
🎯Current: UP
🎯Confirmed: NO
🎯Stats: 1 out of 6.15
2️⃣Buy and Sell UFOs
🛸Sell UFOs: 1866.0-1804.4
🛸Buy UFOs: 1759.6-1742.6
3️⃣Options IV: 15.02%
🚀Daily Expected Move: ±17.06
🚀Weekly Expected Move: ±37.56
🚀Monthly Expected Move: ±78.19
DOLLAR: ICEUS:DX1!
1️⃣Market CLIMATE
🎯Current: UP
🎯Confirmed: NO
🎯Stats: 3 out of 4.83
2️⃣Buy and Sell UFOs
🛸Sell UFOs: 93.750-93.455
🛸Buy UFOs: 92.310-91.800
3️⃣Options IV: 5.12%
🚀Daily Expected Move: ±0.30
🚀Weekly Expected Move: ±0.66
🚀Monthly Expected Move: ±1.37
BITCOIN: ICEUS:BTM1!
1️⃣Market CLIMATE
🎯Current: UP
🎯Confirmed: NO
🎯Stats: 1 out of -
2️⃣Buy and Sell UFOs
🛸Sell UFOs: 57975.0-54500.0
🛸Buy UFOs: 41460.0-47437.5
3️⃣Options IV: 92.43%
🚀Daily Expected Move: ±2750.42
🚀Weekly Expected Move: ±6054.78
🚀Monthly Expected Move: ±12604.02
I believe now you know why UFO and 3D are part of my name…
Feel free to private-message me and share more about your trading style if you are too attracted by those UFOs 💪
*This daily post is not intended to be used as financial advice
Cycle

Daily Checklist Before The Market Opens | Sep-14 2021Hello and thank you if you are a regular reader 🖖 Welcome if you are new to my daily publication... 👍
Publishing this post on a daily basis helps me avoid distractions and sets my focus to be fully in line with the now in the marketplace.
Knowing you read me keeps me accountable and forces me to be objective in my analysis which helps with my own trading emotions and temptations 😉
This selfish moment may also serve you well 😁 as my findings may guide you into understanding the markets better, or may simply act as a second opinion after you have performed your own analysis 👏
The rationale of my analysis is detailed on the chart itself so you don't need to look up and down.
Below you will simply find the results of my process applied to other four relevant markets I always check before I trade.
Trade well!
OIL: NYMEX:CL1!
1️⃣Market CLIMATE
🎯Current: UP
🎯Confirmed: NO
🎯Stats: 2 out of 6.56
2️⃣Buy and Sell UFOs
🛸Sell UFOs: 74.23-72.93
🛸Buy UFOs: 60.77-58.73
3️⃣Options IV: 32.74%
🚀Daily Expected Move: ±1.46
🚀Weekly Expected Move: ±3.22
🚀Monthly Expected Move: ±6.71
GOLD: COMEX:GC1!
1️⃣Market CLIMATE
🎯Current: DOWN
🎯Confirmed: YES
🎯Stats: 5 out of 6.23
2️⃣Buy and Sell UFOs
🛸Sell UFOs: 1866.0-1804.4
🛸Buy UFOs: 1759.6-1742.6
3️⃣Options IV: 15.09%
🚀Daily Expected Move: ±17.00
🚀Weekly Expected Move: ±37.41
🚀Monthly Expected Move: ±77.88
DOLLAR: ICEUS:DX1!
1️⃣Market CLIMATE
🎯Current: UP
🎯Confirmed: YES
🎯Stats: 2 out of 4.83
2️⃣Buy and Sell UFOs
🛸Sell UFOs: 93.750-93.455
🛸Buy UFOs: 92.310-91.800
3️⃣Options IV: 5.16%
🚀Daily Expected Move: ±0.30
🚀Weekly Expected Move: ±0.66
🚀Monthly Expected Move: ±1.38
BITCOIN: ICEUS:BTM1!
1️⃣Market CLIMATE
🎯Current: DOWN
🎯Confirmed: YES
🎯Stats: 5 out of -
2️⃣Buy and Sell UFOs
🛸Sell UFOs: 57975.0-54500.0
🛸Buy UFOs: 41460.0-47437.5
3️⃣Options IV: 92.55%
🚀Daily Expected Move: ±2688.84
🚀Weekly Expected Move: ±5919.21
🚀Monthly Expected Move: ±12321.83
I believe now you know why UFO and 3D are part of my name…
Feel free to private-message me and share more about your trading style if you are too attracted by those UFOs 💪
*This daily post is not intended to be used as financial advice

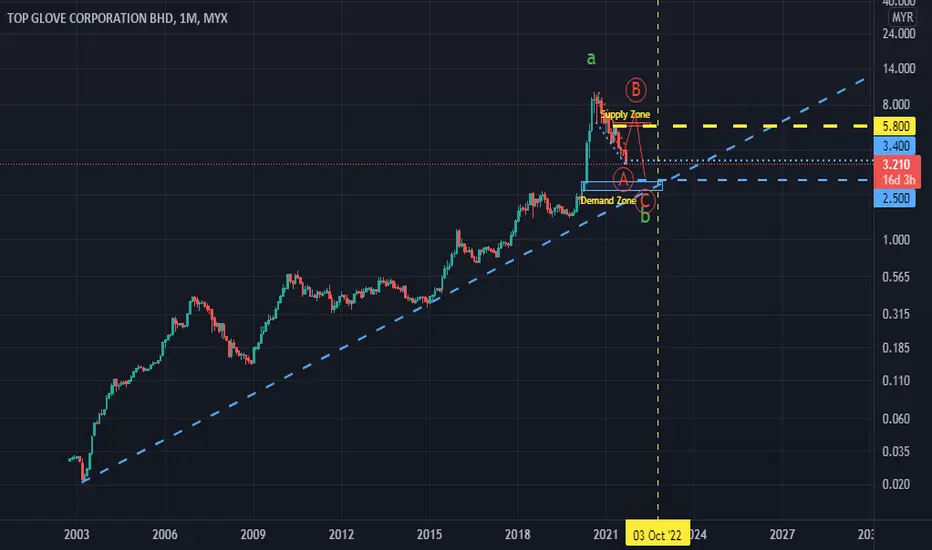
TOPGLOV May Drop to 2.50. BUT 5.80 First. 14/9/21TOPGLOV Stock price may drop until around RM2.50 where there is a confluence zone of 1) Major Monthly Demand Zone 2) A Long Term Up Trend Line Support ( Cyan/Light Blue Dashed Line) ..BUT... Price most likely will complete wave A (Red Circled) at around RM3.20 AND start trending up for wave B (Red Circled) till around RM5.80 where is confluence zone of 1) Next Major Supply Zone 2) Fibonacci 38.2% downtrend pullback from history high
Daily Checklist Before The Market Opens | Sep-13 2021Hello and thank you if you are a regular reader 🖖 Welcome if you are new to my daily publication... 👍
Publishing this post on a daily basis helps me avoid distractions and sets my focus to be fully in line with the now in the marketplace.
Knowing you read me keeps me accountable and forces me to be objective in my analysis which helps with my own trading emotions and temptations 😉
This selfish moment may also serve you well 😁 as my findings may guide you into understanding the markets better, or may simply act as a second opinion after you have performed your own analysis 👏
The rationale of my analysis is detailed on the chart itself so you don't need to look up and down.
Below you will simply find the results of my process applied to other four relevant markets I always check before I trade.
Trade well!
OIL: NYMEX:CL1!
1️⃣Market CLIMATE
🎯Current: UP
🎯Confirmed: NO
🎯Stats: 1 out of 6.58
2️⃣Buy and Sell UFOs
🛸Sell UFOs: 74.23-72.93
🛸Buy UFOs: 60.77-58.73
3️⃣Options IV: 33.54%
🚀Daily Expected Move: ±1.49
🚀Weekly Expected Move: ±3.28
🚀Monthly Expected Move: ±6.83
GOLD: COMEX:GC1!
1️⃣Market CLIMATE
🎯Current: DOWN
🎯Confirmed: YES
🎯Stats: 4 out of 6.23
2️⃣Buy and Sell UFOs
🛸Sell UFOs: 1866.0-1804.4
🛸Buy UFOs: 1759.6-1742.6
3️⃣Options IV: 15.15%
🚀Daily Expected Move: ±17.10
🚀Weekly Expected Move: ±37.63
🚀Monthly Expected Move: ±78.34
DOLLAR: ICEUS:DX1!
1️⃣Market CLIMATE
🎯Current: UP
🎯Confirmed: YES
🎯Stats: 1 out of 4.83
2️⃣Buy and Sell UFOs
🛸Sell UFOs: 93.750-93.455
🛸Buy UFOs: 92.310-91.800
3️⃣Options IV: 5.11%
🚀Daily Expected Move: ±0.30
🚀Weekly Expected Move: ±0.66
🚀Monthly Expected Move: ±1.37
BITCOIN: ICEUS:BTM1!
1️⃣Market CLIMATE
🎯Current: DOWN
🎯Confirmed: YES
🎯Stats: 4 out of -
2️⃣Buy and Sell UFOs
🛸Sell UFOs: 57975.0-54500.0
🛸Buy UFOs: 41460.0-47437.5
3️⃣Options IV: 92.01%
🚀Daily Expected Move: ±2579.84
🚀Weekly Expected Move: ±5679.25
🚀Monthly Expected Move: ±11822.30
I believe now you know why UFO and 3D are part of my name…
Feel free to private-message me and share more about your trading style if you are too attracted by those UFOs 💪
*This daily post is not intended to be used as financial advice

GBPJPY FORECAST The par is trading in a descending triangle and the 50-day moving average is capping the buyers, it is important to notice that 50 day ma creates a confluence with a descending trendline, gbpjpy is having a cyclic trend, the bottom should come around 17th of september and I think that price could reach the red support line, stochastic gives us anothere bearish signal, wait for a conformation in h4 and h1 before opening a sell


Previous bull cycle traced over current cycle...Title says it all... I've traced over t he previous cycle over the current cycle as a best fit model... Even though this is looking like it will end up being a double pump similar to the 2013 cycle, I feel that the longer cycles justify using the most recent cycle... Either way, this is an interesting perspective...

BTCUSD Wyckoff Market CycleRight now we retested the distribution zone and not much upside left IMO. The Wyckoff cycle continues and time will tell us more.

Next Cycle Bottom Prediccion Fib Extension measured from top cycle bull run to bottom bear market , both with the 2.618 indicating those levels.

🔥 Bitcoin Realistic Top Prediction For The CycleOnce in a while I like to discover long-term predictions and analyses for the crypto market. For the current analysis I want to look at (logarithmic) Fibonacci extension lines. I found out that the 1.272 and 2.272 extensions are seemingly very important for the last two cycles. The Fibonacci extension is measured from previous cycle top to next cycle bottom.
During every cycle, Bitcoin sees some form of mid-cycle correction towards the 1.272 extension. This Fibonacci extension then functions as a spring to allow the price rise towards the 2.272 extension. The 2.272 extension predicts a remarkable close top of the cycle.
During the second Bitcoin cycle one can clearly see the price rising above the 1.272 extension, re-testing it and continueing the move towards the 2.272 extension, which was also the top for the cycle.
During the last (third) Bitcoin cycle, you can see the same thing happening. Although the retracement to the 1.272 extension was less potent and of a shorter duration, it still functioned as a spring for BTC. After the re-test the price went all the way up to the 2.272, where that area functioned as a clean indication of the top.
This long-term analysis can be used in conjunction with my other long-term analysis (see above). With the current analysis predicting a cycle top around $215k, it would mean that Bitcoin will top somewhere in February 2022. I come by this conclusion by following the blue line in the analysis above and marking the date where it hits ~$215k.
Obviously, this analysis is based on speculation. However, I find the Fibonacci extensions to hold up surprisingly well over the years. Furthermore, it supports my argument that the dip that we saw from May to July was nothing more than a mid-term correction.
Hope you enjoy. Happy trading!

Solana at $550 and $900 by end of 2021 Bull cycleI am using two fractals with price points at $550 and $900 by end of this bull cycle for December 2021/January 2022. Of course, we all know we could go lower or higher. Price depends on the demand for Solana and the high of the Bitcoin peak.

$SPX correction ? From Gann's time cycle analysis, i am forecasting a top around Aug 13 and bottom on Aug 19 (around the 4350 level)
The bottom should touch on the MA100 and backup again.

Bitcoin bullish at daily I believe we bottomed at 30k and this was mid cycle shakeout. At big TF funding is still negative. Last time at this levels we were at 10k and Bitcoin go to 64k in 5 months.


BTC on course with bullcycle (HTF CHART)If we have extending cycles (wich we historically have) there is no reason to think we have already reached the top.
I believe we are at the halfway point, targeting 100k.

XAUUSD Gold: End of the bullish trend ? Updating our XAUUSD Weekly Chart.
Jackson Hole Symposium by The Federal Reserve Bank of Kansas City; Aug. 26-28, can be the place of the FED's first strong sign of a new path.
The location of the key support zone is 1765 - 1750 USD/Ounce.
Weekly closing below 1750 ( and the closing below the red trendline ) will add weight on the ounce.
It is early to take a big short position before closing below 1750 USD/Ounce.
Below 1750; our targets are 1720, 1700 1685, and 1640.
Indicators:
Cycle Sniper
Advanced Chart Patterns Tracker

🔥 Comparing Different Bitcoin Cycles - UpdateA couple of weeks ago I made a long-term analysis on the state of the bull-cycle and the future of it.
There's several very interesting things that one can deduce from this graph.
1) The cycles are getting less intense. The difference between the top and the low is relatively diminishing, making each cycle less explosive than the previous.
2) The cycles are getting longer. With each new cycle, it takes longer to reach the top of the cycle. "Time is your friend" has never been more fitting.
Furthermore, the current bull-cycle was "ahead" (above the previous cycles) of where it should've been and therefore the May correction was neccessary. At this point, we are exactly where we should be in the cycle.
Comparing the growth of previous cycles, we can connect them via the blue line. Assuming the blue line will hold for the current cycle, I'm expecting BTC to top somewhere in the first half of 2022, with the top ranging anywhere between 130k - 200k. This assumes that the growth rate of the current cycle will be less than the previous cycle.
The current BTC break-out could very well be the start of the bull-cycle continuation pattern.
Happy trading!

Litecoin is showing a potential RUN!I am watching LTC here, I like the wave count.
Litecoin has very nice cycles, Kinda like DOGE/BTC but slightly different.
I like cycles, Market cycles, Elliott wave cycles, Planetary cycles, etc.
I think we have more upside for this coin, Major support is quite strong.
Major resistance looks like it can easily be broken.
Stay profitable
- Dalin

GOLD long toward 1870 for wave 1 (yellow), SL @ 1792. 2/8/21GOLD wave 1 (yellow) probably not completed yet As current price possible at wave c (Green Circled) of wave 1 (yellow).. Long Gold at around 1808 at the end of triple zig zag correction (not shown on chart) . Stop Lost at 1792 which is the low of wave (ii)(Red). Target Profit at around 1870..( about 620 pips potential gain) ...


BTC probably --History repeats itself--
Probably the same scenario as 2017/2018 will be repeated
big support 18k ,similar big support 2018 ---3k
The start of cycle will be in 03 or 04/2023
mania phase will be after halving 2024
top cycle 2024 will be 500k to 700k

Bitcoin cycles explained by date ranges and retesting the 1.618
Every bitcoin cycle gets a retest of the previous cycle 1.618 fib extension level from previous bear market low to that cycles bullrun high
The green lines pointing out those are the halving - The bullrun begins
The pink lines pointing the retest of the 1.618 + The start of the next leg up to the high of that bullrun
The red lines are pointing the bullrun highs
Now if you take those dates from previous cycle, i see the possibility of the next leg up to finish this bullrun.
Please let me know what you think of this.

AJ - 4HR - Bearish StructurePrice has been in an overextended cycle to the upside. We are now beginning to see downtrend structure forming on the 4HR Chart, with lower lows and lower highs. Price has bottomed out at the 80 whole level. Will the channel continue to be respected?
