BTC analysis: Why 20k could be the bottom.NFA
NOT FINANCIAL ADVICE.
This is just my personal point of view.
Hello everybody, in this analysis I've chosen to use the basics: Stoch RSI, MACD, RSI... Along with other tools like: Log Fib, Bottom Ind, Etc.
First of all, I'd like to explain what kind of info can be retrieved from this chart. This chart notices about one clear as crystal thing: BTC price tends to go upwards with time, and that price increase tend to desaccelerate with time, also known as diminished returns . Next thing that should be explained is when BTC resumes an uptrend and when it does the opposite. That would be the identification of "cycles". According to popular media, BTC usually increases its price once it's getting closer to its next halvening date and to summarize the theory, BTC has four year cycles as a cyclical asset. My view is that BTC is effectively a cyclical asset where those c ycles are getting extended / longer and that sooner or later, probably by 2024, that extension of cycles won't fit with halvening dates. So what is going on? It' easy to spot that BTC went superbullish from its inception in 2009 to 2011, then crash, then first halvening, then a first "middle cycle peak" by 2013 and after a massive crash a new upward trend pushed the price to a new ATH by early 2014 as a "final cycle peak". Then same history repeated, price went downwards til next halvening which happened in 2016 and a massive bullrun by 2017 which was stopped by some big correction in the summer of that year. Then you got bear period for a year, a great bullrun by early 2019 summer and then our "current cycle" started.
To avoid overextending this, what is my point ? My point is that "mid cycles" doesnt exit. Every main cycle has a bullrun, a bear season, and a resume for another final bullrun; and those trends are getting shorter as you can see in the chart checking the measured time bars. What does this mean for the average guy? Well, it's going to be harder to spot if you are in a bullish or bearish trend, but the good news is that those trend are gonna last a little less than previous ones. Whom benefits this? That's easy. Investors and good traders. Average trader is the only one losing here as he wouldnt know what is going on.
In this main chart, you can see a log BTC/USD view using a tool which has recognized extremely well the bands which BTC has been using consistently as supports and resistances for its entire history. The black lines are the edges between what we should consider the top and bottom. Any candle going higher than the upper black line would be an extraordinary event pushed by extremely welcomed good news. On the other hand, any candle going lower than the lower black line would be an extraordinary event pushed by extremely spurned bad news. To date, upper black line has never been broken. On the other hand, lower black line has been pierced one time before when the uncertainty took the stock market back in March 2020 and after a massive black swan event and consequently crash, the fear spreaded to crypto market. To summarize this, only another black swan event should be able to drop the price below the black line, and in fact that event would happen, there are extra support zones which should stop the crash as it did back in March 2020.
As you can see in this zoomed chart, even if that black swan event would happen this week, price should keep above 12k. And if everything goes well, price should s top crashing around 20k .
s3.amazonaws.com
Weekly Stoch RSI showing up longest downtrend that it has ever experienced. It's worthy of attention to realize about that every time BTC has touched these levels, Stoch RSI has bounced off providing at least a relief rally.
s3.amazonaws.com
Weekly MACD showing up biggest crash ever for MACD levels, hitting lowest point ever for BTC. This metric shows up a possible reversal for the short-term as relief-rally and a feasible macro-trend change for mid-term as most optimistic scenario.
s3.amazonaws.com
Weekly RSI showing up a multiyear weekly rsi support. Any support or resistance drawed line requires at least three pivot points, so there are big chances about RSI could bounce off from that point.
s3.amazonaws.com
Daily RSI showing up a multimonthly daily rsi resistance. As you can see, this chart summarizes pretty well how every pump attempt from previous wave downwards has concluded as a weaker pump than previous one as that is being translated in that RSI trendline which so far has been unbreakeable. Irretrievably, this trendline will get pierced sooner or later as even if the same trading loop keeps happening, the RSI would be pushed every time closer to the bounce-off point edge.
s3.amazonaws.com
Cycle


TESLA probably forming a triangle. 19/July/21TSLA probably forming a triangle in wave 4 (red) as price ranging above 550, which is 1) Demand Zone 2)Daily 200 EMA Lines Support 3) Fibonacci 38.2% Level...

🔥 Comparing Different Bitcoin CyclesWith this analysis I want to shed some light on where we currently are in the fourth Bitcoin bull-cycle, compared to the previous three cycles. I measure the cycle from low after previous cycle to high of the cycle. There are different ways of drawing the cycles (comparing halvings for example), but for me this one makes the most sense.
There's several very interesting things that one can deduce from this graph.
1) The cycles are getting less intense. The difference between the top and the low is relatively diminishing, making each cycle less explosive than the previous.
2) The cycles are getting longer. With each new cycle, it takes longer to reach the top of the cycle. "Time is your friend" has never been more fitting.
When we look at the current cycle we can see a couple of things that are standing out from the other cycles.
1) There's been several occasions where the current cycle "went too fast" comparing to other cycles, after which BTC had to cool off for a couple of months. This has been a major thing with the most recent sell-off from 65k > 30k. BTC was ahead of schedule by a lot, so it had to correct by a lot to get below the previous cycle's growth path.
2) The current cycle is the most volatile one, which is caused by the COVID dump last year and the subsequent massive quantitative easing that followed.
In previous analyses I've mentioned that I think that we're currently in a mid-cycle correction. My arguments for this are that this cycle is too short to be completed. At the very least we "should" have another 8-14 months for the current cycle. Furthermore, the top of the cycle is not even close where it should be, compared to previous cycles.
Looking at the blue trend-line, the top of the cycle should be somewhere from 100k-150k (rough estimate).
To conclude, I'm confident that Bitcoin will see another strong bullish push. The current cycle is far from over.
Happy trading!

Lumber -55% Since Call For A Cycle Top, Now Negative On The YearLumber now negative on the year. I called for a cycle top and reversal for the week of May 3-7. Top was put in on May 10th.

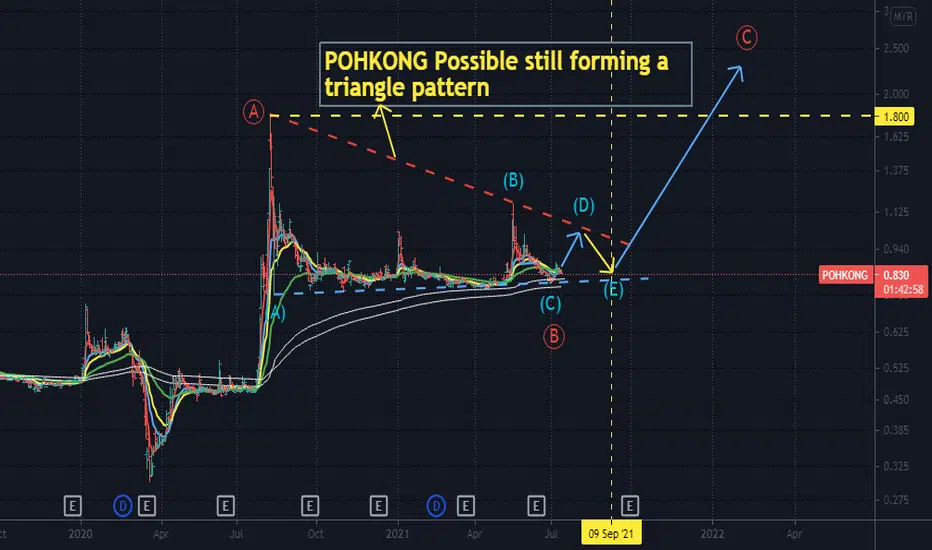
POHKONG possible still forming a triangle. 12/july/21POHKONG price still in ranging while having possibility forming a triangle pattern.
Pi Cycle Indicator says Bull Run is OverTraditionally used to time the top of market cycles, the Pi Cycle indicates that winter may be here to stay.
Idea inspired by: radamesmatos

Gold - Bull CycleGood evening ladies & gents,
Gold just displaced down nicely into my Buy Zone, triggering my pending Buy Limit.
Risk on this position is 1%, looking to swing it back to the Monthly Highs with additional points to add on from next week ideally.
Tomorrow is NFP, so be mindful that it can get pretty shakey.
Let's see how tomorrow pans out and it'll determine the trajectory of Gold from the next week onwards.
- AmplaFX

GBPAUD | Expect it Shortly with A stop huntGBPAUD expected move shortly after this Distribution
Please note that stop hunt will very likely occur... Entry upon confirmation and rejection
Thxxx

Bitcoin road to 200kI think this is one of the possible scenarios for bitcoin this cycle. I am not saying is going to happen exactly like this, but i think can be so similar. I think we bottomed and now we can reach $100k in next months before next big correction where everyone will think again "this cycle is end" before really big moves, mania phase and euphoria.

CHF/JPY - Lovely Downside PotentialWe've seen a pullback, lower high formed and more downside over the last couple of days. We're riding price down, long term targets around 117.80
Technically wise, we have seen a break from ascending structure, overextended bullish cycle, hawkish JPY outlook, price retraced to test trendline and key level in the market.

GOLD. Why Price still Ping Ponging?..24/6/21It Seem price of gold in consolidation without clear direction. Probably its price "refuse" to move up while waiting its down trend's "friend" moving down just to say "Hi ! And Kiss Good Bye....Before moving down to around 1730...

Bitcoin 24K Scenario - For bleed out Altcoins ReasonBig players shake-out small investors during this bloody shake-out. Reason is small investors still focus on altcoins which is not a recommended touch right now in my opinion. Wanna stay in the market - hold bitcoin. Wanna trade altcoins. Only for initial bounce, than take a profits back in BTC. Can't be hold altcoin more than one explosive wave.

YBS riding the minor trend on daily charta simple cycle analysis on daily chart of minor trend taken from peak and trough of the market.

KLCI Future Index possible Deep Correction as US Index. 21/6/21As "They" Said When US Future up, KLCI won't always follow.. BUT When US Future "drowning...."... KLCI will sing...l " I will follow You.....".. Maybe KLCI Next Major Support Could be around 1400

BTC /M3 CycleThis chart shows the strength of bitcoin in correlation with money printing and the strength of the dollar itself in the DXY index
I have come to the conclusion that the cycles and most importantly the current cycle of BTC can repeat the situations of 2017 with the help of the increase in the purchasing power of the dollar (DXY) while burning the dollar stock in its digital edition (Tether, BinanceUSD etc.)
More in part two.

GOLD intraday outlook dated 18 June. 2021GOLD. Short for last leg down for wave iii (green circled).. Stop Lost at 1791, Target Profit at around 1755

GOLD Alt View. Waiting for Long Setup ≈ 1780. 17/6/21GOLD ALt. View.. It's possible we are now at wave iii (green circled ) of wave C ( Yellow).. Waiting For Long Setup at around 1780 OR .. Waiting for Short Setup at around 1850...

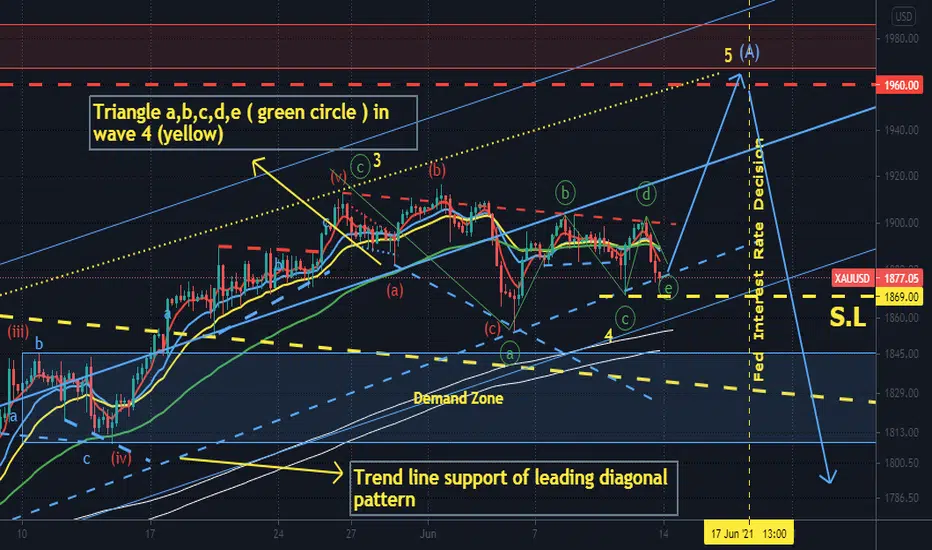
GOLD. We probably @ wave e of triangle now. 13 June 21GOLD price seem like at wave e (green circled) of triangle now, long with Stop lost at 1869, Target profit at around 1960..
BTC Bitcoin Cycle Top Prediction 2022This is my chart prediction of the Cycle top. Time will tell.......

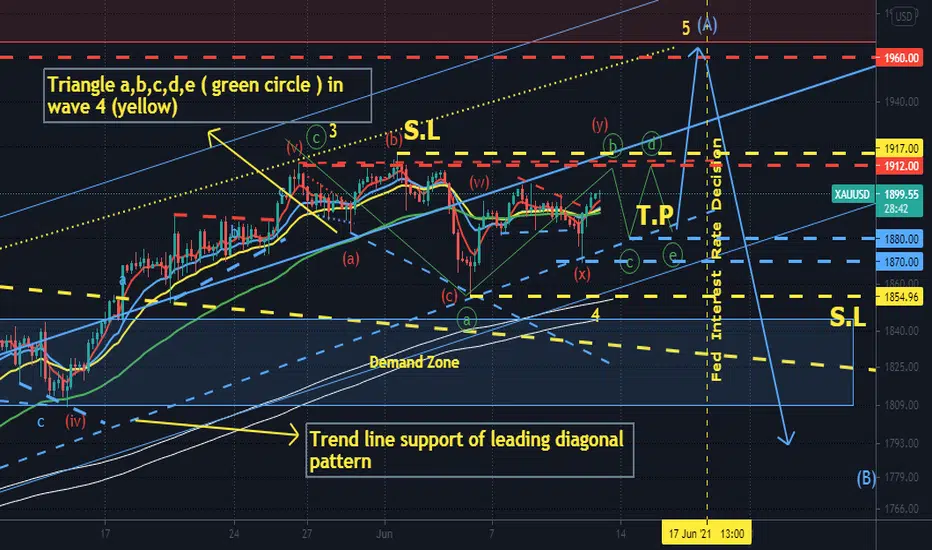
GOLD still ranging in triangle. 11 June 21GOLD. Short at around 1912 for wave e (green circled), Stop Lost at 1917, Target Profit at around 1880.. OR....Buy Limit at around 1880, Stop Lost at 1868.. Target at around 1960..
How to detect the active cycle length?This is a short tutorial on how to use the Detrended Rhythm Oscillator (DRO) to identify the current dominant cycle. The Detrended Rhythm Oscillator is an advanced Detrended Price Oscillator DPO which helps to spot the key market rhythm or beat for any symbol on any timeframe.
It automatically labels the length of current market high-high and low-low pivots which helps to see cycle harmonics and relations. The output should be used as input setting for almost all technical indicators which require and "length" settings for the calculation. Using this length setting based on the dominant market rhythm will help to ensure better accuracy to your indicators at turning points. The indicators get synced to the beat of the market.
The indicator is available as Public Open Source Script for your own usage:

Gold. Leading Diagonal maybe not completed yet. 9 June 21Gold possible still forming its leading diagonal pattern. Currently in wave 4 (yellow) ( possible any type of bullish triangle pattern )..Price could hold above 1850, the next support could be around 1870.. before ending its leading diagonal at around 1960...
