USDCAD Market CycleHere is a cycle that is about to be completed on the USDCAD M30. Follow it with keen interest
Cycle


GOLD short for for wave A (yellow) of expanding flat. 3 June 21Gold , short for wave A (yellow) of the expanding flat. Stop Lost at today ( 3 June 2021 ) high 1910... Target Profit around 1950-1940 ( where there are the "zone" for demand /4 hours 200ema/ daily uptrend line and pullback area for monthly down trend breakout) untill next Monday after this coming Friday NFP..

The Bitcoin Cycle & Long Term TrendThe Bitcoin cycle is divided into three stages; a bull market, a bear market, and an accumulation period. Every 4 years, a new cycle begins when the (BTC) rewards for miners (those who verify transactions by unlocking new blocks) are cut in half, hence unleashing a supply shock in the face of rising demand that jump starts a bull market, historically speaking. So far, Bitcoin has experienced three halvings:
• 30th November 2012
• 9th July 2016
• 11th May 2020
According to the trend, the length of bull markets have increased whilst the length of bear markets have gradually decreased. Bear markets tend to last for over a year after a blow-off bull market top, after which a period of sideways consolidation begins - an accumulation period that is most optimal for investors to dollar cost average (DCA) into the market, in anticipation of an upcoming bull run.
With regards to the 2021 bull market, a blow-off bull market top can be predicted to occur some time between December 2021 and March 2022, taking into consideration the 4 year cycle trend, as well as the lengthening cycles trend. Major mid bull run corrections have also been a key observation in every bull market including the current one, which has shaken off hundreds of billions of dollars in market value, arising fears of a potential bear market. The upcoming bear market could be predicted to bottom at around $45,000-$60,000, according to long term trend lines.

Crude Oil. Watch out 76.875 price level.. 30 May 21We are at the "critical level" of oil price.. The final battle field of bull and bear will be at 76.875 ..whether the cause and effect of "inflation" by "increasing" or "manipulated" increased Crude Oil Price just to "cope" "temporary" with the "depreciation" of $ after "half" Post pandemic

GOLD short term waves outlook 28 May 2021Gold seem forming a leading diagonal/ wedge pattern in wave a (green circle).. Waiting for sell @ wave b (green circle) at around 1903, Sl at 1913, Tp @ around 1870 which are the confluence area of pitchfork median line and demand zone

GOLD maybe an expanding flat pattern on wave (B)(cyan). 28/5/21GOLD possible is forming an expanding flat pattern on wave (B)(Cyan/light blue).. Maybe now we are at wave A (yellow) first leg down of the expanding flat pattern, where price could reach @ around 1845 ( which is support/resistance flip zone and the long term down trend lines breakout zone becoming support area ) .before resuming its uptrend @ around 1950 (major supply & Resistance zone ) for wave B (yellow) and finally last leg down for wave C (yellow) @ around 1780 which is daily 200 EMA deviation and demand zone..
xyz3dtrading

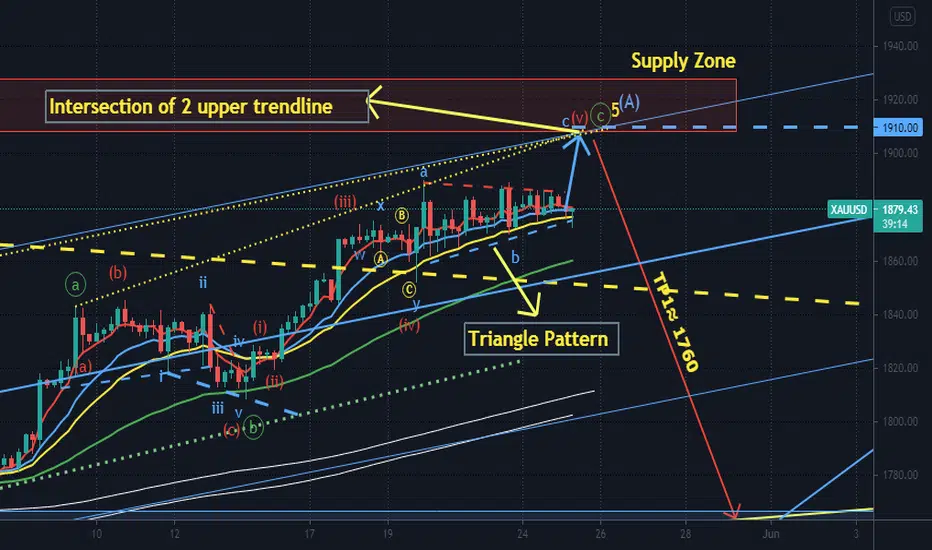
GOLD may completed leading diagonal pattern. 27/5/21Gold may completed its leading diagonal pattern. Price have reached the confluence area ( 2 Upper trend line of leading diagonal met with pitchfork parallel line PLUS the supply zone ).... Short at around 1902, TP1 @ around 1760. Stop lost at 1913..
xyz3dtrading

EURUSD we maybe in wave B (yellow) of triangle. 25/5/21EURUSD possible forming "any form" of triangle pattern in wave (4)(cyan/light blue)...Short for wave C (yellow) of triangle wave (4)(cyan/light blue), Stop Lost at 1.2350, Tp at around 1.1800.. P/s There is ONLY a,b,c sub waves inside any 1,3,5 impulsive wave

Gold. Updated with adjustment on shorterm wave counts. 25/5/21P/s There is only a-b-c sub waves in any impulsive 1,3,5 waves..Target wave (A) (cyan/light blue) for Gold still @ around 1905-1910.
$BTC Elliot Wave Theory, Wave 4Elliot Wave Theory - Looking at higher lows down to Wave 4, finishing up in Summer 2022, then running up to $85-100k ATH for Wave 5. If we assume an ascending channel from the 2017 and 2021 all time highs, we can see the elliot wave locations at the bottom and tops of the channel.

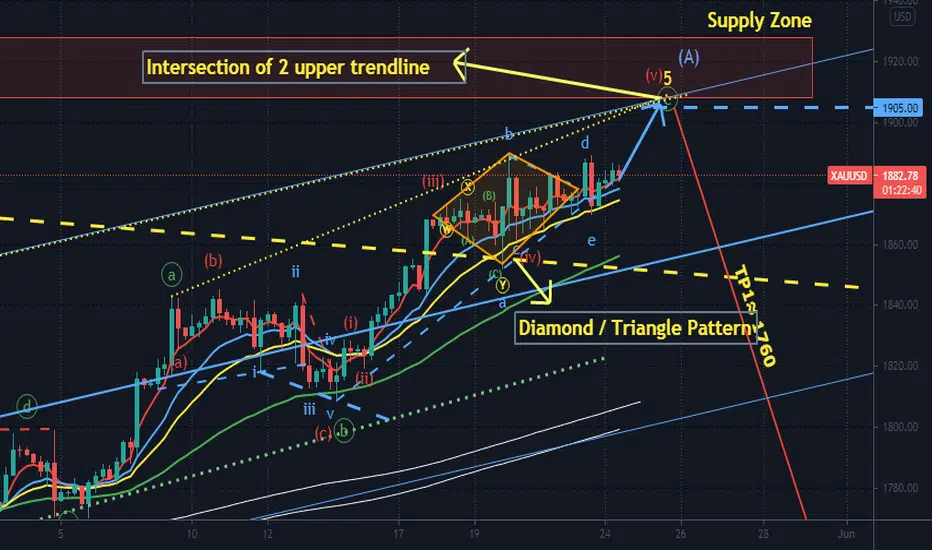
Gold. A bit "tricky" on the triangle/diamond pattern. 24 May 21Gold. with clearest pic now on its " triangle or diamond pattern now".Gold..still possible to resuming its uptrend till around 1905-1910.. Where two upper trend line "meet up" with supply zone.
SPX short for wave (E) (cyan) of expanding triangle. 24 May 21SPX Beside having possibility forming expanding wave (E) (Cyan)(light blue)... SPX On Lower Time Frame Chart .. E.g: 1hour/4 hours might form a Head and Shoulder pattern. Short SPX.. Stop Lost @ 4546, TP @ around 2000...

SP500 medium term outlook. Updated 24 May 21SPX possible is forming Expanding Triangle on wave 4 (red circled).. Currently Price seem stalling around the upper trend line ( yellow dotted line)...

Moon cycles vs BTC trendsDo you also see the cyclicality of BTC against the background of the phases of the moon?

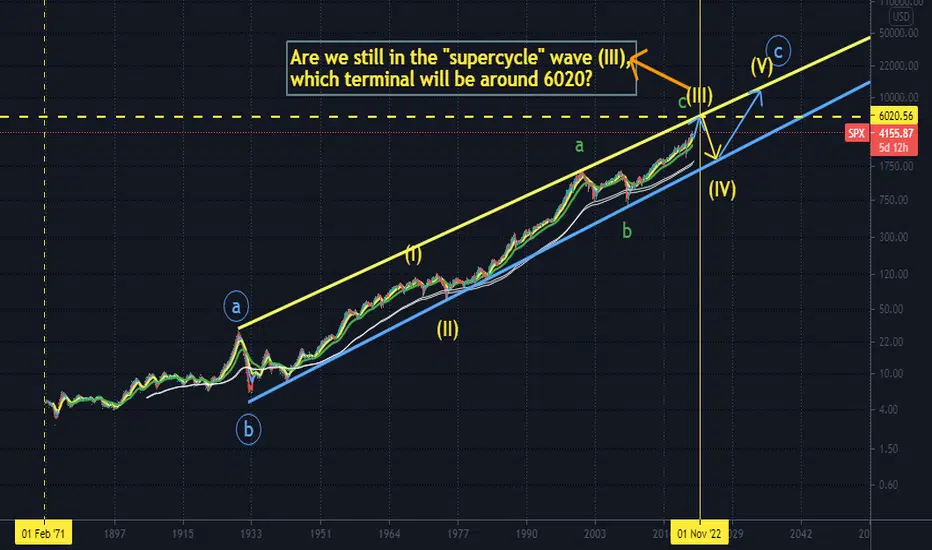
SPX The Biggest Pic Since year ≈1872. Updated 23 May 21Price of SPX still trending within the Long Term Up Channel AND...Price Might "touch" its upper channel @ around 6020 @ around late 2022..
[Gann Theory]There be any cycle in the stock market? Absolutely, the answer is yes, but we can't apply a simple and fixed model to all stock markets. Each stock market is an independent viberation with its own cycle and development laws. Therefore, the cycle and law of the stock market will be introduced before presenting the text of this book.
Since the 1900's, economists in western countries have engaged in the study the law of the cycle, and all believed that there was a long-term law in the economic growth or recession. There is noting new thing under the sun.
In 1930, the American economist S. Kuznets proposed a business cycle applying to housing construction, with an average length of 20 years. This long-term cycle is known as the "Kuznets" cycle, or building cycle. C Juglar, a French economist, published his Business Crisis and Cycle in France, Britain and the United States in 1862. In this book, he pointed out that the capitalist economy fluctuated every nine to ten years, as generally called "Juglar cycle". Joseph Schumpeter took this as the "medium-term cycle", or the "Juglar cycle".
Edward R. Deway, known as the father of cycle analysis, believed that the most statistically reliable cycles were 9.2 years and 3.83 years. He was also the founder of many institutions studying the cycles. Edward R. Dewey (1895-1978) dedicated his life to study the cycles (not limited to the business cycle) and in 1931, he was appointed as the Chief Economic Analyst by the U.S. Department of Commerce. Trying to find the cause of the Great Depression in 1929 and 1930 in the United States, Edward R. Dewey established the Foundation for the Study of Cycles in Pittsburgh in 1940. The following are some graphs about the cycles proposed by Edward.
Business cycles can be categorized into long-term, medium-term and short-term ones. You may ask, is there any business cycle in the stock market or the economy? Let's begin with the stock market cycle and then we will talk about the real estate cycle.
The 30-year cycle is one of the cores of Gann's cycle theory. When making a prediction, the 30-year cycle can be divided in further, including the following different cycles.
• 30-year cycle
• 22.5-year cycle - (360 X6/8)
• 15-year cycle - (360X4/8)
• 10-year cycle - (360X1/3)
• 7.5-year cycle - (360X2/8)
If this 30-year cycle is applied to calculate the stock market cycle, you will get an amazing discovery. For example, Hong Kong's stock market crash in 1987 followed with another one 7.5 years later, namely in 1994, because of the upsurge of red chip speculation by foreign investors in 1993 and the United States' increase of the interest rates for 7 successive times. 15 years later, around the year of 2002 and 2003, the stock market underwent a huge decline because of the outbreak of avian influenza. In 2009, namely 22.5 years after that, HSI hit the bottom as a consequence of the financial tsunami. When it came to 2017, exactly 30 years later, HSI witnessed a depreciation in 2018 after experiencing the bull market.
When the 30-year cycle is applied to Shanghai securities composite index, there will also come something incredible. As shown in the chart below, the first peak after the establishment of Shanghai Stock Exchange occurred in May 1992. Following Gann's 30-year cycle, another peak appeared in the half of 1999, exactly 7.5 years later. 15 years later, the year of 2007 witnessed the climax of the bull market. After 22.5 years, the year of 2014 marked the starting point of the bull market in 2015. It is thought that the year of 2022, 30 years later, will be another high or low point.
Just as the old chinese sayings go that "both people and things undergo great changes in a decade", "gold may become worthless in a decade" and "we cannot predict what will happen in a decade and don't laugh at poor people wearing rags". These sayings point out the essence of the 10-year cycle. Juglar proposed that there was a 9 to 10 years' cyclical fluctuation for the market economy in his book Business Crisis and Cycle in France, Britain and the United States in 1862. In Business Prophecies of the Future Ups and Downs in Prices, Samuel T Benner stated that the highest point of trade price followed a repeated 8-9-10-year pattern. The 10-year cycle also plays an important role in Gann Theory.
ericresearch.org
Shanghai Securities Composite Index with a Cycle of 120 Months
Take Shanghai securities composite index as an example. After reaching a low point of 998 in 2005, the high point of the bull market appeared in 2015, 120 months (ten years) later. After the low point of 1,664 in October 2008, another lowest point came in 2018, 121 months later.
Shanghai Securities Composite Index with a Cycle of 52 Weeks
The above chart shows that the Shanghai securities composite index also subjects itself to a 52-week cycle. In the weekly column chart of the Shanghai securities composite index, the time interval between the peak in October 2007 and the low point is 52 weeks. After that, there will be return in every 52 weeks, either the peak or the bottoming out of the market index.
Let's see the weekly column chart of the Shanghai securities composite index and take "7" weeks as a cycle. It is found that from the high point of 2015, there is a relative turn in a cycle of 7 weeks or its multiples, namely 14, 21, 28, 35, 42, 49, 56, 63 and 70.
Is this a coincidence or an accident for the above change in the stock market?
Now, one question. Whether the movement in the stock market is driven by events or the high and low points at the previous time point (cycle)? Therefore, China's stock market proceeds in a cyclical way. The turning point can be predicted as long as the right starting point can be realized.
There is also a cycle for real estate. Although economists all over the world hold different opinions towards the research of the real estate market, but they serve the same effect. I will state the opinions of the following economists for your reference.
·Michael Hoyt, the author of One Hundred Years of Land Values in Chicago, studied the price of real estate in Chicago in a time period of 103 years since there were only dozens of wooden houses, and he found that its price cycles about every 18 years.
·Edward R. Deway, known as the father of cycle analysis, believed that each real estate cycle lasts for about 18 years.
·Fred Harrison, a British economist studying the real estate market in the Britain and United States in the past 200-plus years, found that the housing price cycled about every 18 years.
·Simon Smith Kuznets believed that the building cycle is 15 to 20 years.
It is coincidentally acknowledged that the real estate market cycles every 18 to 20 years. Starting from 1965, it is generally believed that the real estate market in Hong Kong has gone through three major cycles, the first cycle from 1965 to 1981; the second one from 1981 to 1997; and the third one from 1997 to now. The housing price often goes up or down along with the change of both internal and external elements.
I have mentioned the Hong Kong real estate market cycle in different situations. It is not difficult to draw a conclusion from the cycle of Hong Kong's real estate market that the cycle works every six years. Since 1997, great changes occur every six years, including 2003, 2009, 2015, and 2021. With Gann's 50% segmentation method, we can get that three years constitute a secondary cycle, namely in 2000, 2006, 2012, and 2018.
The change of the real estate market can also be concluded with the 18-year cycle, which has worked since 1985. Undoubtedly, the real estate market in Hong Kong goes up after experiencing the lowest point in 2003. Predicably, that the year of 2021 is likely to witness the completion of an 18-year cycle. Stepping back again, the rise of the real estate market in 2003 can be explained with the 6-year cycle mentioned above since the signing of the Sino-British Joint Declaration in 1985.
It is likely that the upsurge of Hong Kong's real estate market will end in 2021, and then we should turn to the turning point that may appear from 2023 to 2024.
Youtube: www.youtube.com
Book: www.amazon.com

Gold's leading diagonal pattern "maybe" formed. 22 May 21Gold price "may" completed its leading diagonal pattern. SL @ 1890, T.P 1 @ around 1760 ( where the neck line of reverse head & shoulder and next major demand zone meet).. T.P 2 will be around 1725 ( the intersection of weekly trend line AND the handle bottom line of the monthly cup & handle pattern )

Bitcoin: A realistic scenario.So, here we are, after 4 months, bitcoin is back on the 30k area, but this time it's not after a 10x bull movement, but after a 50% correction. So the question we all thought about was:
Is this scary?
Short answer: No.
I expect this cycle to choose between 2 posibilities.
1. We hit 300k in this year (IMO the least likely scenario).
2. We hit 100k in Q4 2021 - Q1 2022.
Why i think this cycle will last longer? Im not the first to say this, but if you look at the past, bitcoin cycles tend to be longer than past cycles. Following this theory, (which so far has not been proven wrong at least), i expect actual bitcoin price to be a consolidation phase, maybe even a few months. Key months i should say, as we were going too fast, and so far we had not seen any major correction since the cycle started. Corrections are necessary, healthy, and nothing to worry about. If you are scared about a correction, take a step back and look at the big picture.
I strongly don't believe we are experiencing the start of a bear market, and i dont expect 65k to be the cycle top.
Last 50% correction happened in march 2020, and it was followed by a 2000% run. So i have my head clear, and take this scenario like a challenge. It's HODL or death at this point.
TECHNICAL ANALYSIS:
As it's clear in the graphic, the RSI last few months showed a bearish divergence (higher prices with lower strenght each time). The price showed a lot of respect to this divergence, as it hasn't been broke yet. In my opinion, we will test it again, maybe soon (300k this year) or after a few months of consolidation (100k this year), the later the most chances of breaking it we have.
So, time is on our side .
If we test it and got rejected (most likely to happen if we test it soon) i expect a fall back to the 30k area (25k zone like the worst scenario).
Im not financial advisor, but IMO selling now is a bad choice. I will hold and buy more if price goes lower.
Have a good day and let me know your thoughts.

Gold - "Like Diamond in The Sky" -Rihanna. Updated 21 May 21Gold is forming a "bullish diamond / triangle " pattern. SL @ 1852, Tp @ 1905, A risk : reward of about 0.75 : 1 ( not good )( min 1 : 3)


NZDCHF H1 Trade CycleHere is a quick Market Cycle formation on NZDCHF H1. Have any question, drop your comment.

The case of the 1.7 trillion mk XRPFirst of all you will say that this one is unreal, there is no chance for this to happen. Yes, chances are low but its not impossible. I am not sure if you where at the floor when BTC crashed and XRP made some huge gains in a couple of days. So did BCH as well, and the news were full with headlines like "BCH will takes the first place from BTC because its much better" Everyone jumped into buying then the whole crypto market just crashed! General trading rules says: Buy low sell high, buy undervalued assets sell overvalued assets. Think about it, if you ask any crypto evangelists they will say XRP is shit, its not a crypto so on. Then they will enter the market when they see the price mooning and they will start to FOMO. It's all about pshychology. This thing to happen requires a lot of money. We had nearly trillion dollars on the market when we peaked few weeks ago. Half of it can make Ripple as a specex rocket if large speculators will make this huge move. I am not saying that it will happen, but daydreaming is not illegal. Nobody though that BTC will crash to 30k, exepct few one. Think about it! Have a great weekend you all!
Join our community until its free! (But it's not mandatory!)
community.protradersnetwork.com
