Gold might still inside Big Bermuda Triangle 12-03-2021Referring To Time "Duration Spent " on The Cup, The Handle of The Cup Might Take Few years ( 2- 3 years ) to "complete"
Cycle

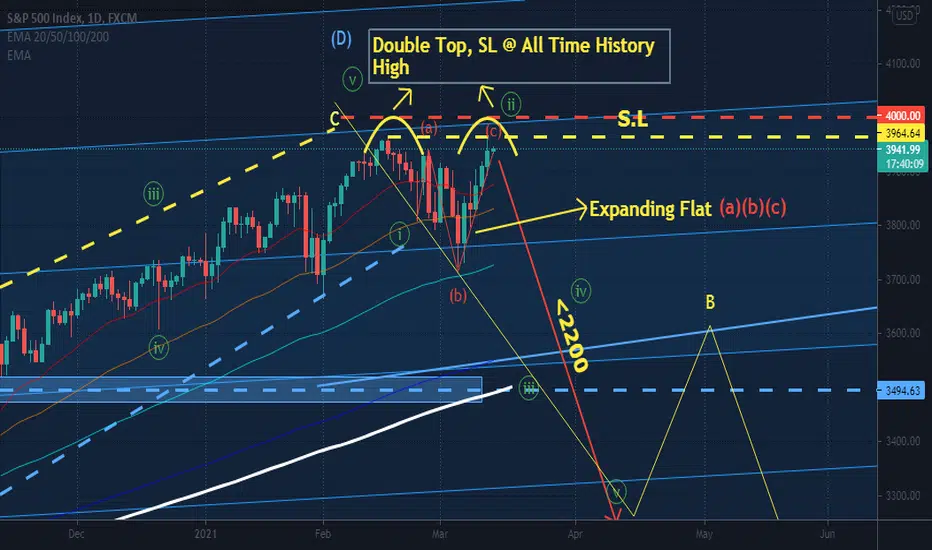
SP500 Possible Forming Double Top @ 12 March 2021After Biden Administration $1.3 Trillion Stimulus plan.. Biden Might Impose Higher Corporate Tax...
Bitcoin Market Cycle Forecast for the Next Two Halving EventsThis is what I foresee in BTC/USD in terms of long-term market cycle trends between now, the next halving (currently projected to be on May 27, 2020), and the halving after that (currently projected to be between March 2024 and June 2024).
The dotted lines mark past halving dates as well as the projected 2020 and 2024 halving dates.
Bitcoin market cycles have corresponded to each halving. Since the advent of Bitcoin , all Bitcoin halving dates have been followed by bull markets, which are then followed by a bear market and accumulation periods. Given the current long-term trend of Bitcoin's lifetime market patterns, each bull market should be less extensive than the previous bull market. That being said, patterns can always be broken, and this cycle is no exception, regardless of its longevity.
I do not hold any Bitcoin at the time of writing (June 5th, 2019).
Do your own research.

BITCOIN CYCLESPotential top around 200k $
Potential bottom before next cycle around 50k $
DYOR, it's only chart

GBP/CAD - Price residing in interesting spotPrice cycled downwards, currently residing at a key level in price and a trendline test. Lets see how this 4HR closes.
Simple structure on the HTF. Identify trend and key levels.

Don't worry about BitcoinBitcoin is still in up channel and it needs to make a lowSo to make an another low, Bitcoin needs to retrace and right now(2/24/2021) BTC is experiencing a corrective wave.] Also Bitcoin is experiencing a bearish candle in weekly time frame.
Based on fib retracements , Important support zones are:
Zone 1: 45100 - 44500
Zone 2: 42230 - 41700 (chance to return from this zone)
Zone 3: 39600 - 39000 (difficult to break out this zone)
Zone 4: 37400 - 36700
Zone 5: 34500 - 33400
Zone 6: 30000 - 29200
This is not an investing or trading idea, This is just an analysis for BTC recent corrective wave.
Do your own research and remember risk management is the key of success in financial markets.
Thanks for your time
Comment your idea and let me know what you are thinking


USD/JPY - Bullish cycle imminent? USD/JPY - 4HR Chart
We've seen a bounce off our long term ascending trendline. Bullish cycle upwards imminent? Will we see price follow our forecasted price path?
Do not use trendlines alone to take trades, however - they can be great to help you identify the trend on the HTF.

PDAC a good entry point? I think it will touch 12.85 and then push back above 13. Look for the hammer soon.

GBP/NZD - Break of Ascending Structure Will we see further downside movement on this pair?
We saw a break of structure last week after price tagged the top of our ascending channel around a key long term level in the market. Will we see price cycle down to the bottom of previous structure?
This pair indicates strength vs strength in the forex markets at the moment. Want to know what this means? Drop me a message?

A retail shakeout would be quite the rodeo wouldn't it? (DJI)I am watching for another potential shakeout before our parabolic run and repeat of the roaring 20s
Not personally even trading this move but I am trading cryptocurrency and they both dropped together in the COVID panic of 2020.
what if we see another flash-crash? are you prepared for such an event?
Take it for what it's worth since I'm not trading the DOW personally here but that can also be another reason to consider my less biased view.
Drop or no drop I do expect a lot more upside before another repeat of 1929 BUT it is coming and WILL happen maybe even exactly 100 years from the last one in 2029.
Stay profitable my lovely traders/investors.
- Dalin

GBP/NZD - Bullish Cycle inside this Ascending ChannelThis pair identifies strength vs strength in the forex markets right now with both currencies strong across the board.
We can see GBP is gaining on the NZD breaking through key short term Resistance levels. Lets see what happens at our long term key level in price.
Use wider stop losses on this pair to account for the choppy price action.

S&P 500 - The calm before the stormThe upward trend in the S&P 500 remains intact. This will probably not change until 19 February.
The price target and movement high is currently USD 3,971. At this point, however, caution is advised! All long positions should at least be hedged, as we expect a decline until 01 March for the time being.
The probability of a decline is about 80 %.
(Our turning dates have an average tolerance of 3 days. In 80 % of the cases it is 2 days).
Note:
Within our G.I. Swing trading strategy uses three special analysis methods. In this article, only partial aspects were published and does not represent a complete trading system, investment advice or purchase recommendation.

You need to be careful. Not to lose your focus.Bullmarket and altseason are great things, but don't forget we live in the real world.

PLTR Earnings ProjectionsBasing some projections on recent cycle trends. I wouldn't be surprised to see some minor pullback to the $30 level again before we get a nice push to the $40 level (78.8% level) and potentially to the $45 level before seeing some downside by the end of the month to early March.


Emerging Markets leading the COVID reboundSince 3/23/20 when all three bottomed out, the SPX (green) has outperformed the Europe, Australia, Asia, and Far East ETF (blue, ticker symbol EFA), but both are lagging behind the Emerging Markets ETF (orange, ticker symbol EEM).
The SPX has been leading most of the way, but last month the Emerging Markets became #1.
Investors have banked on strong recovery potential in the emerging markets.

Ethereum is SPOT ON with the last cycle!This is amazing news. We are following this fractal perfectly. Get ready for a wild ride. I am looking to take some profits in the high 2000s to put into bitcoin when the ETH/BTC ratio is at its peak.

Bitcoin correction in JanuaryI can make the case that it's over, and I can make a case that the party is just getting started.
This chart looks like it's only 7pm and we're on a beer run. Party on...

TRXC start of a growth cycleFrom monthly chart supported by ichimoku, MACD and RSI and all the good news recently it appears to me that we have finally entered the growth cycle of TRXC, which might end at around 40-50$ range by the end of this year perhaps even much sooner, due to historically sharper and shorter growth cycles. I will definitely play this stock for the time to come.


BTC: Digital gold trades like goldThe correlation coefficient between gold futures and Bitcoin started out negative for a few years, but after Feb '14 they began to move together. BTC and gold have now been in a five year cycle where the correlation will jump to +72, then drop to a higher low, then up to +72 again, over and over. It seems reasonable that the correlation could soon become stronger than +72 at this rate.
It adds validity to the "Bitcoin is digital gold" idea. They are both being traded in an increasingly similar way.
