Cycle compare BTC VS NetflixHi @everyone,
Here another BTC cycle comparison to our previous one.
Cycles wont repeat excactly but markets are driven trough humen emotions (Fear and Greed), thats why they rhyme often.
This is why many cycles have an indentical fractal onces you zoomed out and ignore the low timeframe noice.
as a previous cycle doesnt give u any guerantee that it will do the axact same thing, it wil give you a kind of guide into your long term investment portfolio's, by learning to reconize how cycle bottems and tops are formed it wil give you an edge over the competition into making live changing decisions.
- Be there when others look away, the pain of an bearmarket is just temporary.
- Never invest more then you are willing to lose, you will sleep well at night.
- Having patiënt and a long term view is a must if you want to trade/invest.
Cheers,
Team Quantisic
Cycleanalysis


This indicator could say that we hit the bottomLooking at the Anchored VWAP Indicator (Volume Weighted Average Price)
Each time using the previous cycle bottom from the last cycle. (2015 and 2018)
It could represent something significant, return to the average, meaning the bull and bear cycles are done, and the long term trend continues, unless we enter a long term perma bear trend territory ofcourse, but if nothing fundamental has changed with crypto, I don't know yet why the long term trend would reverse, fear will turn to greed eventually.

Crude Oil Cycle Analysis 12-12-22This is a crude oil series I'm doing as of late.
In this video, I go over the daily cycles, Elliott wave, and some statistics for the month of November.
I will start my December analysis to see if there is any edge to it.
Let me know your thoughts on what you see playing out in November for crude oil.

BTC cycle based Wave CountsThis is our macro view on BTC based on cycle based wave counts.
--> BTC is in the final leg down of a full macro corrective wave 4, nobody knows what the excact low would be.
Based on wavecounts, Fibonacci extension + retracement targets the most confluence is founded in the 13-11.5k zone (also the launchepad of the previous bullrun) with an potential overshoot towards 10k
We dont want to try buy the exact bottem, we always waiting to get conformation on a bottem formation or we buying at prices where we feel comfort with to hold for the next wave up.
--> BTC never was able to make new ATH's before the halving date. The next logical top should be in 2025
This is just one of the many scenario's we could think of, along the way with having more chart data our vieuw on this TA could change.
On wich prices are you feeling comfort to buy in without having any regret over the next years?
What is your trade plan?
Cheers,
Team Quantistic

BTC 1HR chart with local cyclesBTC could make a very important trend decision at the end of this cycle.

DXY cyclesDXY with cycles applied to the major swings. Some dates to watch for important changes in the trend.

Gold has already started the new bullish cycleMedium-term Gold forecast.
The corrective cycle that started 2 years ago has finally ended, and we have already started the new bullish cycle. This cycle is wave 5 (orange) and is expected to reach at least the 2,100 level.
We bought Gold when the price was in the Inflection Zone (green area). At this moment, we are risk-free and waiting for the confirmation of the bullish sequence to try to enter again, targeting smaller timeframes corrective cycles.
We will keep you posted when this opportunity appears.
Have a fantastic trading day.

Crude Oil Cycle Analysis 12-1-22This is a crude oil series I'm doing as of late.
In this video, I go over the daily cycles, Elliott wave, and some statistics for the month of November.
I will start my December analysis to see if there is any edge to it.
Let me know your thoughts on what you see playing out in November for crude oil.

GBPUSD Selling opportunityHello traders,
Today we want to share our view of the GBPUSD.
The long-term cycle is bearish and we believe there will be at least one more swing low or, in other words, another bearish cycle. This idea has the target of taking profit from this bearish cycle,
There are two potential paths as we showed in the graph
1- Our forecast is that GBPUSD will have to make another high before reaching the green area (which is the expected target the corrective structure WXY should reach before turning down) and then, we will sell GBPUSD
2- Alternative path- The price will not reach the area and GBPUSD has already ended 4 and it will start this last bearish cycle before reaching the green area
In both cases, in the medium term, we expect GBPUSD to go down. Therefore, we can prepare in shorting the GBPUSD soon.
TRS team

KLCI with new PM/Gov. 25/Nov/22For Studies Purpose ONLY. Malaysian have just voted and celebrated for their new government with its stock index surging >5%..BUT it probably need “some time” to “reformatting” the “bad hardisk’s sector” left by previous....

Bear Market, Bull Market, or Sector Rotation? KNOW THE ROTATION!
What Is Sector Rotation?
Investors are always looking for opportunities to boost returns and reduce risk in their portfolios. One way to do this is by understanding and utilizing sector rotation.
In simple terms, sector rotation is the process of moving money from one sector to another. In order to take advantage of positive market trends investors will want to pay close attention to these rotations. In general, there are two types of market conditions that investors need to be aware of: bull markets and bear markets.
Sector rotation is a strategy that investors use to take advantage of these market conditions. The idea is to rotate your investments into sectors that are doing well in the current market conditions and away from sectors that are not.
For example, in a historical bull market, you would want to be invested in sectors such as technology and healthcare. In a bear market, you would want to be invested in sectors such as utilities and consumer staples.
Sector rotation can be a helpful tool for investors to boost returns and reduce risk. However, it’s important to understand how it works before implementing it in your own portfolio. Keep reading to learn more about sector rotation and some current YTD chart examples of what it looks like.
Lets start with a philosophical question in regards to the market; is there really such thing as a bull and bear market? One could argue that there is not, and the market is in fact a cycle of sector rotations. Liquidity going out one, to another, again and again. Take for example the 4 tickers of the main post image MSFT , NASDAQ:TSLA , NASDAQ:GOOGL , NASDAQ:AAPL - these are considered Tech Stocks (yes TSLA is a tech stock!). YTD performance of all these stocks are in the red. Please take the time and study their trends. To the novice that had a portfolio made up of 80% tech, they would look at this chart and scream BEAR MARKET. But is it? It is impossible for the average trader to tell, but not all that money was "lost" in a bear market. It simply was rotated to defensive sectors. Sure, some money was taken out of the overall system I am sure but logic dictates that the majority of the money just found a new home. Investors in tech in these cases could ride the storm and average down (dollar cost averaging), write call options, or purchase puts (along with many other strats) - aka play a bear market in THAT sector. The terms "bull" and "bear" market are used to describe market conditions where prices are either rising or falling. Some people believe that there is a fundamental difference between the two types of markets, while others believe that they are simply two sides of the same coin. Ultimately, there is no right or wrong answer, and it is up to each individual to decide what they believe.
So where did the Tech money rotate to? For those of you that need only bull markets to trade, find the rotation and follow it. Never marry a stock or sector - money moves fast and is prone to jumping ship when major events happen. Here are 3 charts that show areas that bulls have had success:
EX1: Staples and Consumer; NYSE:HSY , NYSE:MCD , NASDAQ:OLLI , NYSE:WMT
EX2: Energy, Industrial, Insurance; NYSE:KMI , NYSE:CAT , NYSE:OXY , NYSE:ABBV
EX3: Defensive and Insurance; NASDAQ:HON , NYSE:RTX , NYSE:AFL , NYSE:CI
If you take the time and study the charts above you will see that not all is bearish when you know where to look. Looking at these rotations can start to paint a larger picture when studying ETFs or the overall market in a national/global economy. Especially when it comes to finding a fair value area in the middle of a downed market. Recovery off of a bear market should be equitable across multiple sectors. In the current case (today) we see that the rotation into "defensive" stocks (all the stocks mention in EX1, EX2, and EX3). As there is a small pinch of hope that inflation could be slowing, the moves have been liquidity into these defensive sectors - not a sign of a healthy recovery (yet) in my opinion. Right now we are seeing more institutional interest in companies like HSY, MRK, CI, HON and less interest in Energy. Energy is a great sector to look at currently to start to see that shift. We can look at commodities like GOLD and see the increased attention and bullish run it has had recently. Remember, intuitions want to create the largest positions they can , but over time so as not to raise a flag to others.
To find sector rotation:
1) Familiarize yourself with the S&P sector funds like the AMEX:XLF , AMEX:XLP , AMEX:XLE , AMEX:XLU , etc
START LARGE - look at the Monthly, Weekly, and Daily
2) Scan for stocks with rapid price drops and identify sectors that may be hurting
3) Scan for stocks with rapid rising price WITH higher than average volume (preferable increasing volume as well)
4) Visualize the sectors in a heatmap. Size by Volume (Monthly) and Color by Performance (Monthly). Since this is constantly changing, I suggest taking a screen shot of this map every week - this will be the best way to "see" the money rotate.
5) When going through 2-4 consider comparing small and large cap companies as well - as this too can hold its own rotation.
6) Stay on top of news, read read read read. Understand the world around you and rely on change.
7) Utilize Smart Money Concepts. Please visit LUX ALGO's page for this, as he has made a beautiful indicator and strategy based around SMI and institutional order blocks.
8) Conduct an RSI or Stochastic RSI study to identify divergences in OVERBOUGHT or OVERSOLD conditions.
9) VIX VIX VIX - yes we are talking sector rotation and the VIX is an "overall" reflection of the market in whole but looking at areas of the VIX (ie 20 and 45) can give signs of upcoming rotation. Although it may not point where, it may describe when these rotations can occur.
If you like this post and would like a more detailed follow up, please comment below so I can see your interest. This is a very extensive topic in which it may take several posts to fully write out in detail. This is post 1 and meant to be an introduction, as I know that almost every line below can be heavily expanded upon.
Happy trading everyone!

Crude Oil Cycle Analysis With Elliott Wave CountI'm sharing some analysis on crude oil using cycles analysis and Elliott wave count on the Weekly and Monthly.
Let me know your thoughts on the analysis.

The Bitcoin Experiment!First off I want to say, don't take this as gospel. This is a chart to follow bitcoin and plot it's path using math and it's trend patterns to date.
The time sequences from a factor of 1.4, 1.5 and 1.6 are what the math shows me
1.4 Multiple being the trend from establishment (support) to trend end
1.44 Multiple is the breakthrough to the trend end
1.5 Multiple is the breakthrough to peak (Shaded area)
You follow chart this until it's voided
1.6 Multiple is from peak to peak (Long Green arrow) This math is using the second peak in November 2021
1.3 is the multiple using the first peak in April 2021 (shorter green line), which puts the second parabola and final top of the trend in July of 2031.
History might not repeat exactly but it does seem to follow the patterns fairly closely. Using math sequences we might be able to figure out approximate moves fairly closely.
For this chart to have present or very near timeline validity, the next few bars should push up against the blue line as resistance just as it did on the red line in 2014. So, Let's wait and see into December to see what happens.
The blue and red regression trend shows a similar pattern with three waves down until the final plunge of the trend line break through.
If accurate, this chart can help you navigate through the Bitcoin timeline, as it can help you see what stage it is in, or at least to get a better grasp of the moves.
Please feel free to comment your thoughts below
Thank you for looking
WeAreSatoshi
Stay Blessed!

TWITTER: Musk announced permanent bansElon Musk said yesterday that Twitter users who have created fictitious profiles impersonating other users without labeling them as “parodies” will be permanently banned from the said social networking platform without warning.
In a separate post on Twitter, Musk said that in the past, the platform would issue a warning before suspending a profile, but as Twitter evolves a broad user verification process, there will be no such warning. Also, there will be no “exceptions”. This will be a condition for signing up for Twitter Blue, adding that any name change would cause the user to lose their identity verification token. They will not be allowed back on Twitter until the said social networking platform has “a clear process for doing so”.
Organizing such a process will take at least a few weeks, clarifying the timing of the possible return of Twitter’s most famous user, former President Donald Trump, who has been banned. The new timeline suggests Trump won’t be back before midterm congressional elections on November 08.
Twitter had a huge drop in revenue due to activist groups pressuring advertisers, even though nothing changed in terms of content moderation and everything was done to appease activists.
Musk’s fortune has shrunk by about 35%, to $209.4 billion since its peak on Nov. 4, 2021, from $320.3 billion, and the almost-sole reason for this decline is the decline in Tesla stock. Over the past year, Musk has sold $31 billion worth of Tesla stock to finance his takeover of Twitter and take it private. Since the deal has not been finalized, Forbes calculates the value of the cash (minus taxes) earned from these sales at their net worth. But the row over the Musk-Twitter deal has alienated investors, who believe Musk will pay an exorbitant amount to acquire the social networking platform and that he is recklessly selling Tesla stock to finance the deal.
From Elliott wave perspective, on the weekly chart we see Twitter trading in big bullish sideways running triangle pattern that can take some time before we will see a bullish break-out, as final wave E can be still missing. On a daily chart we are tracking a three-wave (A)-(B)-(C) rally within wave D that can find the resistance around 60 level and from where we should be aware of another slow down within wave E that can retest 40-30 support zone before it takes-off.

arkaDIKOUSD_ghostTrade_TradeGod - Long 800% 4hOKCOIN:DIKOUSD
ARKADIKO/USD ripe for a parabolic return to the previous delta volume divergence level @ 0.2504.
hidden volume divergence between the highs formed 29th - 30th on a 4h resolution.
Huge volume changes are evident over last 24hrs and believe the following is now expanding before us:
Entry: 0.0185 ✅
TP: 0.2504 - ETA =< Sunday 6th Nov 2022
Its a volume thing 😁 Enjoy at your own risk 🤔 as always...

SSE (Shanghai stocks index ) probably “bottomed”. 28/Oct/22SSE ( Shanghai Stocks Exchange ) index probably now as “leading indicators” for world’s economic not US anymore..As its index “crashed / bottomed” much “earlier than US markets like its individuals stocks e.g BABA, Tencent, Xiaomi, NIO etc..

$BTC Wyckoff Markup 15m - Midweek DistributionHi guys,
So bullish news on Bitcoin, which means we should all buy now, right? Bitcoin is pumping and now we're getting on our rocket ships to mars.
Not so fast.
Rishi Sunak has become the Prime Minister of the UK, and it is said that he is a fan of Bitcoin and used to be an institutional trader, which is very good news in regards to the British economy and the British pound. I recently got out of my large short 'position' on the pound after a year of keeping all of my savings in USD even though my home currency is GBP because I saw a devaluation of the pound coming.
Back to Bitcoin; as I have been saying for weeks, I am seeing a relief rally up to $28-32k and we have now broken out with this good news. But now is not the time to go long.
Over the last couple of days we have been seeing a wyckoff markup pattern as shown below:
www.investopedia.com():max_bytes(150000):strip_icc():format(webp)/dotdash_Final_Making_Money_The_Wyckoff_Way_CSC_DNR_Jul_2020-01-f62425effeb9422fb7ac34ad83c1f963.jpg
Which can also be seen as an Elliott Wave 5-wave structure.
This is how prices react to good news.
Now, what I am seeing is a midweek distribution, which is quite common in weekly market patterns, before a dump towards the demand zone, shown in red at the bottom of the chart.
images.prismic.io
Cheers for reading and let me know what you think,
Tchau

BTC: ~ $ SYSTEMCTL START DEPLOY.CAPITALBTC: ~ $ /PRICE/BOTTOM/STRATEGY.PH
Script started on SATURDAY 18 JUN 2022 08:13:33 PM UTC
DCA="Weekly"
DURATION="Price is sideways"
EXCEPTION="BTFD!"
$$$$$$$$$$$$$$$$$$$$$$$$$$$$$$$$$$$$$$$$$$$$$$$$$$$$$$$$$$$$$$$$$$$$$$$$$$$$$$$$$$$$$
$$$$$$$$$$$$$$$$$$$$$$$
BTC: ~ $ ^C
BTC: ~ $
BTC: ~ $
BTC: ~ $ /ETC/INIT.D/WYCKOFF_ACCUMULATIOND STOP
Continue? (y): Y
DXY.TOP.......................................................................................................
BOLlINGER_BAND.SHRINK..................................................................................
BTC: ~ $
BTC: ~ $ SYSTEMCTL START BTC.PAMP -T 30K+ | ECHO "YELLOW_PATTERN"
~~~~~~~~~~~~~~~~~~~~~~~~~~~~~~~~~~~~~~~~~~~~~~~~~~~~~~~~~~~~~~~~~~~~~~~~~~~~~~~~~~~~
#PS: Do you recognize that YELLOW PATTERN? It is copy of the price action from May-August 2021!
# I have put it there in June when I felt THE BOTTOM MIGHT BE IN = still nearly mimics it so far =)
# Was expecting to see a Lower Low fakeout for the so called "SPRING" to trigger the pump but....
# PURPLE LINE = ATOM -> it has been outperforming BTC and everything last few months! ⚛️🚀

Cycles of BitcoinIn weekly time units and in logarithmic scale, we can see that the cycles of Bitcoin have been based on technical support since 2010. This support gave way only once during the panic of the world stock exchanges in March 2020, due to the Covid 19 pandemic. This representation shows that Bitcoin is probably on the low of the current cycle (end of cycle) and that it will never return below $17,500, except in the event of a new global crisis which could cause the price to fall below its historical support.
The same analysis done in February 2019:
My analysis on the end of the current bear market:

KLCI possible “bottom” @ around 1320 by end 2022. 13/Oct/22FMBKLCI’s “seem” like forming a triangle pattern in supercycle wave (b) (yellow). Price seem like contracting before “exploring” to upside “ONLY” after 2027..P/s.. it seem like most Index. E.g US, Asian point to year 2025, 2035..

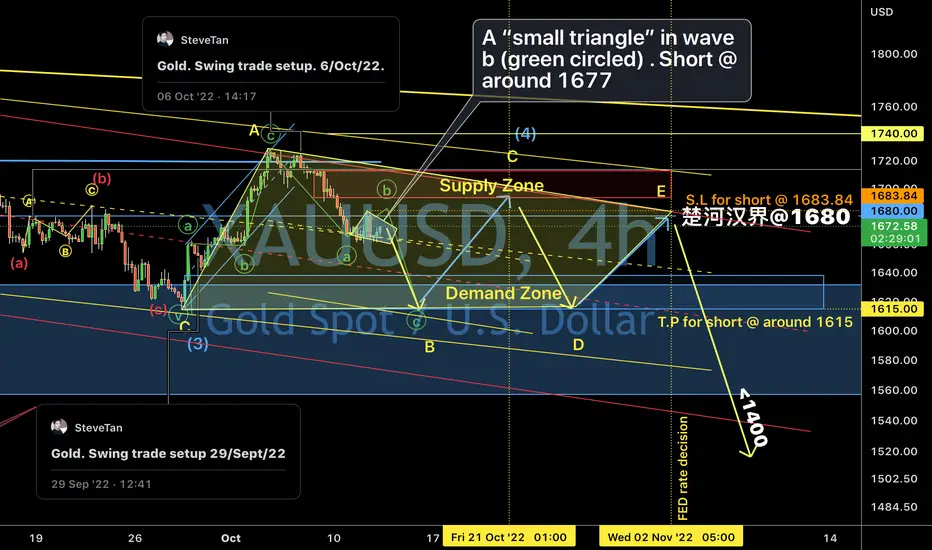
Gold. Probably “done” wave A (yellow) of triangle. 12/Oct/22Gold possible completed wave A ( yellow) of triangle in wave (4) (Cyan). Price now at subwave b ( green circled) of wave B ( yellow) of triangle where price could reach @ around 1615.
SP500. The worst (>-70%) is yet to come by 2025. 11/Oct/22..SP500 probably will break ATH ( All Time high again ) by 2025 as we’re probably @ the sub wave B ( Red Circled) of the second leg of expanding flat pattern abc (green) which is wave b (green)..Based on the “pattern + cycle”..There is a “possibility” that SP500 will crash more than 70% toward around 2000 level. By end of 2024/ early 2025! So..”Prepare for the worst!”..
