Gold possible forming triangle. 7/Oct/22Gold possible forming a bullish triangle while waiting for breakout to the upside after FOMC. Price has kept above 1700..As POC has shifted to the “upside” It seem like institutional buyers are holding gold price above 1700.
Cycleanalysis

Identifying significant bottoms in Bitcoin Bear CyclesHey all!
I've been looking at long term charts for quite a while, trying to find some pattern to help me identify and find the dreaded "price bottom" everyone longs for.
Here's a model/pattern I've found out in the chart, which eerily seems to be accurate across past cycles, and we just yet might be finishing it off as well this time.
There are several predicates I have to put before the analysis:
This is NOT financial advice and should be used for entertainment purpose only!
I'm using two-week candles to have as little noise as possible while having more data points than when using Monthly candles.
RSI
- Major level for RSI is 50; when RSI is above 50, I consider we are in bull-market and going up. Basically every time we went above 50 and held it as support, we never looked below 50 before reaching the cycle price top.
- Another major indicator is the Moving Average on RSI. As per usual, if MA is going up, the price goes up and until the direction switches, prices will go up. Breaking the MA as support and holding it as resistance starts the new bear market and prices dropping.
- Since this analysis focuses on the "bottom", I'm going to talk mainly about what happens after RSI breaks the MA and it reaches level 50 from above.
StochRSI
- as per definition, major levels are level 20 and 80.
- All major price points I'll talk about happen below level 20.
PMAR & PMARP
- I'm using PMARP
- major level is between ~25-30; We tend to touch or go below this level in bear markets
- The Moving Average (SMA) is very important and I'll be using it in my analysis as well.
As you can see, there are 9 orange vertical lines, I call them simply "#point 1-9". These are actually describing the "same" event in different times across the Bitcoin history.
I will completely omit any price charting, the price is only pinpointing my analysis, however be sure to notice, the orange #points are showing INDICATOR significant levels, NOT price levels (even though they go hand-in-hand).
The story must be explained on each of the three indicators, for each of the three-points I'm using.
So let's start!
#point 1, 4, 7
RSI
- RSI went below MA (yellow line), and reached the ~50 level for the first time since quite a while.
- On this occasion, the level 50 holds as SUPPORT
StochRSI
- First visit of <20 lows since hitting highs of >80
- Usually goes even below 5, or as low as 0 on this occasion.
PMARP
- First time reaching level ~26-30 since breaking the MA (white line)
On this occasion, we are hitting first major lows on all indicators (and price of course as well). However, every time, there is a small bounce, but this bounce is short-lasting, invevitably heading for next points.
#point 2, 5, 8
RSI
- First time RSI does not hold 50 as support and breaks below this level. It will likely retest this level as resistance but fail to hold it as support for any prolong period of time.
StochRSI
- Another point being <20, most likely hitting <5 again.
PMARP
- Hitting level ~26-30 again or going first time BELOW it.
After our first set, we had a brief rally, only to get crushed even more below our support levels on all three indicators. Price can be the same or lower than on previous point, but we know there is #point 3/6/9 coming up, as this is not the bottom just yet...
#point 3, 6, 9
RSI
- Hits absolute bottom, it will NOT go below this level until the next bear market.
StochRSI
- Again (or still) hitting levels <20, most likely <5 even. Looks like any momentum is completely dead.
PMARP
- Hitting new lower-low, this value will not be visited again before reaching next bear market.
- #point 9 is an outlier - other points were rejected from MA after previous point AND before reaching this low, not the case for #point 9; However, what we DID have, was a rejection from MA on PMARP before #point 8 printed, which could count as well.
This last point in each cycle is very special, as there are many similarities and some differences between each points.
The most important aspect is, that at these points, the indicators were at their absolute bottoms, and very similar story followed for #points 3/6, we are yet to see if they will happen for #point 9 as well.
So what happens next?
RSI
- In my eyes, the bull-market is over whenever RSI goes below 50. And on the contrary, the bear market is over when RSI goes above 50 and decisively holds it as support.
- When last point prints, the RSI must retake firstly the MA (which tends to be lower than 50), and next it must go above 50. Once it does, the bull market is officially on.
- You can notice interesting "similar" timeframes for following:
- Going below MA (yellow line), and going above 50 level took 45 bars (Jan 2014 - Oct 2015), and 35 bars (Dec 2017 - Apr 2019). If we take 45 bars on our current cycle, we are looking at Mar 2021 - Dec 2022 if you take first break of MA (the same as previous points)
- After going above level 50 (and holding it as support), it took 57 bars before we decisively broke the MA in 2017/18 bull-market, and 51 bars in 2019-2021 bull market. Since we are not above level 50 right now, it's hard to say when the next RSI break might be, but if we use our previous estimate of 45 bars from MA break to 50 level break, and use "average" of 51 and 57 bars, we are pointing for RSI breaking the MA from above again in Jan 2025; but this is pure speculation right now.
StochRSI
- Important level when coming from <20 is of course the level 20, and 40 as well. Once both levels are held as support (and possibly retested more times), the bull market might just be allowed to start,
- For #point 3/6, the first time we "touched" level 20 on StochRSI after these points printed, we never went below level 20 again until the next bear market.
- NOTE: Reaching 80 the first time does NOT have to mean the bull market is starting - this has to be connected with the RSI being above 50 as well - then you can be "sure" it won't go down again until next bear market.
PMARP
- Similarly to RSI, PMARP has two objectives - retake MA (white line), hold it as support and then go above level ~26-30 and hold that as support.
- There are also similar timeframes for notable objectives done by PMARP:
- Breaking the MA (white line) from ABOVE, to break it again from BELOW took 28 and 29 bars. If it were to take 29 bars this time "again", it points to Dec 2022 (same as RSI using 45 bars, see above) - the last point is a bit of an outlier, since PMARP went above it's MA briefly during Oct 2021, so I consider the "last" break from ABOVE in this timeframe.
- Time between #point 3 and 6, when PMARP last touched the MA, to next time it did the same after given point was reached, took 100 bars. If we use this same timeframe, we are looking to break the MA on PMARP from BELOW in Dec 2022 (again the same date!)
To summarize:
- All things considered, I think we've already found our "three bottoms" as we did have in previous bear markets as well. This does NOT mean price cannot go lower (cascading liquidations for example), but I'd argue that the INDICATOR bottoms are IN!
- Using similar timeframes, it might seem we could break the indicator major resistance around Dec 2022. This does not mean the price will be higher then than it is now!
- Again, I'm not saying price bottom has been reached.
- Critique and comments are welcome. I'm newb TA-junkie, this is not professional work and it's the first Idea I've written.
- This is not financial advice, DYOR.

Gold. How to intraday & swing trade. 5/Oct/22.Gold probably completed wave a ( green circled) now trending down to wave b (green circled)..before moving up to wave c (green circled) where it will complete wave A ( yellow) of a triangle ABCDE ( yellow) pattern.

HARTA long term bullish reversal w/ confirmation. 30/Sept/22Harta have long term bullish reversal setup with confirmation entry! Harta’s stock price By breaking wave b (cyan) the subwave of last impulsive leg down which is wave (v)(Red) confirmed a reversal signal for down trend Since August 2020...P/s people asking if you are so good why just don’t “keep yourself?!” R u trying to show off? Selling signals or looking for investors? Not at all. As we know, 1 ways to improve our trading, traders is to write down their “trading journal” instead of “keeping myself “ I write down AND Let “the public” to be “my judge” would be “more motivated “ to correct my mistake..

DXY & FED FUNDS RATE2 day Time frame update of Quarterly DXY chart below....
DXY shown here with macro harmonics, contrasted with historic Fed Funds rate. Arrows indicate BTC cycle lows put in well below prior DXY peaks, and serves a small dose of balancing hopium in an otherwise bearish market.
Fractal is taken loosely from the circled areas, with the suggested path involving consolidation in the 115/117- 105/8 range into next year.
Hypothesis: as developed nations step in to intervene to prop up their currencies, by tightening ( central bank rate hikes like we are seeing from BOE and Swedish Central Bank in the last week) and potentially tapping into their long end US Treasury reserves to purchase dollars ad buy back their own currency, as late last week's BOJ intervention suggests, DXY will consolidate but ultimately break up into the 119-low 120's before some cooling off.
Noteworthy technical macro ascending channel with 4-5 confirming touches which we are now closely approaching. With S&P P/E rations in the 18's we may start to see sidelined institutional investors start to enter the market at the 15-17 mark, as at this juncture with real negative rates dominating financial conditions, equities begin to service portfolios as a hedge against inflation.
***Harmonics are merely noteworthy phenomena, and not intended or regarded by myself as predictive of future price movements in any way.

VIX - Next Phase: FEARBased on cycles, markets can experices a lot of fear int eh next pahse.
Stocks are down, but volatility is still relatively low, we need more fear and blood on the stock market before this one can stabilize, when least expected.
Puts are already at the extremes..

Inari’s cycle and elliott wave. 26/Sept/22. Inari price possible still hasn’t completed its correction as global chip still “oversupplied” “ temporally “..Now it is moving to cycle 13 ( green) until end of 2022 or early 2023.

DXY FED FUND RATE & BTCAlternative perspective, Bull case: BTC established cycle lows in 2015 and 2018 before DXY peaked and in tightening FED environments as pointed out in this chart. Worth noting there is certainly yet a case to be made for the macro lows for BTC being already in at mid 17k. One thing that seems to characterize cycle lows in BTC, is the mass calls for still another 30-50% drop which somehow never materializes.

HOW A LONG CYCLE UNFOLDS IN REAL TIMEKUCOIN:INJUSDT
Above diagram is a simple graphic of a Long trend cycle.
CONTRACTION - EXPANSION - TREND.
Prices tighten into a sideways corrective environment to the point of almost stoppage (This is where the phenomena of frozen candles pre break occurs) once a fair and true value has been confirmed by the market it breaks out into an expansion phase which begins to oscillate around true value taking out highs and lows in the process before moving into a dedicated Trend phase.
In the above structure a return to value will be in play though you should await the trend phase to trade the short move back to true value or equilibrium. More experienced traders can use this cycle knowledge multi time-frame to sell the highs back to true value.
THIS KNOWLEDGE UNDERSTOOD HAS A 90% accuracy to trading via orders and 100% to active and live trade management.
Any lows under true value are buy signals and any highs over true value are sell signals.

AVAX/USDT - “I” ALIGN WITH “ME” @110.542 KUCOIN:AVAXUSDT
Expansion out of a contacted price zone (33.601) - Accumulation began mid May for this Wycoff natured daily expansion phase reversal.
BUY POSITIONS -
P1: 13.045
P2: 17.961
P3: 24.656
P4: 30.783
P5: 33.601
TAKE PROFITS -
TP1: 24.656
TP2: 30.783
TP3: 33.601
TP4: 69.572
TP5: 110.542
I regret to inform you that stop losses are a myth and do just as they say, incur loss. If your feeling emotional just place a stop at break even although proper risk management with leverage and or your margin being managed intelligently will make this an extremely pleasurable trade.
This one was a tricky one because during the liquidation phase and liquidity fills AVAX was pushed into contraction at (30.783) again causing mainly retail to sell more AVAX and further liquidations although institutions and whales were thinking the opposite and still taking profits, as well as accumulating inventory for the upcoming trend pointed out on the chart above. The next at (24.656) where new buys were placed by mainly retail traders because at this point the asset becomes somewhat feminine in its nature and structure after masculine impulsive sell moves cease abruptly. This slower vibrational activity drainage begins when volumes dither and confusion and panic sets in.
Do not be fooled though remember it is a paradox and one of degree: Higher resolution (time-frame) expansions (corrections) can be traded by experienced and skilful investors who understand how the market really moves and in fact 90% of traders will be in this phase on lower time frames 90% of the time within around 90 days you’d have been through a cat 12 typhoon, capsized and all your collateral lost at sea while “Pirates escape in a spaceship with your inventory!…”
Further buys were then placed at 17.196 after yet further but not yet finalised liquidation bear phases. Prices then returned into the zone created by the three aforementioned contractions bracketed and explained above in attempts to settle AVAX’s value. This was confirmation that 24.656 is the AVAX equilibrium with 13.045 looking very much like a final liquidation zone as the liquidity here is needed for the imminent trend.
The panic and volatility that can be seen in these price fluctuations during expansions is scary and will ruin you if you get caught in a higher time expansion on a lower time frame with no understanding! Understand first or eat bread and drink water.
Have interest, this creates a cycle of attention-interest, more attention meaning more interest and will grow into a concentration and further to a focus and on to higher mind vibrations of concentration and focus that bring understanding and knowledge from the ether. Give your newly obtained knowledge to action and receive yet more knowledge which you now begin the process of having interest in that new knowledge and the cycle continues. This is how brain market structure works lol…
Read this over and make AVAX your ticket to higher dimension and degrees of reality and use your winnings selflessly, intelligently and only for the good of humanity. Any monies made from this idea that are used negatively will reverse manifest and become yet again unseen. You were warned.
TRADEGOD

BITCOIN - 6141.3 WHERE THE PAIN ENDS AND THE PLEASURE BEGINS!KUCOIN:BTCUSDT
Here you are looking at how a market switches from short to long and in doing so increasing it’s true value. You will be now able to find some peace finally knowing where the pain ends with BTC and this internally impulsive bear market corrective cycle.
BTC ended a previous cycle after heavy selling to satisfy the true and fair contraction value (created Mar-May 2019 when the cycle began), causing violent liquidation and the shifting with volition. This value of 3821.0 was agreed upon by smart money and intelligent money during the bracketed period aforementioned. After the liquidation event when intelligence started to pull profits to begin a new contractual agreement longer term, liquidity was trapped in the marked Aqua zone and a new agreed price at that time was agreed upon.
That price is 6141.3
That price just as the previous price of 3821.0 MUST be retested to complete the contractual investment and adhere to natural law within this substantial reality.
Be grateful for the the good and positive elements this cycle brought you and the things you learnt from it in any situation it placed you. Know now that the new cycle will soon begin and you will have an epic investment and hold from BTC at a historical value. THANK ME LATER AND DO NOT MISS OUT. I WOULD HATE TO SAY THAT I TOLD YOU SO ;) …

DAX respecting diagonal supportThis is Germany's stock market index, one of the strongest economies in Europe.
The index consists of the 40 largest companies listed in Frankfurt Stock Exchange.
On the monthly chart we have the red diagonal line, which has been a support since the beginning, as shown in the circles.
We also have the middle yellow line, which has been tested 11 times as a support.
In the times when the line was 'respected', I put the green number.
When the line was broken, I put the red number.
Will it break down this time?
Cyclically, the price reaches the red line in the month of March.
So if this periodicity continues, the price would reach this line in March 2023.
Or if it happens equal to 2011, at least it would come close in September this year.
At least in the short term, the scenario does not seem to be the best, and this is true for all markets.
The monthly MACD is pointing down, which is not a good sign.
But just because something happened in the past doesn't necessarily happen in the future.
This is just a prediction and a question.

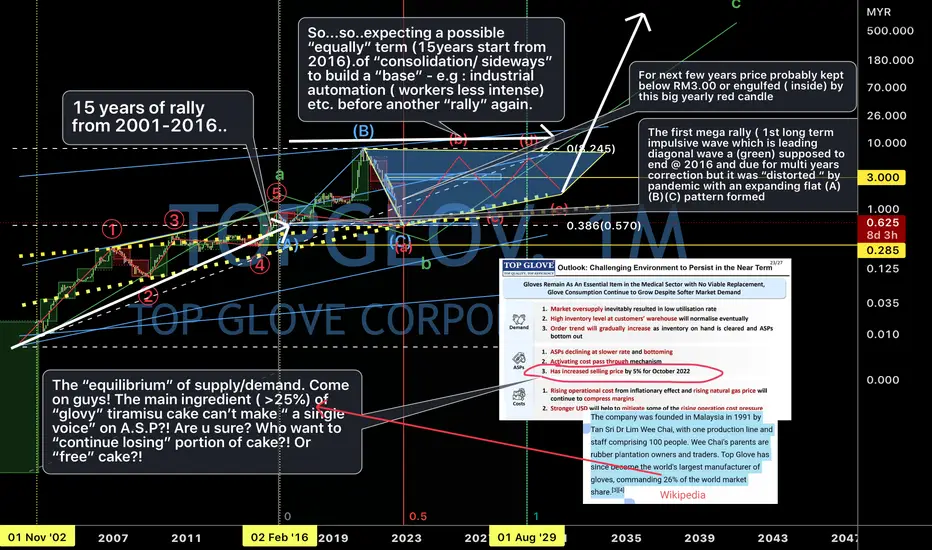
Topglov. >25% majority can’t decide ASP?! 22/Sept/22Topglove. We’re at the “junction/ intersection “ of 2 median line ( dotted yellow) of 2 major (long term) ascending parallel line ( cyan) + Plus Fibonacci 0.386 lvl which is around RM0.570. Let see whether price could keep above RM0.50 for coming few months. We have 2 “news”. The “Good news” is we might close to complete correction of expanding flat (A)(B)(C). But the “ Bad news” is we might just completed wave (a) of the coming multi years triangle / sideway pattern..
The Proper Perspective on InflationAs any true trader knows, the inflation rate DID NOT GO UP 8.3%. That is what some retail news outlets claimed "year-over-year," which is plain misinformation. The retail news was designed to trigger a panic dump among the less informed last week.
FACT: The rise in inflation started in late 2020, not this year.
FACT: The rise in 2021 went to 7%. But the news seldom mentioned it last year. Nope, it was all about vaccines and Covid, etc.
The inflation rate went down. It has been trending downward at a sustainable rate. Anyone who thought it would be lower was not paying attention. There is a 3-month decline, and it is due to falling oil prices which were constantly boosted upward during August by the big banks trying to move more investors into buying oil stocks. So, with fluctuating prices of oil between 80 - 92, there was NO WAY inflation would tick down to 8.1%.
In August of 2021, inflation had already risen to 5.3%. Now in 2022, it has dropped to 8.3% from the peak of 9.1% in June. So it's 3 points higher than a year ago, obviously not 8.3 points higher.
During the pandemic of 2020, the news about the Federal Reserve Board was all lathered up about deflation, that deflation was about to happen, and the world was coming to an end!!!! Sigh. Some people just have to have bad news to feel good, I guess.
Oil and the war in Ukraine, which appears to be settling down with the Ukrainians taking back what is rightly their country, has lowered oil prices from $125 to 80-90, fluctuating regularly. Oil needs to drop to 70-80 for inflation to move down more.
Slow improvement is how it is going to be. To assume inflation would just drop back to 2% is irrational and illogical.
What is an ideal rate? For an expanding economy: around 4-5%.
See that red arrow? That should be the goal. It probably is not, but it should be. Inflation lower than that indicates a sluggish economy with a lack of raises for the workforce. When inflation is not in the economy, corporations use buybacks to boost their stock prices, which creates fake rallies.

Altcoin season officially over - BTC takes overStarting with last cycle and the emergence of altcoins in the cryptoverse, BTC has been in a tango with them - either dominating the market or allowing alts to shine.
This dance can be seen in the BTC dominance chart CRYPTOCAP:BTC.D
When comparing the last and current cycles, we notice some key differences:
1. The market has matured. We've had no blow-off top - either because institutional money is influencing price instead of FOMO or people realized that the blow-off top doesn't last for long and decided to take profits earlier. Or both.
2. Trading opportunities have grown exponentially. Last cycle, during the bear market, BTC has regained dominance swiftly. So far in this cycle, BTC dominance has been bouncing around 39%-48%. Why keep your value in a bearish asset when you can play a short term trade to grow your value?
3. People are not leaving the cryptoverse entirely. While last cycle you could either switch back to BTC safehaven or exit to FIAT, today many are using stablecoins to keep their portfolio value waiting for the next opportunity to enter a trade.
For the last two cycles BTC has spent a considerable amount of time in the Value Area (area between .618 and .786 Fib retracement from bottom to top) and found the market bottom below this area. Some say that the bottom is in, others that we still have a leg down to reach the market bottom. Either way, we are not far from it.
What we can state as more probable than less probable is that we still have at least 3 months to spend in the Value Area before moving up. Depending on how you measure it, we could still be here for the next year or so.
During this time (3-12 months) I expect BTC dominance to rise no matter if its USD valuation rises, falls or ranges. Whether it will find resistance around 48% or move to the next level at 58%, we'll have to see. But in the medium term, the dominance looks very likely to move up.
PRO TIP : We are still in a bear market. Now is the time for accumulation. If you have in your portfolio alts that are overvalued compared with BTC, there is an opportunity to trade for accumulation. This means trading it to BTC now to buy more back with same BTC later.

Gold. How to trade major breakout(1680) w/ stop lost. 18/Sept/22Gold. We had a solid big bar/candle on daily chart closed below 1680. So possible a “legitimate” major “breakout”. Price probably will have a “magnetic” pullback toward previous orderblocks/supply zone on smaller candle where those hot money “gather” before a following “heavy distributed explosive move” with big candle/bar. This would be “ the base” where the “gunfire” will be ignited with more “explosive power” = ( from 1700 to 1600 a whopping $100 ( 1000 pips) drop!) . probably right after FED “big date” on 20-21/ Sept /22 AND..Last but not least where is our “last defense / stop lost” for “this war”...

Gold. Breaking 1680 w/ 52 wks low! 1400 is next! 16/ Sept/22.Gold. By breaking 1680 critical support. I have to review the big outlook of gold chart ( And gold has inverted medium Cycle which I’ve missed it )..its previous cup and handle pattern might “shift to” a big triangle pattern ( ranging /base) in wave in (IV)(yellow)...Apparently FED “prefer” $ cash is king = US dollar/ 10 years bond “ not stocks even “smashing” gold! Which used to hedge inflation. Gold price probably drop another 15% or -150% if you are trading x 10 sport gold by leveraging! reaching around 1400 by end of 2022 or early 2023..So..sell on gold on any pullback toward the red upper line of declining parallel channel inside wave B ( Red Circled) is the best choice ( will update detail in next chart) P/s.1430-1400 would be the confluence zone of 1) Major up trend line zone ( cyan color) 2) wave C (Red Circled) @ 1430 is Fibonacci extension 1.618 of wave A ( Red Circled) 3) 1400 are the next major monthly Orderblocks/ demand Zone..

#XAUUSD #Gold going to 1400$ in a few months? Law of vibration..According to Gann and the bible, there is no new thing under the sun! Taking that sentence and going back on the gold chart as far as 2003, we could see the same pattern shaping up. If this cycle pans out, then we are going down to at least 1400$ in a matter of few months...
Keep in mind that we have applied this exact method to #DJI (Dow jones industrial average) and this short idea on gold exactly matches the conditions on that trade. What is going on in the world?

Topglove. Catching falling knife ( downtrend) w/ glove. 15/09/22Topglove. Are you interested to know how to catch a “falling knife” with gloves? Or Topglove more specifically?..Let do some “microsurgery” first with “Topglove” “zooming” into this “ Zone C yellow” to see where it’s centre of cancer location and before cutting its “cancer tumors” with while you might be “hurt” “many times” by catching “falling knife / downtrend “ in surgery room.

Gold. Double bottom! 15/ Sept/22Gold. With cycle analysis (Sorry. not shown on chart as it’s too messy only I understand it )Probably double bottom as price “all in” prior to FOMC rate hike on 21/Sept/22. Whether is 1.00 or a “rocketing fuel” of 0.75!..

Sugar D1: buy by market SL 17.10 TP1 18.65 TP2 19.50Seasonal lines call for bullish turn from WD-TH this week. For details write a private message to get a reference to comprehencive cycle analysis. Expected bullish development is going to proceed till the middle of Oct.

Sell stop 2318 SL 2390 TP1 2250 TP2 2175Price turned down in accordance with Fast annual cycle and fixed cycle projection lines. For details, write a private message to get a reference to deep cycle analysis. Current decline is going to proceed till the end of Oct.

GME: RSI Update, Dip Before the RipGood morning,
Last time we fell below the 30 mark on the RSI we saw a 90%+ move up and the other two times it fell to this level we saw 50-100%+ move up as well. I'm factoring in a 60%+ move up as this is like a spring that has been compressed and is ready to explode. I also overlayed November 2021 cycle and it looks like we're following that perfectly.
Downside PT: 22.12 / 21.87 (support)
Upside PT: Fill the gap at 27, 37 and 40.
As always, NOT financial or sexual advice. Good luck!
