Cycleanalysis

BTCUSD BTCUSDT Pop Alert by 8pm tonight!Based on my cycle theory there is a strong chance BTCUSD pops at or by 8pm tonight. This is on a pretty large chart so there should def be an attempt to the upside. Based on the fact it already tested the cloud and failed. This would be the second opportunity for it to go.
by iCantw84it
07/04/2022

Bitcoin long term analysis - (2012-2022)If the older chart patterns serve as an indicator to predict future movements, we can conclude that the price is not far from establishing a bottom and reaching the accumulation zone, where it previously spent months lateralizing until reaching the halving and starting a new cycle. Look
Blue vertical line - Halving's
Green area - Bull Market
Red area - Bear Market
Blue area - Accumulation zone
Yellow arrow - time period to ATH
Yellow dashed line - ATH
BITSTAMP:BTCUSD

BTCUSD Cycle Analysis | Hyper-Bullish BTC is on his bottom right now. Global BTC Cycle changed in this 2 days.
Last time this happend we had 1000% gain in the next 1-2 years.
LONG on BTC
Its comming, lads...

THINK about market cycles...
Year Bitcoin Price ($) Change ($) Year-over-year (%)
2022 47,743 18,351.22 62.44
2021 29,391.78 22,203.31 308.87
2020 7,188.46 3,318.99 85.77
2019 3,869.47 -9,542.97 -71.15
2018 13,412.44 12,414.75 1,244.35
2017 997.69 563.23 129.64
2016 434.46 120.54 38.40
2015 313.92 -456.51 -59.25
2014 770.44 757.13 5,690.96
2013 13.30 8.04 152.56
2012 5.27 4.97 1,655.90
2011 0.30 0.21 249.65
2010 0.09 0 0

Is NIFTY50 in correction or crash mode?Update on last 4 NIFTY Predictions : 4/4 Correct with precise targets.
EMA150 is very curious.
In the 4 drawdowns of bear markets, it has touched when it was a crash
It bounced off from around 25% when it was just a correction
Sep 2022 - Looks like make or break. Coincidentally US Recession is more or less confirmed that month since June quarter GDP data is out. (2 Q -ve GDP is Recession)
EMA200 and EMA100 were conclusively broken or untouched at monthly for me to make any assumptions.

So when are we buying crypto again?Just a case study that I wanted to share with you guys
like and leave a comment if you enjoy it and find it useful XOXO
first let me introduce you to this chart: BTC.D
keeping it simple, BTC.D or Bitcoin Dominance shows you what percentage of the whole crypto marketcap is allocated to Bitcoin.
when the numbers on this chart are high, it shows you that the ALT MARKETCAP is draining, no matter what!
But, when this chart is bearish it shows you (NOT NECESSARILY!) that money is flowing from Bitcoin to other ALTCOINs.
Now let's rewind the previous cycle (2017-2018)
back in 2017, as you can see on this chart, the dominance of Bitcoin on Altcoins was completely lost and went in hands of Altcoins such as Ethereum.
That incident triggers the very memorable Alteason of 2017 which a lot of CT (crypto twitter) people like to brag about.
2017's Altseason lasted until late 2017 when Bitcoin finally tops around $20,000. as soon as the bloody year of 2018 begins, BTC.D started to pump towards high numbers.
at first, you would think that the glorious days are not finished but there is more to come for Bitcoin. But the little we knew that the great Bear Market is upon us!
The psychology of 2018 BEAR MARKET
as the market started to collapse, a lot of shit coins (not very valuable but extremely profitable in bull cycles altcoins) were losing over 90% of their value against Bitcoin,
but Bitcoin itself was losing 80% of its value against the U.S DOLLAR, so why the BTC.D was going nuts?
the answer to this question is very simple, the total market cap of the crypto market was draining, people were selling their coins and not reinvesting in lowers prices, but
there were still some investors left for Bitcoin, and you may forget that the BTC.D shows you the "percentage" of the dominant of Bitcoin over rest of the market, now when
Bitcoin was dropping hard in price the rest of the Altcoins were dropping even harsher and more. but I like to keep it dramatic so this is my favorite approach to this question:
Altcoins were about to Parrish from the market forever and left illiquid for the rest of their lives, but Bitcoin still had its bitcoiners, the people who bought literally above $19,000 or so, with the dream of selling their coins at 100,000 UNITED STATE DOLLARS. sounds a bit familiar, doesn't it?
so in reality you would expect the whole market to collapse together, but the big boys always survive. just like coronavirus and what it did to tiny little startups and entrepenures back in 2020.
Those who survived were left to tell the tails
Now the numbers are too low for people to even think about the $100,000 goal, the dream was finally over. so the market continued developing...
you may find this childish but the market actually breaths the same air that we breathe, it is alive just like us. as we approach the next HALVING for Bitcoin, the accumulation phase began. smart money was here way before retail investors dare to reactive their wallet addresses again. in that final phase we saw that Bitcoin dominance tops just after the Halving and the cycle repeats itself once again.
So what is my speculation
Yes you read it right, this is all speculation and not fact so, please do not consider this as financial advice.
we are obviously in a bear market and as I show you on my chart, the next time we can expect strength and smart money to come back to the crypto market is the next halving ( May 2024).
1- we haven't seen it all yet, another -50% on your favorite Altcoin is not out of mind
2- accumulation phase begins just after the capitulation phase, 2023 near the next halving will be a good time to invest.
3- don't try to catch any knives, prices won't skyrocket in one candle. it takes time and a lot of manipulations.
4- be patient, we can bounce 30% but the reality is the same, the next bull cycle is in 2 years ahead of us so keep your targets as low as possible
5- don't be greedy, with your longs and your shorts
6- GL

BTC Cycle Bottom?BTC has historically dropped 82% from cycle highs to cycle lows. This cycle was a bit different in that we had a double top sort of pattern, instead of the typical blow-off top. We did not reach the top of the historic parabolic channel, which would of put us at roughly 100k. An 82% drop from 100k would bring us down to around 18k. What if we break 20k and bottom around 18k, perhaps a bit lower? I think the bears would then be calling for 12k. BearTrapSet?

Bitcoin Bear Bull Bottom TimesJust created it for myself but can't keep this away for some of you.
Simply illustrated some times it took for Bitcoin every halving cycle to reach the bottom, top and the total bottoming time.
Enjoy

Bitcoin - a nice looking long entryWhen four cycles bottom and turn up simultaneously traders have attractive entry points because new up cycles will be pushing price up strongly

BTC - strong rally powered by four up cyclesThe Indicator detects points where multiple cycles top and bottom.
This morning four cycles made bottoms and simultaneously turned up. Their combined power is whet produced such a strong rally today

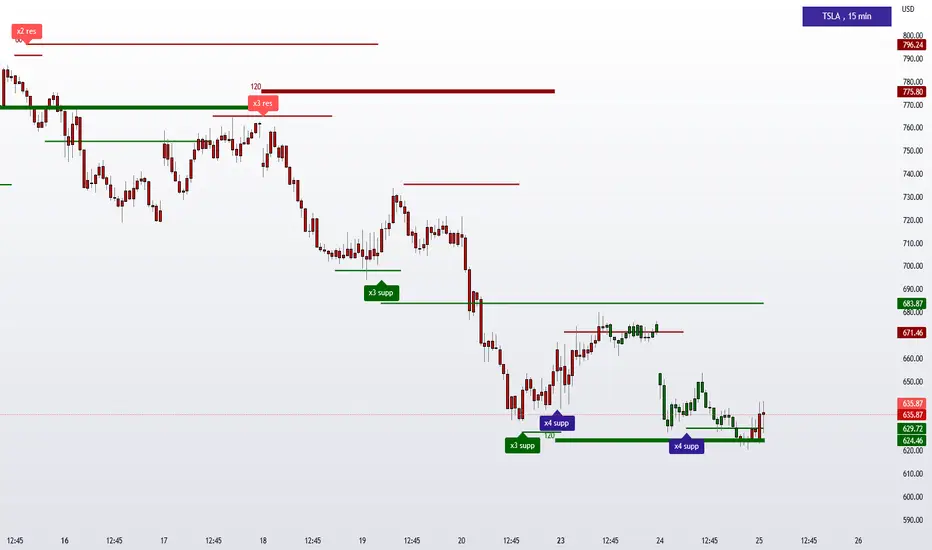
TSLA is rallying off the quadruple supportYesterday I noted that TSLA had a good long setup to rally after several cycles simultaneously bottomed and turned up.
Today we are getting a follow through

NQ - Very strong bullish reaction to the fresh triple supportThis morning three cycles simultaneously bottomed and turned up.
Their combined power is what produced that strong rally

TSLA is at an important bottom formed by many down cyclesTSLA is at an important bottom formed by many down cycles
Silver looks having topped in a corrective bounceAccording to principle of synchronicity proposed by JM Hurst, from time to time several distinctive cycles reach their respective bottoms simultaneously. In other words, cycles get aligned at bottoms or troughs.
However, cycles reach their peaks in asynchronous way! This is why when we deal with a big cycle topping normally it creates a string of multiple peaks. I marked up those triple tops with red arrows for you.
Imagine a train with several trucks that goes over a bridge and then goes down the bridge.
And those trucks reach the top of the bridge one by one. This is exactly how cycles reach their peaks!
That means that you should not expect a strong rally to turn down on a dime right after the first topping signal.
You may consider two first topping signals as quick short opportunities and wait for the third topping signal to build a swing short position.
The red horizontal lines are levels of resistance produced by peaks of different cycles.
The thickest red lines are those that come from the strongest cycles that move price on higher timeframes.
Quite often those strong cycles would NOT be the last to top or bottom! Quite often the last one to top would be a micro cycle from a lower timeframe.
What I see as a good shorting setup is when price overshoots the resistance of a thick red line, a resistance printed by a cycle from the highest timeframe and hits a micro resistance of a minor cycle.

How To Spot Economical Cycles Top Using [DXY- SPX and VIX]
Hi Everyone
In this video I want to share an overview of the importance of economic cycles for traders and investors and how we can use Trading View charts
with no indicators to figure out key economic signals on the following charts:
DXY tops for the end of previous bear markets
VIX normal ranges vs Bear cycles ranges
The Dow Jones Industrial average is another key chart with SPY charts because everyone has a 401K retirement account these days and people are use to the headlines of the Dow Jones Industrial Average new highs and new lows to shift emotionally between despair and exuberance. It's not unusual for people to throw in the towel just as the market begins to rise in the next economic cycle.
As a student of the markets, you need to know when it's time to load up on bargain priced assets and ride the next cycle up and when it is time to slowly sell or fade into the tops of the markets and avoid the downturns.
Are we in a normal healthy correction 10-20% or are we heading toward the Great Depression type 50% correction from the top? These charts will help you answer the question.
Mastering the market and economic cycles is the key to becoming wealthy in all asset classes - Stocks, Real Estate, and Cryptos
Hope it helps...
@Marc

ETH Forecast (Fibonacci Analysis)Hedge Idea
( Long ):
Entry: $1899.00
Entry Date: July 4 - Sept. 07
Price Target: $4,000.00
Target Date: Q4 22' - Q1 23'
( Short )
Entry: $4,000.00
Entry Date: Q4 22' - Q1 23'
Price Target: $1899.00
Target Date: Q2 23'

BTC Meta-Cycle Completion in SightIt's been a rocky (and likely stressful for those who are not properly hedged against negative BTC price movement) few months for crypto, but here's my take on the situation for BTC/USD
So there's some good news and bad news, and neutral news.
Bad news first : There's definitely more to go, we haven't completed the cycle just yet and smart money knows a better entry point is incoming.
Now the good news! The end of the cycle is in sight.
In neutral news: We can predict this cycle because we're almost completely done with it, but we have no indication of what the next cycle will bring. My belief is that it will be a generally bullish but highly volatile period as smart & big money enters near the bottom, shakes out retail, forms new local tops/bottoms, shakes out retail again, rinse, repeat, until we see a bullish confirmation (listed in point 3.)
Why do I think the bottom is not in?
1. Oscillators indicate a very strong continuing bear trend on 1D, 12H, 6H. It does appear to be slowing in momentum, but not price direction.
2. Money Flow Double Top: This indicates that traders were as interested in BTC @ $40k as they were at $35k. Although a drop in capital inflow (MFI) indicates retail traders are at the whim of market conditions (aka. continuation of trend to cycle completion) it also means there is a lack of capital to reverse the current trend. New capital at a bottom is a prerequisite for a reversal.
Cycle Completion: Cycle completion for any "mature" (blue-chip) asset generally occurs at the average closing price upon which the current meta-trend was realized (confirmation in Jan 2021 that close above 2017 ATH was "real", allowing capital to safely enter the market.
3. A trend reversal that continues to close up through $31k past $34k without closing below $31k during the time of that trend . Would a) invalidate the current projection, and b) provide confirmation that capital can safely enter the market for positive gains.

When is Best time to Buy and Sell Bitcoin #BTC #CRYPTOCURRENCYIn this chart i will look what has happened and break down:
-Best time to buy/sell Bitcoin
-Percentage gains
-What are things to consider for the next cycle
-What have we learned from this cycle (3rd Halving)
If we look closely, we see that if we buy Bitcoin at the Halving on every 4 year cycle and hold for 1 year, we would have received the best return on our investment (of course, not counting if you bought in the very beginning and still holding).
If you don't know what Bitcoin Halving is, please look it up because it is an important phenomenon.
What percentages have we seen over the past 3 Halving?
-1st Halving Bitcoin would have returned the most: ~10000%
-2nd Halving would have returned: ~5000%
-3rd Halving would have returned : ~800%
-What are things to consider for the next cycle/Halving?
As you can see, every Halving the percentage gain decreases. This is true for everything. The early on investors take the biggest risks, but they have the highest rewards.
How can we tell for sure that the cycle is over? No one can time the market so the best thing for an investor is to do it is own research and have a plan of when to enter and when to exit. People often asked me how did you do? Well, last time (2017) I was fooled and held and it crashed, but this time around i bought it early on and sold 75% at 50k and left the rest to run. All my friends keep joking about how I would miss the biggest profits because BTC would go to 100k or 300k.
When it comes to trading or investment, profits are profits and we must take them along the way.
If the word: HOPE ever crosses our mind, it is time to sell or not enter the market at all. HOPE does not exist in trading. We must have a plan on when do we enter and when do we exit. You are in either for the long term and handle all the Ups and Downs or you are in for short term trading. You must find your niche.
-What have we learned from this cycle?
For sure the biggest learning lesson for me came with which coins returned the most. Useless Coins with no purpose like Dogecoin, Shiba, Safemoon, etc returned the most if we followed the masses and got in and out.
What we will see in the next cycles will be the same. If we want to get 10x returns, we can scalp what is the news / reddit's / youtube's hottest topics and make some attempts to find another Coin that will boom. Small investments earlier on could return big time.
I also learned that when the masses are too excited about something, we need to be cautions. In the end 2017, the Winklevoss twins were all over the news how they became the first Crypto Billionaires and how we could also become Millionaires with Crypto. Shortly after, the dumping started.
This time around, I was prepared. Around April 2021, I was seeing every where discussions about how to turn 1k into 10k and 10k into 100k, Professionals quitting their jobs to become full time Crypto traders. When these type of news start circulating, we need to be cautions. I started slowing down my investments, taking more profits and started taking the backseat. We now see that the speculators are out and the bull market is over. Best now is to trade short term patterns and wait for the next big opportunity around May 2024.
How will I prepare myself for the next time around?
One think that became very notable is the new Coins that were created since 2017: Ethereum, ADA, IOTA, BNB, Solana, etc. If we take Ethereum as an example, we notice that while Bitcoin returned ~800% this Halving Cycle, Eth returned ~1500% and ADA and BNB over 2000%. So what this tells us is that Alt coins will be the highest risks, but the highest rewards.
Another very interesting point to make is that 2014, 2018 and most likely 2022 will be the worse returning years for Crypto, however, as you can see in my Chart, I drew trendlines in Red that showed that once Price breaks the Trendlines Upwards, a new accumulation and cycle begins. So waiting for the trendlines to break would be the best time to start accumulating.
It is also worth noting that even with good timing to enter the market, you can see in purple that no one can predict unexpected Events like the Coronavirus that pretty much tanked all the markets. Bitcoin dropped ~50% in a couple of weeks.
Successful Investing is the ability to manage risk and foresee possible opportunities in the near or further future, prepare ourselves and take the risk when the opportunity presents itself.
Invest safe and Happy trading.
As always, appreciate the like, comments and share.

Bitcoin J/S Local H/L Historical + 2022🔑 A mathematical formula reveals local tops and bottoms in the price of Bitcoin. This is not to be used alone, but rather, it integrates nicely with a plethora of various harmonics and cycles.

LiNeS BTC mAkEs (updated)Updated Lines, the description updated in the old idea, too lazy to redo new one,
click link/chart below to see the history of progression and thoughts at the time of each update over the years, cheers =)

$DUSK - "BE GREEDY WHEN OTHERS ARE FEARFUL"Predicted this dump months ago...
Now its time to... ACCUMELATE.
Thank me later anon.
zkrollup tech play.

BTC Cycle "Roadmap"This is just a cycle-based roadmap for BTC's upcoming price action. In addition to the circles and vertical line correlation there is also a notable white-cross in play on the Tesla Coil ML indicator, which also occurred during the last cycle. As you can see, the proportions have been quite different this cycle, so don't expect the white bars to play out exactly as shown. Use Boom Hunter XL , COG XL, and real TA to trade safely.
