BLX Analitics 0.02BTC on a macro scale (weekly logarithmic)
Seems to have found, by stretching its cycles over time, an interesting new resistance in its bull markets.
It seems that the 100MA on this chart is beginning to take on real relevance as these cycles have stretched out.
---------------
BTC en escala macro (semanal logarítmica)
Parce haber encontrado mediante el estiramiento de sus ciclos con el paso del tiempo, una nueva resistencia interesante en sus mercados alcistas.
Parece que la 100MA de este gráfico empieza a tomar verdadera relevancia al haber estirado estos cilcos.
Le prestaremos más ojo como soporte y resistencia para las nuevas formaciones del gráfico,
las mayores escalas siempre descifran las verdaderas intenciones y fuerzas de un mercado.
Cycleanalysis

GBPAUD Trade Idea - Elliott WaveLet’s discuss the price chart of the GBPAUD currency pair based on the 480 minute timeframe.
From the Elliott Wave perspective, the price has completed the 5 wave impulse sequence down on April 5. From that point, we have been trading higher in a corrective formation which appears to be carving out a W, X, Y pattern.
From the Hurst Cycles perspective, the composite model line which measures the combined cyclical pressure, bottomed on April 3 (green vertical line), and is projected to form a top on June 17.
Based on this, we can expect prices to move higher after the minor X (circle) is complete, which should be within the next few days or so at the latest. The price should continue until it reaches a distance equivalent to that traveled in wave W (circle).
If you find this analysis useful, make sure to press the “Like” button and Follow us.

Cycles That Govern Bitcoin
“The Sun and planets represent the spiritual consciousness in the heaven world ; the signs of the zodiac represent the astral or psychic consciousness ; and the houses of the horoscope as a whole, represent the physical consciousness.”
― Alan Leo

EURGBP Trade Idea - Elliott WaveLet’s discuss the price chart of the EURGBP currency pair based on the 480 minute timeframe.
From the Elliott Wave perspective, the price action has recently completed an ending diagonal triangle formation. The price is trading within Wave 3 (circle). The most recent retracement is approaching a 78% Fibonnaci level.
From the Hurst Cycles perspective, the composite model line which measures the combined cyclical pressure, bottomed on April 1 (1st vertical line), and is projected to form a top on April 29 (2nd vertical line).
Based on this, we can expect prices to find support at or near the current level and start trading higher towards the 0.8599 level which is the next major resistance area.
If you find this analysis useful, make sure to press the “Like” button and comment.

HOW-TO: Cycle analysis helps to detect important turning pointsThe concept of cycle analysis has enourmous power to detect and project important points in time when markets might turn. Cycles work in the time domain and therefore offer additional value to technical analysis. As technical analysis is mainly driven by price, cycle analysis offers a view on another parameter: Time. The most important situations occur when time-based cycle projects come into alignment with price-based technical analysis.
Therefore, every trader and analyst should also pay attention to time-based cycle analysis. My objective is to offer tools and improved technical indicators on this platform to combine cycle analysis with technical analysis to help in detecting important turning point.
This idea is a summary and real-case example on how time-based cycles gave us the exact pre-information on the expected market top during the period October 2021 to 2022. All has been freely avaiable to the public without any need for subscribtion. Check the signature link.
Time-based analysis requires additional tools which are not available directly on TradingView yet. Therefore we must reference additional tools to detect relevant cycles. The public announcements based on time-based cycle analysis on the global markets are labled on the chart "Weekly Cycles Rolling Over" (Oct.2021) and "The Calm before the next Wave" (Jan.2022). Look for "The clam before the next wave" via the signature link. They are freely available for your review and have been posted in advance. We will continue to bring more and more of our cycle tools directly to the TV platform, as Pine will allow us to do so.
Once you know the dominant cycle (length), you can use this information to improve your technical analysis on the price chart. I do provide different free indicators here on the TradingView platform which are free to use in your own analysis. Please see the linked related ideas which provide access to these indicators for your own free usage.
The key is do use the known dominant cycle as input for these indicators. Once the "correct" input is given - these indicators will reduce noise and will make the turns visible on the price chart. The following example is using one of the indicators available here on the TradingView platform. The cyclic tuned RSI indicator:
1) The first indicator signal occured already in May 2021 when to signal line crossed below the dynamic upper band of the cyclic smoothed RSI indicator. While the weekly cRSI is also overbought, indicated by the red background. However, this technical signal occured not in the projected timing window which was given by the dominant cycles. The cycles still have been in their upswing phase on the weekly and daily cycles. So at point (1) we had a technical sell signal. Which was not confirmed by time-based cycles. Time and price have not come into alignment.
2) The second indicator signal (sell) occured in November 2021. When the signal line touched the upper band and reversed, while the weekly cycles have been in overbought situation (red background). This time now is different because the time-based cycles have rolled over! The upswing cycle phase has ended. This was published based on the the time-based cycle analysis "Weekly S&P500 cycles rolling over" on October 2021. So now we have an alignment of the technical cyclic tuned indicator and confirmed by the weekly cycles which have rolled over now indicating a time-based top. Price and time based cycles have come into alignment. There is no misinterpretation possible. There are no other sell signals or buy signals following this method. A clear top/sell signal in November 2021, after the time-based cycle analysis was published in October 2021.
3) The third indicator signals (sell) occured around 12. Jan. 2022, once the divergence between price and the indicator top has become visible. This price cycle signal (divergence) was supported by the time-based cycle analysis published on 18th January, labled "the calm before the next wave". This time, again daily time-based cycles and price cycles from the shown indicator have come into alignment. Again a clear signal that after the weekly cycles (see #2) now the daily cycles have joined the bearish camp confirmed by the divergence signal at the same time on the price chart.
Thats how you can use cycles to improve your trading skills.
Join the livestream to discuss the analysis and how it can be used on the TradingView chart:
www.tradingview.com

IoTeX - To the moon ? - based on log chart channelEverything is in the chart...
Disclaimers:
!! This is not an investment advice and you shouldn't follow this setup !!
!! Never invest/trade with more money than you can afford to loose !!
------------------------------------------------------------------------------------------------------------------------------------------------------------
That's pretty much it! don't forget to ask if you have any questions!
If you want to follow me on this long journey ahead of us, you can support me by subbing and liking the post !
-Credits to xtekky-

ES-mini - this up cycle is ready to topThis rally has been driven by 240 min up cycle since Feb 4th.
The Cycle Trader Indicator has just detected signs of topping.
The indicator printed a new cyclical resistance on 240 min chart at 4,603.
Bulls may try to test it tomorrow. Failure at that resistance would confirm completion of an up cycle and start of a new down cycle.

ES and NQ - broke out overnight driven by 4 hr Up CycleOb Feb 3 we got a new cyclical support on 240 min charts of ES and NQ.
On Feb 4 bears tested it two times and failed to break under it.
Then price turned back up strongly and has been pushing price higher.
Overnight both indices broke over 60 min resistance, jumped over resistance but then came back down and retested the broken-resistance-turned-support from above.
Then price turned back up again and accelerated its move up.
Today we should expect a pullback making a higher low printing a new cyclical support (over the broken resistance on 60 min charts ) together with the Strong Buy signal.
That would be the next attractive trading setup.

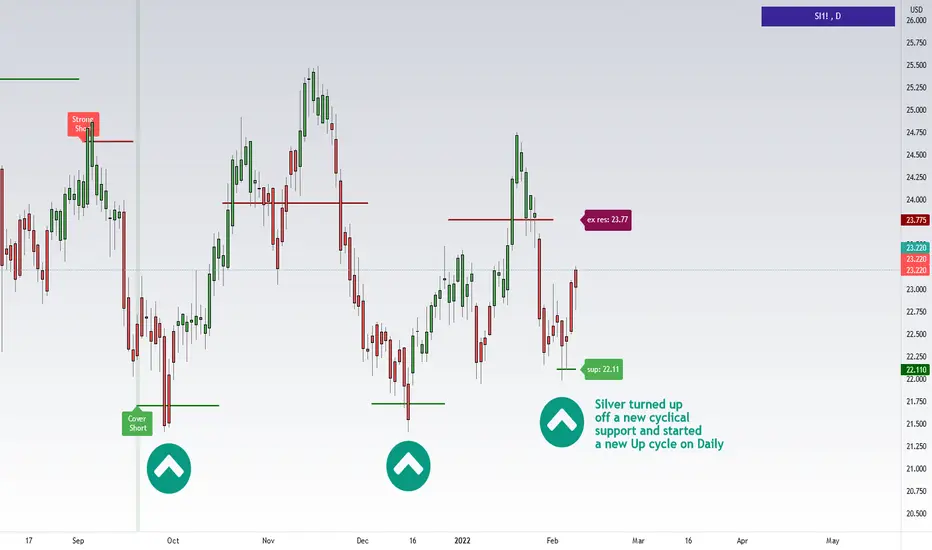
Silver started a new bullish cycleSilver turned up off a new cyclical support and started a new Up cycle on Daily
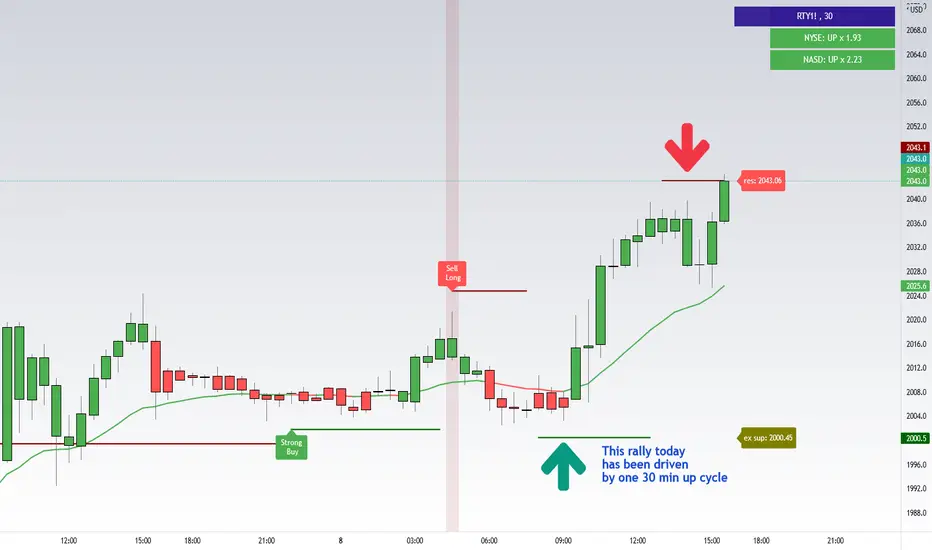
RTY - One 30 min cycle has beed driving that rally on TuesdayRTY - One 30 min cycle has been driving that rally on Tuesday
Market Moves in 3's and 7's ETHPlease observe the red and blue lines. Notice that the market moves in increments of 3's and 7's within various time scales. These numbers are sacred and biblical by the way. Anything that has been given to you, has been given by the grace of our creator.

GOLD short term Elliott waves updated 18/Jan/22Gold. It seem like we're in "Bullish Triangle pattern now". AND most likely wave 4 (yellow circled). PLUS+++ a possible "stop hunt" on wave (E) (green) . So.. I've changed my view from previous "normal" expanding flat (a)(b)(c) Red to Complex Double Three Expanding Flat which is (w)(x)(y)(Red)

Bitcoin Current Cycle compared to Gann & Hurst Nominal Cycle ***IN REFER TO MY PREVIOUS ANALYSIS ...I thought that it was a good idea to republish it as chart was not clear in my previous Analysis...I have now enlarged chart and added some more information...hoping its more clear now-
Even if we do not have a lot of datas on Bitcoin using what we have we can see the following patterns :
- October 8th 2010 a 10 years Cicle started with Wave 1 ( I presume that this is 1/3 of a 30 years Cicle...but this is only an assumption for now as there are not enough data to confirm )
- June 8th 2011 End of Wave 1 with a Top
- November 19th 2011 End of Wave 2 with a Bottom
- November 30h 2013 End of Wave 3 with a Top
- January 14th 2015 End of Wave 4 with a Bottom
- December 17th 2017 End of Wave 5 with a Top
Then we had an ABC correction Pattern
- December 15th 2018 End of Wave A with a Bottom
- June 26th 2019 End of Wave B with a Top
- March 13th 2020 End of Wave C with a Bottom
10 years CICLE ENDED
The entire move started on October 8th 2010 to December 17th 2017 could be Wave 1 of what I think it could be the 30 years cycle and it completes the 7 year Super Cycle Top
The entire correction move started on December 17th 2017 to March 13 2020 could be Wave 2 of what I think it could be the 30 years cycle and it completes the 3 year coorrection Cycle Bottom
NOW :
- a New 7 Years SUPER CICLE STARTED with Wave 1 starting on March 13th 2020
- The 30 Years Cycle is on Wave 3
If the future is but a repetition of the past I think that we could see a major move up considering the Sum of 3rd Wave of 30 Years Cycle and Wave 1 of the 7 Year Super Cycle that are both bullish and pushing in same direction.
Legenda :
7 YEAR BULLISH SUPER CYCLE WAVES IN GREEN
30 YEARS CYCLE WAVES IN BLUE
*** Additional Note :
7 Years MA in Blue provided perfect support to both Bottoms on December 15th 2018 and on March 13th 2020 confirming that the 7 Years Cycle is in place and running.
Bottoms on December 15th 2018 and March 13th 2020 where Wave A and wave C of Correction pattern ABC
*** Additional Note :
- BITCOIN CURRENT CYCLE ( 3444 DAYS ) ...Tradingview is only counting 3439 days because probably some datas are missing for the initial phase of Bitcoin Chart...but if you take the real dates I get 3.444 Days
- HURST NOMINAL CYCLE ( 3273,6 DAYS )
- GANN 10 YEARS CYCLE ( 3600 DAYS )
-VARIATION:
170,40 DAYS COMPARED TO HURST NOMIMAL CYCLE
156 DAYS COMPARED TO GANN 10 YRS CYCLE
Just quoting William Delbert Gan now:
"”The next important major cycle is the 10-year cycle, which produces fluctuations of the same nature and
extreme high or low every 10 years. Stocks come out remarkably close on each even 10-year cycle. The
minor cycles are 3 years and 6 years. “” - William D. Gann -

Bitcoin Cycles RevealedJEH O VAH know that you are the blessing of the light.
Yes, anointed ones have come to understand much about the sacred secret, and they have shared such knowledge with millions. What a privilege all of us have!

SPX Long TargetDYOR
Bull Case:
MACD : Bullish
Crossover
PRICE: Close above resistance level?
Volume keeps price moving up
Long target 4895
Thanks!!

Bitcoin Bull Cycle Over?Could this cycle be over, or gearing up for another strong bullish push? What are you thoughts?


VET/ETH CyclesAnother cyclic structure is playing out on the VET/ETH charts.
Based on previous move lengths, I am expecting a VET/ETH peak at some point in the green box after hitting the yellow box.
RSI also suggests that we have hit a bottom.

BITCOIN ATH PROGRAMMED IN LETS SEE IF HISTORY REPEATS ITSELFBare with me on this chart, it may look a bit messy when you don't know what it is you're looking at so I will try and break it down as best I can.
We know that Bitcoins market cycle is over a period of 4 years. Whereby we see a year long bear market, followed by an accumulation period moving up to Bitcoins halving event, which to date has arguably been the trigger that initiates the Bitcoin bullrun which in turn triggers the rest of the market to start following Bitcoins appreciation.
The data shows that in 2013 price hit its ATH at the 2.272 + 15%, in 2017 it did the same and in 2021 if history repeats itself the projected ATH for Bitcoin will be circa 233k. Just because this has happened before doesn't mean it'll happen again, however until this pattern fails to replicate I will continue to follow it.
With past Bitcoin bear markets we can expect around an 85% drop from its ATH. In 2013 it was 86.75% & in 2017 it was 84%. So if Bitcoin hits it's 2.272 this cycle and over extends a 85% drop from 233K will bring us to around 30K. This is a strong support level which further backs up this theory. we may see a small over extension to around 26-28K, but again looking at history Bitcoin has never revisited a previous ATH and tested it as support.
With this being said assuming history repeats itself, we now have the Top and Bottom for Bitcoin already programmed into the charts. This would make sense given what Bitcoin is but it has yet to be confirmed/proven. If this pattern continues it will become clearer and clearer that these prices are all programmed in already.
2021 BITCOIN NEW ATH = 233K
2022 BITCOIN LOCAL BOTTOM = 30K
Bitcoin likes to spend around 52-58 weeks in a bear market before the bottom is formed.
After the bottom forms Bitcoin has taken 142 weeks (2013) & 150 weeks (2017) to reach its ATH. Currently we are on the 154th week. Meaning Bitcoins ATH is imminent in the next couple of weeks. If we assume Bitcoin takes another 8 weeks on top of what it previously took to hit its ATH in 2017, then that puts Bitcoin printing a top on 06/12/2021. In terms of the pattern being an increase of 8 weeks every cycle, there isn't much data to go off on this, but as it stands. This is the longest Bitcoin has taken to hit a new ATH. So we know at least that the data shows that every cycle Bitcoins ATH cycle becomes longer. Essentially from this point onwards we can expect Bitcoin to go parabolic and hit it's ATH before initiating its long bear market. In line with a pending economic crash? 2022 will be a very interesting year but one thing is for certain. it will be the year where generational wealth is achieved.
SO HOW DO WE KNOW WHEN BITCOIN WILL HIT ITS ATH???
The reason I chose the 2WEEK candle chart was to illustrate the importance of the 1.618 fib extension. In 2013 and 2017 respectively a 2 WEEK full body candle closure above the 1.618 lead to a parabolic move to the 2.272. Currently in this cycle the first week has already closed above this threshold, we're now looking for a second weekly close above 60400, to complete the 2W candle. Once we get the 2W close above this zone, history again dictates we will be seeing 2.272 very soon, within a matter of weeks. All eyes on the weekly close commencing this Sunday. The most fun part of the bull run is almost here, remember to set sell targets and take profits. No one ever went broke taking money off of the table. Don't think price will never go back down. You're most likely very wrong.
Finally just to round this up. If we draw a Trendline from the 1.272 bottom we can see historically during the mania phase of Bitcoins bullrun this has held up until Bitcoin hits the 2.272. After the ATH has been printed similar to the 1.618 theory. If we get a full 2WEEKLY body close below the Trendline, this is confirmation that the bear market is in and we should expect lower lows and lower highs until the bottom is in. Bitcoins next top is predicted to come in December 2025 which is even more interesting and backs up the fact that all this is programmed. Can you guess when the next top will be? It's a conversation for another day but all this seems to fit in perfectly with the WEF's Great Reset Agenda. LOL.
According to the data, Bitcoin should print its new bottom around Dec 2022/Jan 2023. This is where I'll be buying. Until this it's sell the rally and wait patiently.

MANA Finishing It's Retracement before next rise LevelMANA/USDT
Consolidation before continuation to the upside..

TOP REACHED ⚠️ It might push a bit higher until the upper trend line, then we will eventually have a bigger and catastrophic down turn. The global economy is sick.


BTC E-wave cycle with supply zoneBTC completed his impulsive and corrective cycle. now try to look for respective supply zone as i mentioned above.
btc is mega bullish according to all recent technical analysis. so there is maximum possibility to touch the respective supply zone.
Hit LIKE and Do FOLLOW for day to day crypto updates based on different indicators and technical analysis.
Thank you.
