Hidden Periodicity and Pitchfork Suggests Short-Term SupportCAD is otally coupled with the price of oil, which is the major factor in this currency couple in recent times. The fact that EUR gained a lot during the first COVID-19 lockdown was mainly due to the price of oil going downwards. This was evident as well during the recent Suez canal blockage, which started a new bullish run for oil and a pull back for EURCAD. Yet, there is a hidden pattern at play here, one which can be shown using the sinusoidal of wavelength 5 months. The prices have been going up and down consistently through this pattern since a couple of years, mainly due to market dynamics, often augmented with political events.
Following this pattern, you can see that we are approaching a crest in the sine wave, yet we are a law low point in the dominant bearish trend. Also, oil prices are increasing since the Suez crisis, which suggests that the pattern might not be followed. Yet, careful pitchfork analysis shows that we are currently at the line of support, which is also confirmed by the lower Bollinger band, as well as the almost over-selling RSI.
The bearish trend doesn't seem to be waning anytime soon, since most of the action is take place in the lower side of the pitchfork. However, for the short-term, the price is going higher and now sounds like a good short-term buy.
Cycles

Bitcoin - possible end of cycle and decline to 0,62 FiboBitcoin - possible end of cycle and decline to 0,62 Fibo.
I excluded the March 2020 crash and limited to 0,62 Fibo from bottom of Dec 2018 to Jul 2019.

BTC divergences 2017 and 2021 side by side. Corrected. So, following the theory that we are repeating the 2017 cycle but with the plus that we also are repeating the divergences from that year, on my previous ideas I put the short target down to 42k/30k based on the smaller divergences results: the price correction coming out from the divergences take the price down to the same price as when the divergence started. BUT that rule didnt apply for the big 2017 divergence, it only applied to the smaller divergences within the biggest one .
According to that same rule, we already touched the bottom price for this current divergence.
It only worries me the fact that this last divergence took a long time to develop and we are kinda stuck on the same price. Anyway we should start the bullrun again from now on.

Where are we?Looking backward BITSTAMP:BTCUSD ended its previous bull runs at the 0.786, measured from the previous dip to the next all time high and projected from the latest dip (check my previous analysis).

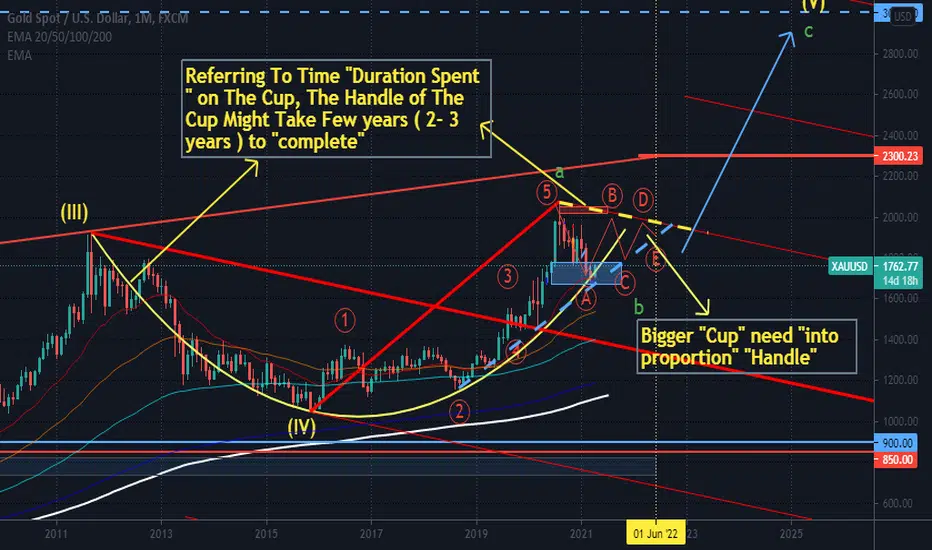
Gold: Yeah, I know ... I know ...Yep, looking extreme, but .. If you're experienced about fractals & Elliott Wave Theory concept, you know it looks appealing, eh?
(Please ignore the TIME axis, I wanted to point out to price levels & potential wave cycles)

Gold Bigger "cup" need bigger "handle"..Updated 16 April 2021As the cup take many years to be "molded".... "to match "into proportion".. The handle of the cup might take few years to be form...
EUR/USD Buy Cycle exhaustedHello traders, based on the Cycle Analysis, Buy Cycle is exhausted in the 4H and possible Sell Cycle beguine, the Sell cycle may end on one of the Cycle End levels. Stay tuned.

GOLD short term view. Updated 14 April 2021Short setup, SL @ around 1759, TP @ around 1690 .. Detail @ The Chart

Bitcoin reaching the $65.000 target, what's next?Almost 2 months ago, i shared my thoughts about Bitcoin and it's previous cycles. (link below)
The course seems to follow the path quite exactly as I had shared before. Better than I expected.
What's my next target?
I'm looking at ~$95,000. This is purely based on the previous cycles. But as it stands, we look pretty much on the same route as before.
Thank you for checking my analysis!
Do you have tips or other comments? Tell me please! I'm open for feedback!

TOMEI gold retailer How about ↑ 100% your investment within 1 YTomei .. A Major Gold and Jewelry Retailer In Malaysia.. Possible Stock Price will exceed RM1.80 within 1 year if Gold Price Hit All Time High Again ...


SILVER waves updated 11 April. 2021Possible different type of triangle pattern for Silver beside Gold..

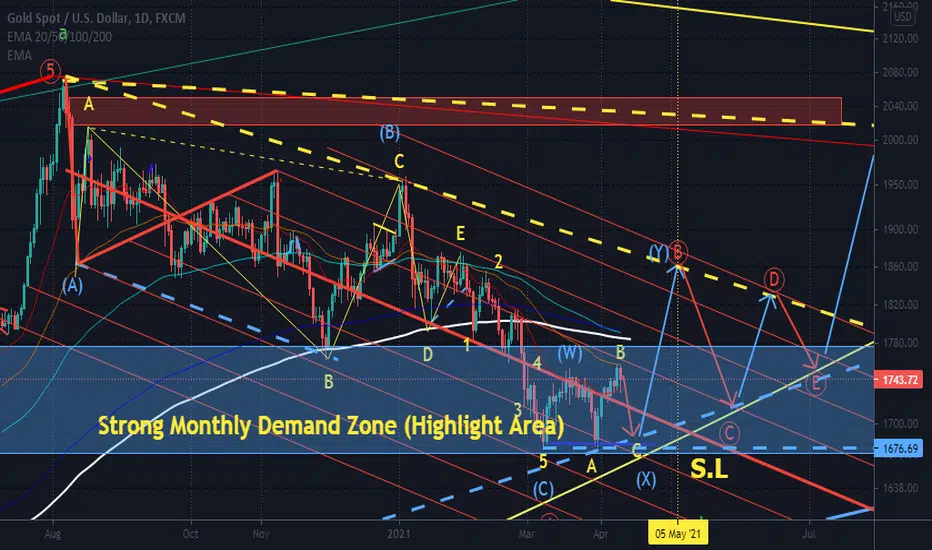
GOLD. Short TP ~1700 before price up for wave B (red circle) Short Gold to or waiting to long @ around 1700 for price trending up for wave B (red) (circle) of Triangle. As Gold Price forming double bottom or maybe triple bottom at strong monthly demand zone.. Gold may resuming its long term bull trend...
BTC RUN OVER - WE WERE TRICKEDhavent seen anyone speak about this yet so validity can be called into question
it is possible that we have finished our cycle, which is actually a continuation from 2013 & 2017
a triple-three here shows how that could be possible with what we would of referred to as wave 4, taking for granted you have the tolerance to look at something this messy
inside the primary triple-three is another triple-three which is composed of zigzags, the only contingency that could be addressed is the fact that the 2nd wave (X) on the primary triple-three should be using 0.854 instead of 1.236 - we can easily use 0.654 after the impulse post-covid and we arrive at the same spot, its just that impulse needs to be evaluated (which probably includes inserting another complex correction somewhere)
could a correction of this complexity be honest or legit? human behaviour is odd

EUR/USD turning point in 1hr chart occurs on 2021.04.08Here is a possible trend changing point for EUR/USD pair on 1H chart which will occur on 2020.04.08. It will occur on 10EST (Eastern Standard Time) on hourly chart and most likely to occur around 10.45 EST in 15 min chart.

GOLD Stop Hunt. 1 stone kills 2 birds. Updated 8 April 2021Wave (4) (Cyan colour) possible flat pattern instead of triangle 1 stone kill 2 birds. 1) Those sold will hit Sl @ last swing around 1756, Those Trade Breakout Buying @ 1756 will have Bull Trap..

Bitcoin - long term analysisThis is my analysis on long term.
Graph shows all possible cases from crashing back to 20k or rising until 150k.
Please let me know what you think in the comments. Thanks

WTI before decisionThe short-term downward trend, since the movement high of 8 March, continues to hold the black gold of the global economy in check. As can be seen impressively, US WTI oil has already been clearly rejected from this trend line several times and especially just yesterday at the start of the week. Monday's setback almost took it back to support at USD 57.40. Accordingly, the tension could not be greater. A defence of this level still allows a quick upward reaction to 62.00 USD. If there is further buying interest, a reaction to the level of 66.00 USD is possible, before the round 70.00 USD mark could be put on the agenda again. However, the dominance on the long side should come into play immediately.
If, on the other hand, the support level of USD 57.40 is abandoned, one would have to take into account an extension of the price weakness to the next support level at USD 52.00. A dip below this level would be a serious threat to the price. A dip below this level would be critical for the further course.

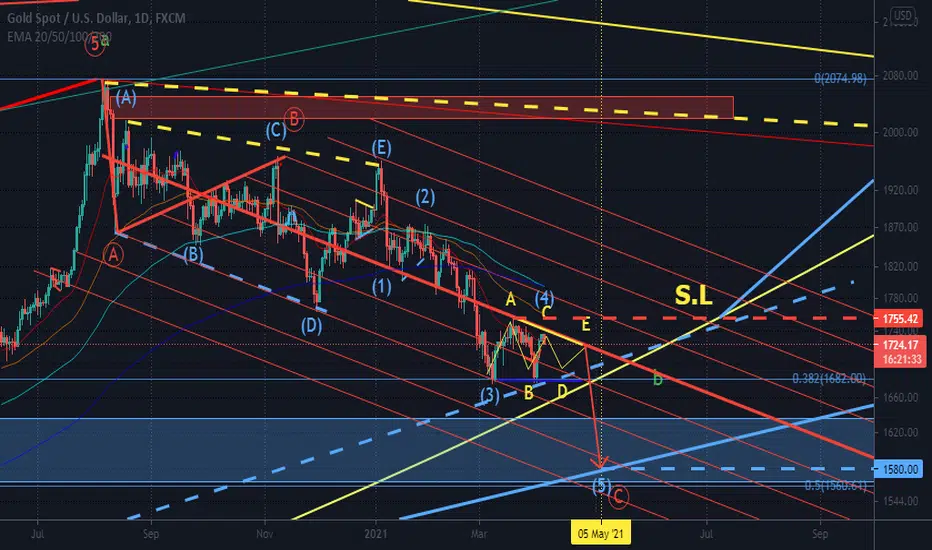
GOLD short for bearish triangle. Updated 5 April 2021SL @ around 1756 .. TP @ around 1580 detail @ The Chart.. While everyone waiting for 10 year_treasury reaching 2% rate
ROCKET LAUNCH, STAGE 1You can clearly see cycles on every indicator as well as on the candles. It looks like we are going to have a big increase soon.


Litecoin new cycle is coming1 - Litecoin does 5x over Bitcoin
2 - Bitcoin breaks out before cycle peak
3 - Bitcoin peaks at 4 year cycle
4 - Bitcoin bottom of bear market
5 - Litecoin halving
6 - Bitcoin Halving
7 - Bitcoin approaches previous all time high
Shout out @masterbtcltc

GBP/USD bearish for the momentAs we can see the pandemic is rising for third wave on Europe and the UK and on the other hand
USA vaccine is doing some work there so we looking for some bearish momentum for this week
but on the bigger cycle GBP/USD will go up do to USA big issue with printing money and coming inflation
lets see what will happen this week
