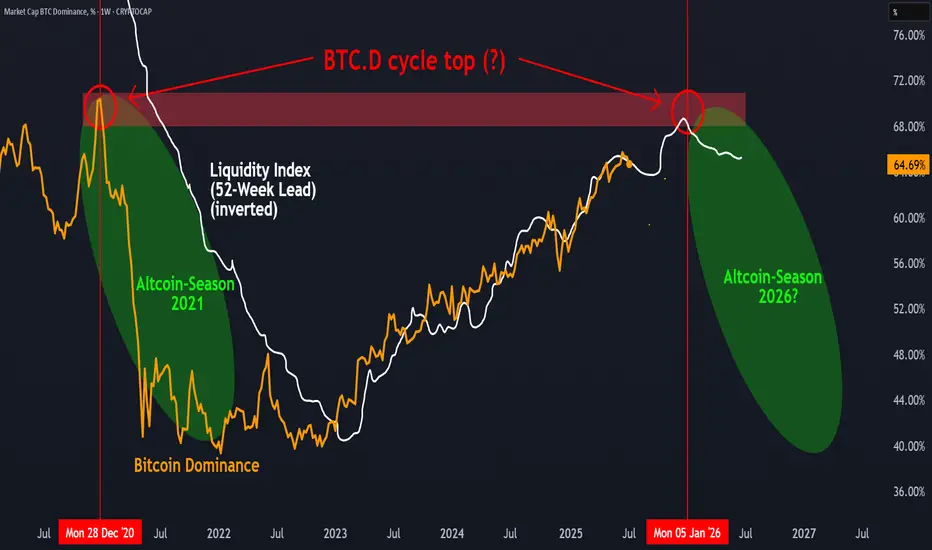
BTC.D Cycle top in?There are signs that Bitcoin Dominance (BTC.D) could be leaving a cyclical top, similar to what we saw in late 2020. When overlaid with the Global Liquidity Index (inverted and leading by 52 weeks), a potential correlation appears: previous peaks in liquidity were followed by turning points in BTC.D about a year later.
If this pattern repeats, a shift in market dynamics — possibly in favor of altcoins — could unfold over the coming year. However, this remains a hypothesis rather than a confirmed signal. The relationship between macro liquidity and crypto sector rotation is worth watching, but it’s not guaranteed to play out the same way again.
What’s your take: Altcoin Season loading or not yet?
Cycletop
RSI suggesting BTC top prices?I have my doubts and personally believe this cycle might still extend till later this year. But according to the RSI technicals this might be the top or one of them. MACD is applied on the RSI indicator. MACD has crossed what signals a possible reversal of the bullish trend.

$USDT.D Cycle Top ProjectionI could see CRYPTOCAP:USDT.D playing out like this.
This November data also coincides with my BTC Cycle Thesis in November.
Lotsa other macro factors and indicators at play for a cycle top, but this lines up nicely and where I'll be taking a heavy chunk of profits.

Speculating Bitcoin's Cycle Top!Hello TradingView Family / Fellow Traders. This is Richard, also known as theSignalyst.
📚 Back to basics.
🗓️ This is the BTC monthly log chart.
📊 By applying two simple channels—one short-term (🔴) and one long-term (🔵)—we see both upper bounds aligning right around the 💰 $300,000 mark. A classic case of confluence at a key psychological level 🧠✨
👇 What do you think—are we headed there this cycle, or is it just hopium? Drop your thoughts in the comments!
📚 Always follow your trading plan regarding entry, risk management, and trade management.
Good luck!
All Strategies Are Good; If Managed Properly!
~Rich

Bearish Logscale Butterfly T2 with Bearish MACD & RSI DivergenceBitcoin appears to be set up at the 1.902 HOP for a Type 2 retest of the Logscale Bearish Butterfly that resulted in a major Type 1 reaction from the 1.618 Fibonacci Extension back in 2021, where it dropped from $69,000 to $15,500 over the course of several months before ultimately bottoming at the PCZ of a smaller Log Scale Bullish Butterfly which signaled the Type 2 run up to the 1.902 HOP of the Bearish Butterfly where it is now. As it tests this level the MACD and RSI are both Diverging Bearishly and the RSI especially seems weak as it now struggles to even crack above 70 level. This signals to me that the RSI has confirmed exhaustion after divergence at the HOP and that it is likely ready to start declining further.
Saying as though this is the type 2 test, I'd suspect that we'd make a lower low than our previous Type 1 reaction low at $15k, perhaps landing us around $12-10k; but if those levels don't hold It would be technically viable to assume BTC would go for the 0.886 retrace at around $4.6k

CYCLE 4 | TA - First Log Measured Move HitQuick Update: Cycle 4 BTC price action has hit our first measured move (log scale) which coincides with the 1.272 Fib Extension using the prior cycles technical top and cycle bottom.
This was our first point of interest as BTC approaches our Early Sell Zone region....

Two Charts to Watch to Time the Crypto Cycle Top Here I have the TOTAL2 chart overlaying the BTC market cap chart.
- Black: BTC
- White: TOTAL2
- Yellow vertical lines: BTC Halvings
The main alpha here is identifying the moments where TOTAL2 > BTC. This means the rest of crypto is valued greater than that of BTC, people are going further down the risk curve to seek greater returns, and peak euphoria has set in. Crypto markets top after BTC has made its run and once the alts, memes, and more degenerate activities soar following the rise in BTC.
At the bottom I have plotted the relative strength between BTC and TOTAL2 (Black line) which shows that once BTC begins to lose strength to TOTAL2 (a dip below the zero line) then the top is imminent. Currently we are well above the zero line and far from the negatives which indicates to me lots of time/ room left in this cycle for appreciation (if you're in the camp of the bulls).
I have also included a YOY rate of change (white area plot) showing the sharp increases in the ROC at the tops. currently we look very flat yet positive which is very similar to that of late 2016 and early 2017.
There is not much historical data so this could be invalidated easily, but the similarities from the past two 4 year cycles is significant enough to form an idea on when profits should be taken if you so desire.
Here is a chart of BTC-TOTAL2. This chart shows the delta between the two with a clear megaphone thing going on. The alpha here is that once that ratio dumps significantly that indicates the rotation away from BTC and into the more speculative side of the crypto market.
An increasing megaphone trend this chart is showing makes sense due to the natural rise in market cap the entirety of crypto experiences. It's kind of like an average true range of the delta between the two. The swings in the ratio will widen the more the market cap increases.
I wouldn't use these as trading indicators but rather as a guideline for sentiment and when it might be wise to be super risk on or more risk off.
My belief remains that we see a big pump next year with a sustained bull run up until Q4 of 2025 and Q1 of 2026 based on previous cycles in equities and crypto.

This Time Is Exactly The SamePerfect linearity in the Mid-Cycle crossings of the BTCUSD Monthly Stochastic RSI. This Mid-Cycle isn't different this time.
Mathematically it is exactly the same as every other very (overly and early) bullish Mid-Cycle.

CYCLE TOP ANALYSIS1. BTC.D top then start falling just before BTCUSD top
2. BTCUSD then Sideway + Weekness
3. TOTAL3 keep mooning as a last stage while BTC.D and
BTCUSD slow bleeding / showing weekness (alts season) which last few weeks after BTC top

Bitcoin Hopium for You!For your ultimate fractal, let's compare previous cycles from the halving date.
Comparing previous bull runs from the havling date, the next top will occur between Feb 24 and Sep 22, 2025, at a top price of around $350k to $5.9M. Similarly, the next bottom will be between Oct 12 and Nov 16, 2026, at a low price of $100K to $1.22M.

Bitcoin CyclesEach Bitcoin boom has ended in about 85% draw down in 2014 and in 2017. Right now the drawdown is at 75% for the 2021 cycle. If we see a similar drawdown of 85% it will be at around ~10000. My guess is that will not happen and that our current 75% draw down is what we will get this cycle but if we get a drawdown to the low teens I'll be backing up the money truck.
Each Bitcoin ATH to cycle low has been 89 weeks and 52 weeks respectively. If this is the current cycle's low then that puts it at 61 weeks as marked on the chart, which is between 89 and 52. If the boom and bust cycles continue due to the halvings I'm betting this is the bottom.
Each Bitcoin previous ATH to breaking that ATH is marked on the chart. They are 168 weeks and 154 weeks respectively. If we take the average of that we can expect this cycle to take 161 weeks to work out. This puts it around May of 2024 right around the current predicted halving date.
RSI is slated for a breakout around the end of the year - we could see a mini cycle like we did in the summer of 2019 after this break.
My current prediction is that this is the time to be aggressively dollar cost averaging. I will be buying each week until my powder is dry and if we complete an 85% drawdown I will be going all in.

Bitcoin will TOP this year(2021).My thoughts on the current situation.
Bitcoin and the relationship between the bullmarket TOP and HALVING.
In the two previous cycles, the TOP of the entire growth cycle was exactly 820-850 days before the next HALVING.
Taking this into account, theoretically, we should reach TOP in December this year, and then go into
a downward trend and consolidations for the coming years.
It is worth noting that in the previous cycles, after reaching the peak(about 820-830 days before HALVING),
the distribution in the Descending Triangle formation began. In my opinion, it is likely that due to the global crisis,
the top of the current cycle was achieved much faster (64k in March) and currently we are already in distribution phase.

BTC/USD Cycle High $136K-$227K | 7 APR - 22 May 2022Uptrend begins -- 7 APR 2022
$44,500
Cycle High -- 22 May 2022
Price Will Be between:
$108,000 to 136,500 (66% probable) | 3x Uptrend
$180,000 to 227,500 (33% probable) | 5x Uptrend
Plot Settings
Fast: EMA 7 186 off set
Slow: MA 28 186 off set

BTC/USDT - 1W - Time to Bounce? Hoping BTC bounces here - price already tapping the blue 21W EMA and also retracing to the 0.382 fib extension.
First green CPR (R1) meets the 100% fib extension. Good TP zone.
Second green CPR (R2) crosses a long term white trend line. Good TP zone.
Third green CPR (R3) taps the 1.618 fib extension. Good TP zone.
Should price break down below the green trend line, look for the 50 EMA (green) and even 100 EMA (yellow) for DCA options.
Come on the Bitcoin.

150K Bitcoin Top?Posted this earlier today but it got flagged for adding my twitter handle so im posting again.
A lot of times this cycle is compared to the BTC cycle in 2013. However right now price action is looking very similar to 2017. We have bottomed out on almost the exact day in July and have been following the price movement of the second half of 2017 very closely.
The 55 EMA looks to be important to watch during these times. In July 2017, BTC had broken below the 55EMA before bottoming out, very similar to July 2021. They then proceeded to make higher highs and higher lows before having a second break and close below in September. It recovered relatively quickly from here and went on to continue the uptrend.
In both 2017 and 2021 when we bottomed in July and September, we had a double bottom on the RSI . In November of 2017 we didnt reach the bottom levels of the RSI trend during that correction but we did correct and continued the uptrend on the RSI once we tested and bounced off of the 55 EMA on the daily.
We just tested the 55EMA, and are currently looking for a bounce. If this plays out until the end of the year we could see a cycle top of 150k as soon as December 21st of this year.
After we reestablish the 7 MA next close below could be the signal that the top is in.
Good luck!

Bitcoin | Where Is The Bull Market Top Anticipated?Hello, everyone!
Last time when I made the BTC analysis, I spotted that now the price is in the local Wave 3 of the Global Wave 5, last wave of the current bull market.
Today I am going to assume where the market top can be for the current Bitcoin market.
The market clearly formed the 5-wave Elliott structure. According to Trading Chaos methodology, we should calculate the price distance between the Wave 1 start and Wave 3 end, measure this value from Wave 4 bottom – this is the higher of the Wave 5 target zone. The lower band is 62% of this distance. Thus the target zone for this bull market top is the range between $68000 and $90000.
You can be scared that the lower band have been already reached, but as I revealed in the previous analysis the local waves structure have not ended yet. I am waiting the BTC price much higher than the current ATH.
Moreover, we should see the fractal at the Wave 5 peak and the decreasing momentum on Profitunity MACD. I will tell you when the bull market top will be in my opinion. Now I am still holding altcoins and waiting the altseason.
DISCLAMER: Information is provided only for educational purposes. Do your own study before taking any actions or decisions at the real market.

Bitcoin: After the cup and handle?Sure BTC may have a little dip over the next couple weeks...but that's just the launching pad. I keep seeing this ascending triangle in my mind and I'm willing to bet something like this plays out. Most likely it won't be so nice and pretty, but end result just the same. #CupAndHandle #AscendingTriangle #ATH

BTC Bitcoin Cycle Top Prediction 2022This is my chart prediction of the Cycle top. Time will tell.......

is 230k possible? Thoughts?These trend lines are nothing new just wanted to point out some things I have been looking at.
On the weekly chart I took a measured move from the highest price point on the peak of the first RSI top to the highest price point of the peak of the second RSI top of the 2014 bull run = 575%
I did the same for the 2018 bull run and it was 576%. More confluence between the two is that the first top of the RSI peak turned out to be the following bear market support on both cycles, a drop of about 85%.
So I took a average of the time period between the two peaks 31 weeks and extrapolated from the current first peak up to the red resistance line. It was not 576% but still much higher then I am expecting this bull run to go, 470% and a price point of about 230k! its a extremely Exuberant prediction I know, but what do you think?
I have mainly been looking at the bitcoin log growth curves which give a rough top of 120k for the same time period. I feel this is much more realistic as a top and will be what I am keeping a eye on the most. Something else is telling me that this ridiculous 230k top is not out of the question though...
