USDCADHi traders, i am looking it the USDCAD chart if price go back our mentioned pattern completion area then i will be looking price action again for a short position opportunity, if price drop from the current area and break 1.37184 level without hiting our mentioned entry level then this setup will be invalidate.
If you are taking this trade so please i request you trade with your according strategy do not depend on my analysis, this analysis is just a scenario and i would love to be wrong GOOD LUCK.
Cypher

Beam coin forming bullish Cypher for upto 16% pumpHi dear friends, hope you are well and welcome to the new update on Beam coin with BTC pair.
Previously we caught a nice pump of Beam as below:
Now on a 4-hr time frame, BEAM is about to complete the final leg of bullish Cypher pattern.
Note: Above idea is for educational purpose only. It is advised to diversify and strictly follow the stop loss, and don't get stuck with trade

BTCUSD - Harmony Pattern - CypherComparing with the standards of the Cypher pattern, we see many matches (in %):
AB/XA = 58.6 belongs to
BC/AB = 113 belongs to
CD/BC = 127.2 belongs to
CD/XC = 78.6 to be exact.
DE can be expected at the 38.2 ~ $37K or 61.8 ~ $50K retracement levels.
I don't understand why it coincides, interesting, but there is still a problem that the price range is too large compared to the bottom price ($3.8K - $69K), the application of an arithmetic scale is not supported when considering the ratio wave.
If following this pattern, C is the top of wave 5 of the last cycle.

bad news! support has been broken downSPX has broken down that orange colored support. Sypher, trendline, and H&Ss all suggest that SPX is bearish. However we can't decide for sure.
Though it is a technical weakness, shorting is only confirmed if price goes below 3884.

EURUSD > Rare Beautiful Bullish Harmonic Cypher Pattern.Analysis of #EURUSD
The EURUSD is forming a rare beautiful bullish harmonic Cypher pattern.
you can either be aggressive and enter by setting a limit order at D leg completion or wait for a better entry which I will do.
I will wait for a further push to the downside for a chance to have a better entry with a small stop lose
Thanks for your continued support!

Bullish Cypher on BTCThe chart no one is paying attention to but it may be the correct call. I have Bitcoin close to completing a cypher pattern around $16900. Also the hash ribbons has flashed a buy signal a few days back + divergence on RSI. We'll see what happens. DYOR

Bitcoin bullish based on HarmonicsBitcoin printing a bullish cypher harmonic pattern on HTF charts. Usual Cypher targets marked in green but I am more inclined into using harmonic patterns for trend reversals and determining my overall market bias / sentiment.
Not expecting any impulsive moves but I believe we have reached the bottom (or that the bottom is very near) with $BTC and we will start ranging for a bit to fuel the move to the upside.
Check linked idea for LTF scenarios for Bitcoin.

Chiliz (CHZ) forming bullish Cypher for upto 49% pumpHi dear friends, hope you are well and welcome to the new trade setup of Chiliz (CHZ) with US Dollar pair.
Previously I shared a long-term trade plan for CHZ , which is still in play as below:
Now on a daily time frame, CHZ is about to complete the final leg of the bullish Cypher pattern.
Note: Above idea is for educational purpose only. It is advised to diversify and strictly follow the stop loss, and don't get stuck with trade

SELL GOLDPrice is trading within a giant falling wedge, we identified a bearish cypher pattern and used it as an entry means. We anticipate bearish movement

United Spirits (McDowell_n) Waiting for Breakout.The idea here is about United Spirits (McDowell_n).
Mentioned below are the points to be considered
Points as per TA on a Weekly Chart:
1. Engulfing candlestick formation on a weekly chart at the time of publishing.
2. Anti Cypher Pattern looks ahead.
3. Downtrend Channel resistance tested might break the channel in coming week.
4. Resistance on 20 EMA on a weekly chart, support established on 50 EMA & Trading above 200 EMA on weekly chart.
4. Kumo Twist & Breakout on a weekly chart is neutral & currently consolidating. However, Kumo Breakout & kumo Twist on daily chart is strong for a upward momentum.
5. RSI is at 49.34 on a weekly Chart at the time of publishing.
6. MACD Crossover signal line on weekly chart.
7. Hull Moving Average is a Buy Signal on Daily, Weekly & monthly chart.
8. Enter long if Price breaks above the resistance. In, any case keep a price alert.
9. Volume Spike in weekly chart signals strong Momentum.
Projected targets as per Anti Cypher Pattern & Downtrend channel provided in the chart.
Stop Loss: Enter only if price breaks the trend & Retests.
Disclaimer: “The above is an Educational idea only and not any kind of financial or investment advice. So please do your own DD (Due Diligence) before any kind of investment”.
Do you like my TA & ideas!!
Want to keep yourself updated with current market action? Then don’t forget boost & to subscribe for more analysis. Do leave your valuable feedback & comments for any improvisations.
Cheers.

Gold 3-7 OctoberGold is now rising, indicating a short-term slowdown.
The downtrend continues in the long term.
If can't rise-up above 1693 that would mean a reversal signal would occur.
If gold breaks through the 1614 support, the downtrend will continue.
and I looking for Cypher pattern. Good LUCK!!

Perfect automated detection of Cypher & Shark PRZ - ShortA Bearish-type Cypher pattern occurred.
If the price rises to 1.3597, a Bearish-type Shark pattern could occur.
Also on the weekly chart, Bearish-type Cypher pattern is occurring.
Short after seeing the rebound.
*Harmonic patterns are automatically detected using the indicators below.
- Harmonic auto-detect PRO

SPX is now holding on a support SPX is now as seen in the chart is holding in the orange colored line (support). Either it bounces back or breaks down which is very hard hard to forecast. As you can see the is also a H&Ss pattern in which its neckline is up-slanted. Targets is highlighted in chart as it is very close to the Cypher wave target.

$NQ Combo Long side worked perfect for plus 352$, risking only partial profit on short. My favorite pattern by far, let's see how it goes. Es has a bat pattern as well. High fail rate but if it works this will really be painful for bulls.

ADAUSD: Trading at Harmonic Levels of ConfluenceADA Right Now is Trading at the PCZ of a small Bullish Gartley(The Harmonic furthest to the right) and a Bullish Cypher(The Harmonic in the Middle) and A Shark(The Biggest one to the left) Usually ADA tends to lag after XRP so as long as BTC holds these levels we should be able to see ADA break above the trendline from here in the coming weeks or atleast test the trendline and if ADA Breaks the Trendline i'd expect to see it get bought up to the next maor resistance at 89 Cents.
The trendline mey just act as a Bullish Dragon Validation Line if it breaks out.
Here is a zoomed in screenshot of the Army of Harmonics we have here before us:
City Fan Token (CITY) formed bullish Cypher for upto 34.50% pumpHi dear friends, hope you are well and welcome to the new trade setup of Manchester City Fan Token (CITY) with BTC pair.
Our last successful trade of CITY was below:
Now on a 4-hr time frame, CITY has almost completed the final leg of a bullish Cypher move.
Note: Above idea is for educational purpose only. It is advised to diversify and strictly follow the stop loss, and don't get stuck with trade

Bullish Cypher Pattern on PTN ChartThis pattern gives a first target to return to level A at about 8.10-8.20 and a second target to return to level C at around 8.50.
Anticipated Catalysts for remaining 2022:
NA/US Licensing Vyleesi
ROW Licensing Vyleesi
PL3994 PH2 Heart Failure Data
Diabetic Nephropathy PH 2 Initiate Study
Something should also happen with the preferred shares at the end of September. (Convertible at $11.25 to common shares, Redeemed for debt, or basically cancelled)

Drep Token formed bullish Cypher for upto 19.50% moveHi dear members, hope you are well and welcome to the new update on Drep token with US Dollar pair.
On a 4-hr time frame, DREP has almost completed a bullish Cypher pattern.
Note: Above idea is for educational purpose only. It is advised to diversify and strictly follow the stop loss, and don't get stuck with trade

$ETH cypher $ETH has a daily inside bar break high at the golden ratio/ 618 fib level ( also the 1.272 ext of first wave lower) ideally a break high and hard drop i would have interest in a long off 786 trigger of this cypher pattern. WIth price action only. Please note highlighted structure lining up with 618 fib level, it can make a move from here.
Price action to look for is always as follows = Pin bar , engulfing bar or inside bar . In addition a 2/618 double bottom or low time frame harmonic.

DXY Monthly 98.413 or 99.19 Around 12 1 22 and then a possible low two years later on 12 2 24 lol those numbers..... and at what price of the low 86.765

NATCO Pharma is a BUY at 575The stock is forming a CYPHER pattern......Pattern completion is at 575 level....be ready to buy when it reaches there...

BTCUSD: Bullish Cypher at Weekly Support Congestion ZoneBTC leading to the Fed SPeaking in the 21st may see a rally from the Support Zone it's been trading within. It formed this Bullish Cypher/Shark on the Daily and rallied about 61.8% of the way before failing and pulling back down again. This sorta action is very dangerous as it makes me think it could be a Bearish 5-0 that could lead to us making a lower low and if we do that we will likely come back down to atleast the 786 retrace below at 17.8k. But as of right now the move down to PCZ of this Harmonic has been fast and on above average volume with a wide spread so i believe that we have a high chance of recovering the bearish price action and trading back to the top of the range as the new trading week begins, and if we break above the range we could see a secondary target of $26.5k

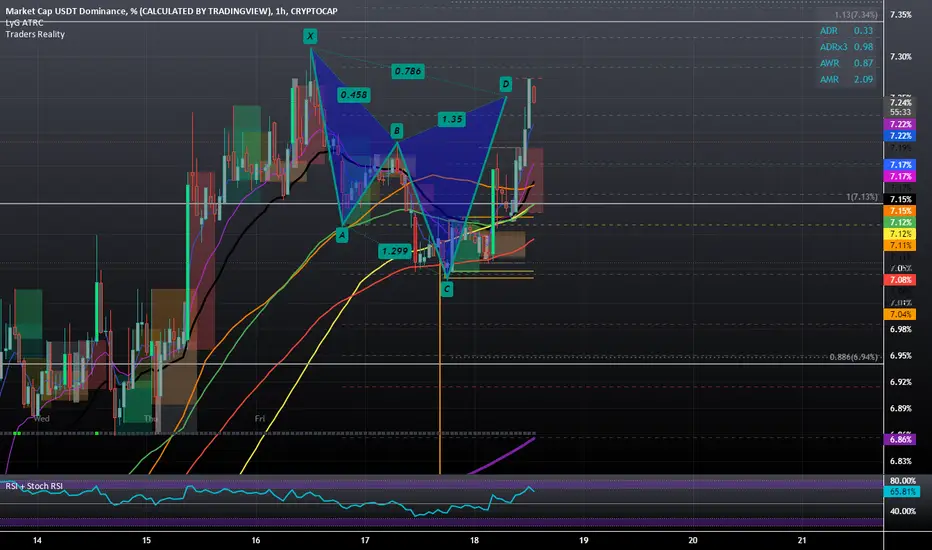
USDT Dominance Bearish Cypher on the 1 Hour TimeframeWe may see it spike up to the .886 Area but overall I think we are looking at some Bearish Cypher activity on the Dominance of the USDT today.