Dash Ready to BlasAlt coin that would blast - Inverted H&S
This is another coin that is going to blast, formed bullish pattern at the bottom
Enjoy, keep learnign and keep earning
GK Trade Manthan
Cypher

Tezo - Ready to Blast Alt coin that would blast - Inverted H&S
This is another coin that is going to blast, formed bullish pattern at the bottom
Enjoy, keep learnign and keep earning
GK Trade Manthan

Selling opportunity with XAG cypher formation
a bit risky but since it was clearly formed in the last waves, I want to try it with 0.5 R

Usd/jpy cypher possibility
price may start an increase from a region around 134.675. In cypher formation, the increase may be voluminous and sharp.

ETH to $25K - No Joke - BUY & HODLEthereum is at levels not seen since the Crypto Stone Age.
The Crypto Markets will start BOOMING!
ETH ( ETHUSD , ETHUSDT , ETHEUR ) is getting ready to go Bullish.
When? Early '23.
The Fibonacci Time Zones and Cycles tell me that the 3rd Fibonacci Summation is NOW.
So, I reckon Cryptos are getting ready for something BIG.
I do see a last drop before that though.
From Jan '18 until Dec '18 ETH had a whooping 94% crash.
We're only at 82% from Nov '21 top. So I am waiting with buying interest for a much better level.
I am buying big dips, adding value.
If you look at the Ellipse, Ethereum is doing the same pattern it did on the previous Bear Market.
Hmmm...
I've decided on my best BUY level: $550 .
Technical Analysis:
* Elliott Wave A-B-C Pattern
* Jan '18 - Dec '18 Fractal Sequence
* 88.6% Fibonacci Retracement
* Harmonic Pattern: Bullish Cypher
* Fibonacci Extensions Confluence
* Bullish Divergence
* Demand Zone
What more do you need?
Oh yeah, a much better price. :D
We went to the Moon, now let's go to Mars!

Bitcoin BTC to $250K - BUY & HODLBitcoin went to the Moon with Dec '17 top.
Then it corrected 88.6% on the Fibonacci Retracement with Dec '18 bottom.
After that it went to Mars and hit the tops again in Nov '21.
It was a 2000% gain.
What can you tell from this?
Percentage-wise, Correction is lower than the gain.
So, the Dominant Trend for BTCUSD is UP!
OK, back to Earth.
Let's gather fuel and power-up the rocket.
Time to go Interstellar.
Before I go into the technical stuff, allow me to keep things simple for you.
I took the liberty and measured the BTC Cycles.
But you don't need to worry about that, just follow my lead!
I used a fancy tool called Fibonacci Time Zones.
This tells me roughly when the next Bullish Cycle for Bitcoin will start.
We are on the 5th Fibonacci Summation milestone, and another 2000% gain is destined to commence.
When?
Early '23 , like all other Cryptocurrencies.
What's the level?
My ultimate levels are: 10K & 7.5K .
I will buy more there.
I will HODL for the long-term because I know it's a waiting game.
Now you have what you came for: when & where.
You can go ahead and open the next idea. :)
Thank you and you're welcome.
But if you capable of digesting what's to come below, then I put my hat down...
Bitcoin ( BTCUSD , BTCUSDT , BTCBUSD ) Technical Analysis:
* Elliott Wave Cycle: Complete V Cycle Degree (white)
* A-B-C Elliott Wave Correction (red)
* Ending Diagonal in Cycle C (red)
* Harmonic Pattern: Cypher
* 88.6% Fibonacci Retracement
* 161.8% (Golden Ratio) Fibonacci Extension
* Bullish Divergence
* Dominant Trend Line (turquoise dotted)
* Demand Zone
* Fractal Pattern
If you get all this without a headache then you're a legend!
The Aug '15 to Dec '17 is what I'm expecting, and it's a BIG one.
Good luck my fellow HODLer..
Thanks for the like,
Richard, the Wave Jedi.

Bitcoin Dominance: Elliott Wave and Harmonics ComboBitcoin Dominance ( BTC.D) is giving a fantastic trading setup.
It's preparing a BIG Bullish Swing.
From an Elliott Wave point of view, a bullish Impulse Wave is about to start.
In this case I'm talking about Super-Cycle (C) (turquoise).
Moving on to Harmonic Patterns, there are two:
The smaller one is the Bullish Shark, which is preparing its completion.
The second one, and the bigger view, is the Cypher Pattern, which will commence one the Shark is done.
So, bottom line: BTC.D is gonna start flying, and will push the Crypto market into a fantastic Bull Cycle.
Bitcoin Dominance ( BTC.D ) Technical Analysis:
* Elliott Wave Impulse: Super-Cycle (C) (turquoise)
* Harmonic Pattern: Bullish Shark
* Harmonic Pattern: Bullish Cypher
* Double Bottom
* Bullish Divergence
* 88.6% Fibonacci Retracement
* 61.8% Fibonacci Extension
* Demand Zone
Conclusion: Bitcoin (BTCUSD) is and always will be the one and only driver of the Crypto Markets.

USDCAD - The Make Up of An Average Trade With Big PotentialThis video is slightly different than the ones that I usually put out, but so is this opportunity. I'm looking for a HOMERUN trade here on the USDCAD & what that means is that I'm attempting to get in a trade that captures a larger profit target than what I would usually take.
What's important to pay attention to is the top-down analysis & the why behind the decision, as well as the entry reason & the role it plays in my initial involvement.
I hope you guys enjoy the video and if you have any questions or comments, please leave them below.
Akil

Merck & CO Inc: MRK oversoldIt's a cypher like bullish pattern with measurements close to an ideal cypher i.e. 1.5 per cent discrepancy, but I am looking at a broad timeframe over last couple of years. assuming it is bottoming these days around 95 it should bounce back to around 120 i.e. fibo .618 of the cd leg. - at least!
main oscillators i track indicate oversold on day, week, month TF

GBPJPY - Combining Patterns & Higher Timeframe AnalysisA walkthrough of how to identify & trade the Cypher pattern on the GBPJPY along with a look at how using higher timeframe analysis can be used to reveal even bigger potential moves.
Please leave any questions or comments below!
Akil

ALGORAND ROCKET SHIP!!I believe Algorand has bottomed in the way of a bullish shark or cypher pattern. I've outlined entry and exit points. I have accumulated a crap ton of Algo. I just wanted to let you all know. Now you do what you want with this info. Good luck

AUDUSD pays attention to the Cypher pattern belowOn the daily chart, AUDUSD maintains a downward shock, and the bears have the upper hand. At present, attention can be paid to the resistance near 0.6660. If the rebound is blocked, it is expected to continue to fall, and the downward target is around 0.6475. When the price reaches 0.6475, attention can be paid to the potential bullish cypher pattern.

NZDUSD BUY 0.5963On the daily chart, NZDUSD fluctuated and fell, and the bears have the upper hand. At present, you can pay attention to the potential bullish cypher, the buying position is around 0.5963. At the same time, this position is in the previous demand area, and the upward target is 0.6122.

Reliance on Bearish mode - Forming Cypher/SharkReliance has moved below 20 / 50 / 100 EMA & closed below support of 2904.
With the confirmation of Bearish Cypher/Shark pattern, it is expected to follow 2865 / 2800 / 2730.

Butterfly Pattern StructureThe Butterfly Pattern is formed as follows:
Point X: The starting point of the movement.
Point A: The first peak or trough that the price reaches.
Point B: The price correction from Point A, usually located around 78.6% of XA.
Point C: The subsequent correction, which should be between 38.2% and 88.6% of AB.
Point D: The final point, typically found within the range of 161.8% to 261.8% of BC.
This structure allows traders to predict potential price reversal points at Point D.

EURUSD 4H Buy BullishEURUSD 4H Buy Bullish
Volume distribution+chart trading(rectangular high sideways oscillation)+bullish Saif Pattern+supply and demand theory+bullish Pinbar=Buy Bullish
Enter the long position directly near the current price of EURUSD around 1.10300,and place the stop loss at 1.09900.
The first target is around 1.11200,halving the warehouse and promoting protection.
Look around 1.12000 for the second target position,then halve the position and push for protection.
Do not set a new high,enter the market with a backhand to short.

BULLISH CYPHER BTCUSD3 Bullish indicators for BTC
Bullish Cyper: All the retraces are valid for this pattern. The .786 retrace from X-D is perfectly aligned with an important support from history that was created in 2021. The X-B retrace is 100% clearly present there and the A-C retrace is almost just there.
Classic Bullish Divergence: Higher lows on the MACD and RSI oscillators and lower lows on the price validates this pattern. This perfectly aligns with the pivot of the Bullish Cypher and the historical support line.
Overall Context of the Structure: the context of the structure is reasonable. These pattern usually appear after a correction and it seems to be the case for BTC right now. It is also easy to set a stop loss because of that support line and everything under. If BTC falls below that support line, expecting further downside.

GoldCypher pattern. Sell from D point. Entry at 2514- 2515. Stop loss at 2518. Take profit 2500-2498.

XAGUSD potential bearish cypherOn the daily chart, XAGUSD is currently stabilizing and moving upward, with a short-term bullish pattern. Currently, XAGUSD is expected to continue to rise, with an upward target of around 30.58. When the market reaches around 30.58, pay attention to the potential bearish cypher.

COMBOUSDT (30M) Cypher Harmonic Long ThermThe information contained herein has been prepared for general information purposes only. The comments and recommendations contained herein are based on the personal opinions of commenters and advice givers. It should not be interpreted as a recommendation to buy or sell any investment instrument or a promise of return. These views may not be suitable for your financial situation and risk and return preferences. Therefore, making an investment decision based solely on the information contained herein may not produce results that meet your expectations. BINANCE:COMBOUSDT.P

BTCUSDT ANALYSIS Pair : $BYBIT:BTCCUSDT.P
Leverage: 5X
Direction: Long 🔼
SL: HODL
TP: 70,000
ANALYSIS:
Market Cypher B: 1D TF✅
Bull Bear Power: 2HR TF✅
Nearest Resistance: 64,000 and 70,000
Nearest Support: 58,000
⚠️#DYOR

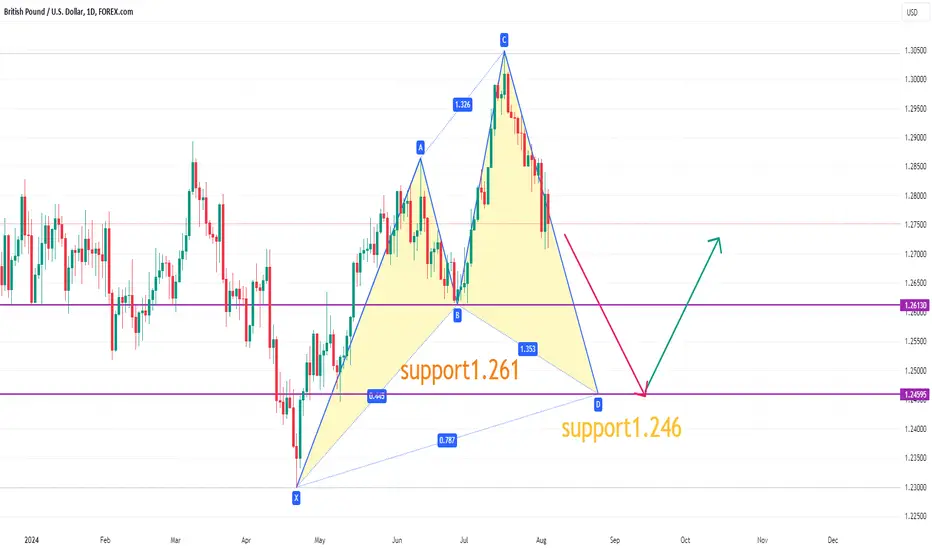
GBPUSD may fall below 1.261On the daily chart, GBPUSD encountered resistance and fell back after rebounding in the previous supply zone, and the short-term market may continue to fall. The current downside target is around 1.261. If it falls below, it is expected to continue to fall, and the support below is around 1.246. When GBPUSD reaches 1.246, you can pay attention to the potential bullish cypher pattern.
XAUUSD bearish cypher patternOn the 4-hour chart, XAUUSD has formed a bearish cypher pattern. During the day, attention can be paid to the resistance line of 2458. If the rebound is not broken, attention can be paid to short-selling opportunities. The downside target is around 2418 of the 0.382 ratio of the CD segment, and if it continues to fall, it will go to around 2393 of the 0.618 ratio. If the price breaks through the resistance near the previous high of 2483, an upward trend will be launched.
