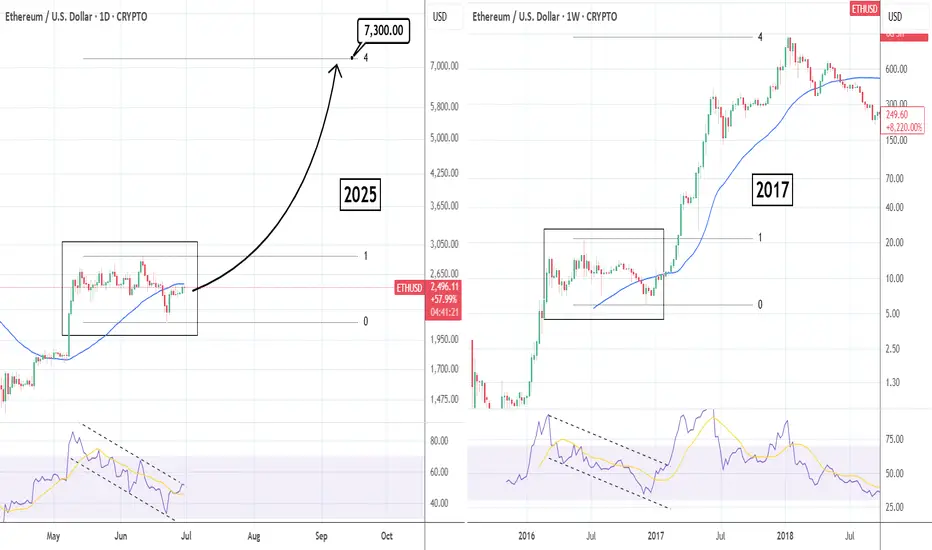
ETHUSD: Parabolic rally similar to 2017 targets $7,300Ethereum is neutral on its 1D technical outlook (RSI = 50.960, MACD = -24.810, ADX = 18.527), attempting to break over the 1D MA50, while still being inside a 6 week consolidation. This is no different than the 2016 consolidation on the 1W chart, that turned out to be just an accumulation pattern before a massive 2017 bullish breakout to the 4.0 Fibonacci extension. Time to go heavily long on ETH with TP = 7,300.
## If you like our free content follow our profile to get more daily ideas. ##
## Comments and likes are greatly appreciated. ##
D-ETH
ETHEREUM WILL GROW|LONG|
✅ETHEREUM consolidated
Above the horizontal support
Around 2400$ and now we are
Finally seeing a bullish rebound
So we are bullish biased and
We will be expecting a
Further move up
LONG🚀
✅Like and subscribe to never miss a new idea!✅
Disclosure: I am part of Trade Nation's Influencer program and receive a monthly fee for using their TradingView charts in my analysis.

Ethereum Leveling Map — ETH/USDT 1DNo directional bias for Ethereum, but will use levels to spot entries for intraday.
Right now located at POC and seems balanced for both sides.
Potential Adam&Eve setup in development.
Quality levels for support $2150, 2000, 1800, 1500.
Resistances $2700, 3000, 3500, 4000
Keep in mind it will follow BTC price action by most of time.
Happy trading

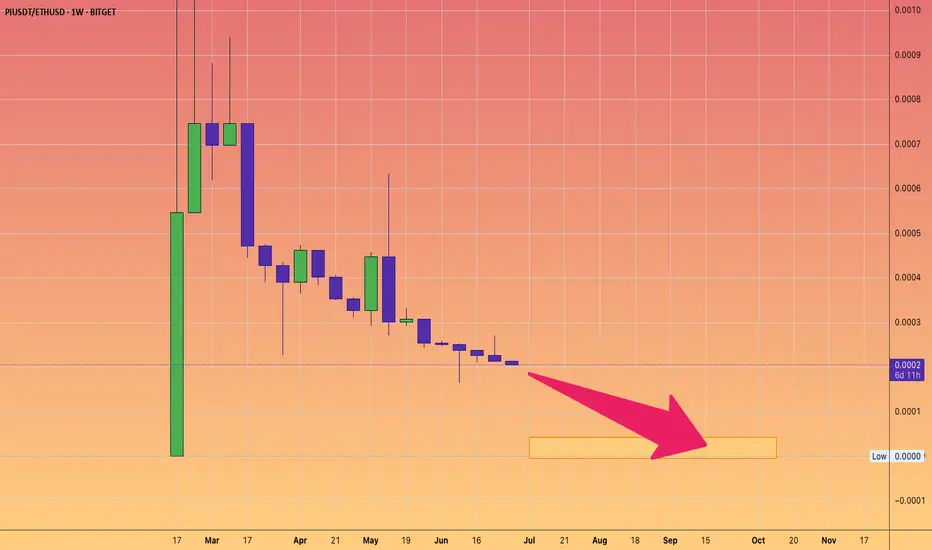
DON'T BUY Pi Network. It's a PUMP and DUMP.But feel free to short it if you desire.
This is Pi v ETH chart
It will continue it's trend to near ZERO.
Market makers will keep dumping into oblivion.
HolderStat┆ETHUSD fixed above the supportBINANCE:ETHUSDT broke out from a triangle and is holding above the 2,447 zone. The current ascending structure targets 2,700 in the near term. Reclaiming short-term resistances confirms a bullish reversal from recent lows, similar to past triangle breakouts.

Bitcoin Mid Term Game Plan - BTC PLANBitcoin just broke a key resistance level with strength.
I expect a new all-time high soon, likely the summer top.
Summer markets are usually weak for risk assets and strong for gold. Seasonality matters, keep that in mind.
I expect risk markets to sell off until mid-July to early August. I’ll start buying once we break structure again.
The plan:
Wait for BTC to hit $110K
Look for a reversal from that level
Start aggressively shorting alts, beginning with ETH and memecoins
Hold shorts until late July / early August
Close positions and shift back to buying

ETH, hinting of a monster RISE from 2.4k to 4k... SEED NOW!ETH has been the most stubborn pair in comparison to BTC. Its price behavior is almost opposite that of BTCs with unstable volatility the last 2 years -- and thats an understatement.
But from what we know based on its historical movement -- ETH, when it gets into the zone, theres no stopping this sleeping giant to capturing new heights. And that's what we're sensing now with initial hint of BIG SHIFT transpiring this month based on its latest long term metrics.
From our diagram above. Here is what we observed.
LONG TERM MOMENTUM BEAR CLERANCE SHIFT.
FIRST ONE IN 2.5 YEARS! LAST TIME WAS JANUARY 2 2023
Lower highs momentum baselines conveying intense build up ascend pressure.
Precise 78.6 FIB LEVEL TAP. This is where most buyers converge before a BULL SEASON.
From this metric changes, something is definitely evolving. This shift doesnt happen often. It took ETH 2.5 years to repeat this signal, and we got one this month. This is special and it is BIG.
SEED NOW while you can. See you up there at 4k era soon and beyond.
Spotted at 2400
Mid/Long term Target 4k++
Trade Safely. Market is Market.
Not financial advice.
TAYOR.

Ethereum Breakdown Ahead? Classic Head & Shoulders Pattern Hello Guys!
Ethereum looks like it’s setting up for a potential drop after forming a textbook Head & Shoulders pattern on the 4H chart.
This pattern (marked clearly with a left shoulder, head, and right shoulder) is often seen before a price reversal. Right now, ETH has already broken below the neckline (around $2,480), confirming the bearish pattern, and is currently retesting that level from below.
📉 What’s Next?
If the pattern plays out, we could see ETH drop toward the projected target zone around $2,200–$2,250, which is highlighted in blue on the chart. This zone also lines up with a previous area of interest and sits near a broken trendline, adding confluence to the setup.
✅ What I see:
Resistance: ~$2,500 (neckline retest)
Target: ~$2,200 support zone
Broken trendline adds downside pressure
Unless bulls reclaim the neckline quickly and push above the right shoulder (~$2,650), this looks like a bearish continuation setup.

ETH Pushed Back, Support in Sight
ETH on the 4H just closed below the last daily close and the 0.5 Fib again, after getting pushed back from the 4H 200MA and daily 200MA resistance zone.
The next key supports are the weekly 200MA and the local support zone.
Also worth noting: Trump and Musk are stirring things up again. The last time this dynamic appeared, it triggered a selloff a few weeks ago, even before the conflict began.
Always take profits and manage risk.
Interaction is welcome.

2/6/17 BIG SHORT ETH MEGA DUMPI expect the strongest fall in bitcoin and ether, so I take such a trade with a profit risk ratio of 1k12 as part of a classic pattern stop over the 3 top

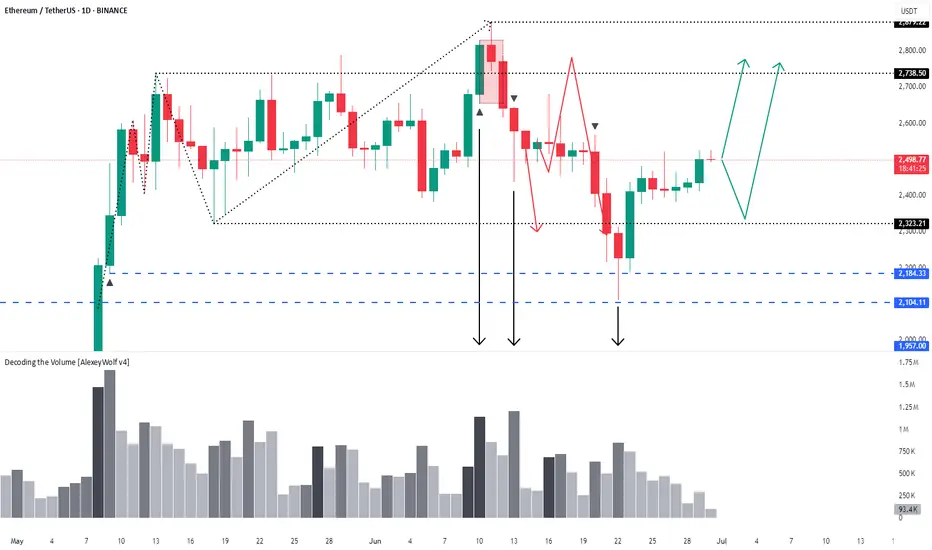
Ethereum – 1D timeframe overview with Initiative AnalysisHey traders and investors!
The seller has reached their target.
A buyer started buying from the 2184 level and now holds the initiative.
Targets are on the chart.
This analysis is based on the Initiative Analysis concept (IA).
Wishing you profitable trades!
Can Ethereum start a daily uptrend?This daily uptrend might fail because btc dominance is strong but eth bulls are watching

ETH could be about to rip into a short-term rallyWhile the stock market has seen surprising upside in the past weeks (presumably due to pricing in rate cuts / a more positive liquidity picture / high expectations for Q2), crypto has lagged behind. I don't believe anything significantly above current prices - no matter in which market - is sustainable for now, but we can certainly milk it for whatever it's worth.
Notably, BTC has shown way more resilience and dominance in the current cycle so far. This makes sense in a high interest environment. However, within the bias of the markets pricing in expectations for rate cuts and as such more liquidity, we could also assume that demand for assets other than "safe havens" would now increase as well, leading us to the biased conclusion that we could see altcoins wildly outperforming BTC over the next weeks.
Indeed, if we look at the BTC chart, technicals such as VWAP stddevs show significantly less potential for upside if compared to ETH in the current moment in time. We therefore would focus on ETH at this point (as money flow seems to cycle BTC->ETH->Others).
PLEASE NOTE: SL and TP are not accurate. This is not a precise trading idea. Please use your own judgement in accordance with your trading style.

ETHUSDTThis movement downtrend. If breake 2.790 movr to 3.500$ but breke 2.200 move trend to 1.500$.

Ethereum monthly cup and handleSoooo, this is my first post, and I'm not really too sure if I'm seeing this correctly, can somebody please explain to me why I'm wrong or if I'm right. Cuzzzzz this seems extremely bullish to me.
This is on the monthly timeframe, so this projection is for closer to November - February, IMO...
AM I SEEING THIS CORRECTLY, or is this my bullish personality shining through.

BRIEFING Week #26 : Are we going for a Bubble ?Here's your weekly update ! Brought to you each weekend with years of track-record history..
Don't forget to hit the like/follow button if you feel like this post deserves it ;)
That's the best way to support me and help pushing this content to other users.
Kindly,
Phil

ETH.... You can do it. Get back into structure. ETH is struggling below resistance; however, an exchange of hands on lower timeframes can give the bulls a bit more wind. A break back into structure would be bullish. Don't mind me, I've been smoking that hopium.
Full TA: Link in the BIO

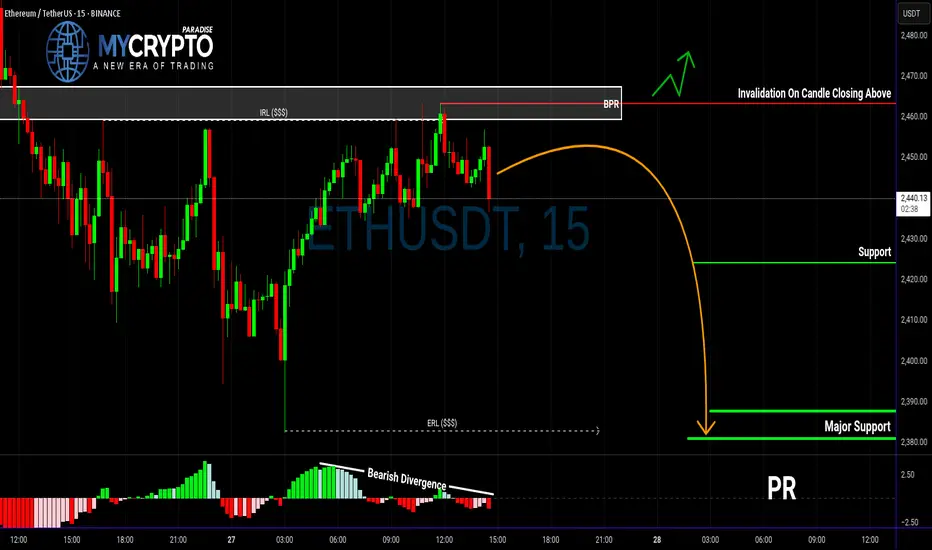
ETH in Trouble? This Breakdown Could Be Just the BeginningYello, Paradisers — are you spotting the same warning signs we did before the last major ETH correction? If not, now’s the time to pay close attention.
💎ETHUSDT is currently showing multiple bearish signals across both higher and lower timeframes. On the higher timeframe, we’ve confirmed a bearish Change of Character (CHoCH), which is often the first major clue that momentum is shifting from bullish to bearish. This shift suggests that ETH could be preparing for a deeper move down.
💎On the 15-minute timeframe, price has reacted directly from the BPR zone. What adds even more weight to this reaction is the clear bearish divergence we’re seeing on the MACD indicator. Together, these signs point to increased bearish pressure in the short term.
💎More importantly, ETH has already taken out Internal Range Liquidity (IRL), which often sets the stage for a move toward the External Range Liquidity (ERL). When IRL gets swept and momentum remains bearish, it’s typically a sign that the market is hunting for liquidity on the other side of the range—and that’s exactly where we believe ETH is headed next.
💎That said, to take this setup with high confidence, we’re waiting for a clean bearish candlestick pattern to form. Confirmation is key. A solid entry backed by strong price action improves the probability of success and allows for tighter, more efficient risk management.
💎However, if ETH breaks out and closes decisively above our invalidation zone, the entire bearish idea is off the table. In that scenario, patience will be our best tool—we’ll wait for price action to realign and only re-enter the market once a new high-probability setup presents itself.
🎖Strive for consistency, not quick profits. Treat the market as a businessman, not as a gambler. Patience and discipline are what separate the professionals from the herd. Stick to the process, trust the strategy, and you’ll stay ahead of 90% of the market.
MyCryptoParadise
iFeel the success🌴
HolderStat┆ETHUSD trying to break through the resistanceBINANCE:ETHUSDT has confirmed a triangle breakout above the 2,312.67 level and is forming a bullish staircase structure. The chart shows a history of breakout rallies from similar formations, and this current setup targets 2,700+. Maintaining higher lows is essential for follow-through.

Inverse Head and Shoulders on Ethereum: Short Opportunity ETH?I'm currently watching Ethereum , and things are starting to look interesting.
We’re seeing early signs of a potential break in structure to the downside, and I’m closely monitoring a bearish inverse head and shoulders pattern. On the 30-minute timeframe, I’m waiting for a clear break of market structure within the current range before considering a short entry.
Stop loss would be placed above the range, with the target outlined in the video.
This is not financial advice—please trade responsibly and always manage your risk.

ETH 4H – Testing the 200W MA
ETH is trying to reclaim the 200-week MA on the 4H chart.
The last 4H candle closed right on top of it.
The first 4H bar from June 26 closed above the 0.5 Fib, but that level was eventually lost.
If the 200W MA holds as support, price may attempt to flip the 0.5 Fib into support again.
Always take profits and manage risk.
Interaction is welcome.

bearish reversal off pullback resistance?The Ethereum (ETH/USD) has rejected off the pivot and could drop to the 1st support that aligns with the 61.8% Fibonacci retracement.
Pivot: 2,483.49
1st Support: 2,289.88
1st Resistance: 2,587.09
Risk Warning:
Trading Forex and CFDs carries a high level of risk to your capital and you should only trade with money you can afford to lose. Trading Forex and CFDs may not be suitable for all investors, so please ensure that you fully understand the risks involved and seek independent advice if necessary.
Disclaimer:
The above opinions given constitute general market commentary, and do not constitute the opinion or advice of IC Markets or any form of personal or investment advice.
Any opinions, news, research, analyses, prices, other information, or links to third-party sites contained on this website are provided on an "as-is" basis, are intended only to be informative, is not an advice nor a recommendation, nor research, or a record of our trading prices, or an offer of, or solicitation for a transaction in any financial instrument and thus should not be treated as such. The information provided does not involve any specific investment objectives, financial situation and needs of any specific person who may receive it. Please be aware, that past performance is not a reliable indicator of future performance and/or results. Past Performance or Forward-looking scenarios based upon the reasonable beliefs of the third-party provider are not a guarantee of future performance. Actual results may differ materially from those anticipated in forward-looking or past performance statements. IC Markets makes no representation or warranty and assumes no liability as to the accuracy or completeness of the information provided, nor any loss arising from any investment based on a recommendation, forecast or any information supplied by any third-party.

ETHBTC: Ethereum to outperform massively Bitcoin.ETHBTC turned neutral again on its 1D technical outlook (RSI = 41.566, MACD = -0.00033, ADX = 21.423) as in the past 4 weeks it failed to extend the rebound of the April 14th bottom. Ahead of a MACD Bullish Cross, a little further correction to make a Double Bottom (DB) would make the pattern more bullish, much like the December 9th 2019 DB. That was the start of Ethereum's bull season. Similarly, we expect it to start outperforming Bitcoin massively and approach the R1 level (TP = 0.0800).
## If you like our free content follow our profile to get more daily ideas. ##
## Comments and likes are greatly appreciated. ##
