ETHUSDT – Eyeing a Potential Rejection Near 1650 ResistanceEthereum is currently in a downtrend, and the recent upward move appears to be part of a correctional phase. Price is now approaching the descending trendline and a key resistance area around $1650, which previously acted as support.
This zone could serve as a potential rejection area, especially if the broader bearish structure holds.
D-ETH

ETH idea for longSo we have EQH, now we are in month bisi, have two patten
1. AMD, we are wait manipulation and break structure for long unicorn stetup
2. without manipulation this mean need search SMT with bct and wait 4h bisi
I hear Trump invest buy eth on 200m usd, this good point for long term position

ETH Dominance#ETH is approaching its All time low dominance of 7.09%.
Eth is declining every day as compared to #btc.
Will history repeat itself by reversing from this zone?
Or
#Ethereum will be doomed!
C
Share your views???

Similar Phases? ETHUSD Will we see a rebound with a bullflag to push price up into the rest of this bull market?
This has occurred before on an earlier bull market
Lets see how it plays out
Weekly chart

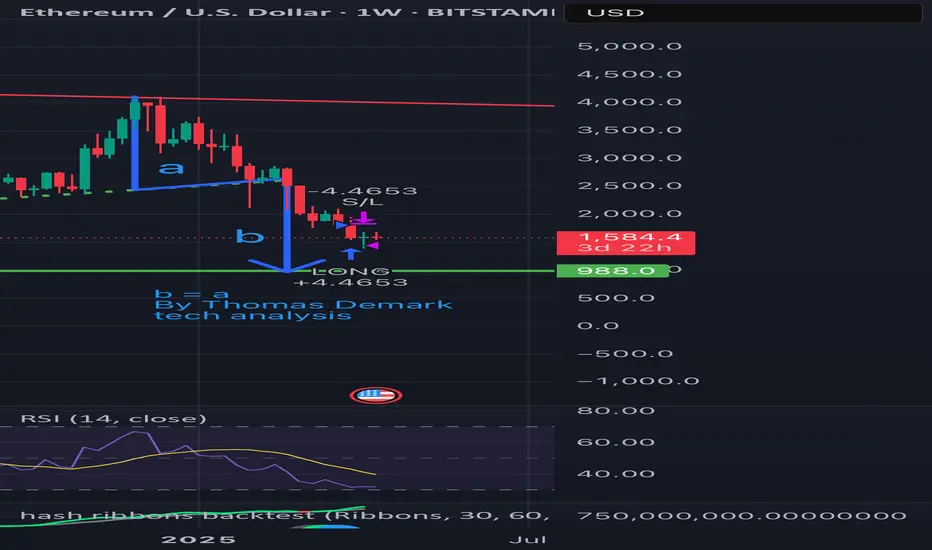
ETH is falling per Demark’s technical analysis: Target at $988?According to Thomas Demark’s method — when b = a, the next target for ETH is around $988.
📉 Price broke the ascending support
🔻 Wave “a” from $4000 to $2500 has already played out
📏 Wave “b” is projected downward — target aligns with a strong historical support zone
📊 Weekly RSI is nearing oversold territory
Conclusion: The $988 area is critical. A reversal may occur there if selling pressure weakens.
Stay sharp.
#ETH #Demark #CryptoAnalysis #TechnicalAnalysis #Ethereum
$ETH = Silver and $BTC = Gold Means WHAT!?They say Ethereum is the Silver to ₿itcoin being Gold.
If that's the case, does that mean that the ceiling for CRYPTOCAP:ETH will forever be stuck at $4,800
just like TVC:SILVER being capped at $48 for the past 45 years?
Does anyone really think ETH will be higher than $4,800 in 45 years???😆
A true store of value 💯


Is BTC set to hit 90K before dropping?#BTC has been range-bound on the weekly , recently forming an SFP below the range low but failing to close below the Feb and Mar 10th lows. Could we see an SFP above the RH ($90K) before moving lower, potentially toward the FWB:65K -$72K target? That remains to be seen. The HTF MS remains bearish, and until it shifts, the risk to the downside is high. For a bullish shift on the weekly, we need weekly closes above $94000. Until then, downside risk persists.
On LTF/MTF: I update my analysis regularly, but for now, I’m considering a few scenarios:
👉a. BTC could bounce from an 18H HOB if the 2H HOB breaks, potentially aligning with USDT.D hitting a 23H HOB at 5.62%. This might form a DB at a 22H PHOB at 5.35%, or USDT.D could target a 12D demand or a 22H HOB at 5.15%.
👉b. BTC might bounce, breaking the current 21H OB, and reach the HTF supply at $90K, while USDT.D takes the 23H PHOB and possibly the 22H HOB before rising to 5.77%-6.01%.
Also note, the daily close below the $84600 SH shows weakness on the chart. There’s little to do until we either reach $72K or see an MS shift, which could open risky upside trades. These are risky because we haven’t taken the liquidity needed for higher prices. MT also mentioned that higher prices without key level breaks are likely a bull trap. Avoid heavy trades until direction is clear.
Until then, we focus on taking LTF scalp trades 🤝

ETHUSD: Prepare to buy if this trendline breaks.Ethereum remains bearish on its 1D technical outlook (RSI = 41.779, MACD = -115.050, ADX = 39.213) despite an encouraging start to the day as the 4 month Channel Down is intact. The 1D RSI is supported and is trading sideways and ETH itself is back to historic buy levels. We are willing to buy only after a break over the 1D MA50 validates the trend change technically. If that happens we will aim for the 2.0 Fibonacci extension (TP = 2,800). You can use as an extra validation condition a potential break of the 1D RSI above the R1 level.
## If you like our free content follow our profile to get more daily ideas. ##
## Comments and likes are greatly appreciated. ##

ETH is fighting in the support zoneHello everyone, I invite you to review the current situation on ETH. When we enter the one-day interval, we can see how the ETH price moved in a strong downtrend channel. What's more, we can see that the price fell below the main uptrend line.
As we can see, the price is currently fighting to break out on top in the support zone from $ 1690 to $ 1350, in a situation if this zone was broken, we could see another strong drop to the support area at $ 884 at the previous low after the bull run.
On the other hand, if ETH gets wind in its sails again, it must first pass through the resistance zone from $ 1952 to $ 2100, while further on there is a very strong zone from $ 2500 to $ 2740.
However, here, taking into account the one-day interval, the RSI indicator shows a breakout above the top of the border, which may affect the potential end of the current uptrend.

ETH | Either OR Scenario | ALTSEASONThe previous update was on the current low that ETH hit a couple of days ago, and what happened the previous time we hit that price:
POTUS Donald Trump signed a bill that exempts DeFi platforms from reporting on their clients' taxes, unlike traditional brokers. This may explain the bullish sentiment we're observing across the market currently.
💥 ALTS Part 1 and 2 below, stay tuned for Part 3 ! 💥
____________
BINANCE:ETHUSDT

Triple Tap, Then Boom: ETH Breakout Brewing?We're looking at a classic ascending triangle setup on ETH. Price has tapped the resistance zone around $1676 three times already — the next attempt could lead to a breakout. Market structure is clean: higher lows with strong bullish momentum squeezing price toward the horizontal resistance.
This pattern usually ends with a strong impulse up, and considering the overall sentiment, this could be the beginning of a new local rally.
Entry: $1630-1650
SL: $1582
TP: $1820
Risk/Reward: 4.0
More thoughts in my profile @93balaclava
Personally I trade on a platform that offers low fees and strong execution. DM me if you're interested.

ETHEREUM BITCOIN (BEST-CASE)CRYPTOCAP:ETH is the main platform for thousands of apps and blockchains, all powered by the Ethereum protocol.
This vibrant ecosystem fuels innovation and a wide range of decentralized apps and services.
Free and global Ethereum accounts
Pseudo-private, no personal information needed
Without restrictions anyone can participate
No company owns Ethereum or decides its future

(ETH) ethereum one day chart,. I confused the week chart setting for the day and found more optimism than there truly is. Still the line are converging and separating and creating time as a chart to distance oneself from reality only to get lost in the timeframes of trade.

(ETH) ethereum "triangle - slant"Ethereum is not priced for an only up direction as of right now, unlike Bitcoin. As seen in the chart and indicator. The pink and purple dotted lines are close to intersecting and if the pink link crosses over this is a good sign for the chance of a neutrality and even a possible upward forming price chart position.

Support zone: 1340.12-1935.34
Hello, traders.
If you "Follow", you can always get new information quickly.
Please click "Boost" as well.
Have a nice day today.
-------------------------------------
(ETHUSDT 12M chart)
I can't get on the plane and it's falling.
The maximum decline zone is expected to be around the Fibonacci ratio 0 (1190.57).
-
(1M chart)
Since it has fallen below the support and resistance zones, I think it's a good idea to check the turn with a relaxed mind.
In order to continue the uptrend, it must rise above the M-Signal indicator on the 1M chart.
If it falls to around 736.47, it is better to buy without thinking from a long-term investment perspective.
The minimum holding period is 1 year.
-
(1W chart)
When looking at the 1W chart, the HA-Low indicator on the 1W chart is formed at the 1340.12 point.
Therefore, if it shows support around this area, it is a time to buy.
If it falls below 1340.12, it is a time to buy when it rises again and support is confirmed.
In the explanation of the 1M chart, I said to buy unconditionally if it falls to around 736.42.
This is a condition for holding for at least 1 year, so if not, it is recommended to buy when it is confirmed to be supported by rising near 1340.12.
-
(1D chart)
ETH's volatility period is from April 5 to 7.
ETH's next volatility period is around April 17 (April 16 to 18).
-
The most important thing on the ETH chart is the rising trend line (1).
Therefore, volatility is likely to occur when it passes the rising trend line (1).
-
Let's look at the chart from a short-term perspective.
Currently, the HA-Low indicator on the 1D chart is formed at the 1935.34 point.
Therefore, from a short-term perspective, when it is confirmed to be supported by rising near 1935.34, it is the time to buy.
Therefore, you should think about the average purchase price of the coins you currently own and think about how to respond.
-
The best method is to increase the number of coins (tokens) corresponding to the profit.
This method is most efficient when used during a downward trend.
You write down the purchase price and amount separately, and if the purchase price rises more than the purchase price and a profit is generated, you sell the purchase amount within the purchase amount range to leave the number of coins (tokens) corresponding to the profit.
The reason why this method is explained from a short-term perspective is because you have to conduct day trading or short-term trading.
If you continue to trade until the upward trend turns like this, you will make a large profit when the upward trend turns.
In addition, since the pressure on funds has decreased, you will also have the opportunity to seize the opportunity to make a full-fledged purchase.
-
Thank you for reading to the end.
I hope you have a successful transaction.
--------------------------------------------------
- This is an explanation of the big picture.
To check the entire range of BTC, I used TradingView's INDEX chart.
I rewrote the previous chart to update it by touching the Fibonacci ratio range of 1.902 (101875.70) ~ 2 (106275.10).
(Previous BTCUSD 12M chart)
Looking at the big picture, it seems to have been maintaining an upward trend following a pattern since 2015.
In other words, it is a pattern that maintains a 3-year upward trend and faces a 1-year downward trend.
Accordingly, the upward trend is expected to continue until 2025.
-
(Current BTCUSD 12M chart)
Based on the currently written Fibonacci ratio, it is displayed up to 3.618 (178910.15).
It is expected that it will not fall again below the Fibonacci ratio of 0.618 (44234.54).
(BTCUSDT 12M chart)
Based on the BTCUSDT chart, I think it is around 42283.58.
-
I will explain it again with the BTCUSD chart.
The Fibonacci ratio ranges marked in the green boxes, 1.902 (101875.70) ~ 2 (106275.10) and 3 (151166.97) ~ 3.14 (157451.83), are expected to be important support and resistance ranges.
In other words, it seems likely that they will act as volume profile ranges.
Therefore, in order to break through these ranges upward, I think the point to watch is whether they can receive support and rise near the Fibonacci ratios of 1.618 (89126.41) and 2.618 (134018.28).
Therefore, the maximum rising range in 2025 is expected to be the 3 (151166.97) ~ 3.14 (157451.83) range.
In order to do that, we need to see if it is supported and rises near 2.618 (134018.28).
If it falls after the bull market in 2025, we don't know how far it will fall, but based on the previous decline, we expect it to fall by about -60% to -70%.
Therefore, if it starts to fall near the Fibonacci ratio 3.14 (157451.83), it seems likely that it will fall to around Fibonacci 0.618 (44234.54).
I will explain more details when the bear market starts.
------------------------------------------------------

$ETH update, are we at the bottom?We’re getting close.
If you’re still holding AMEX:ETH , you might just need a bit more patience — in a month, we could be heading back up.
Let’s break down the chart, because this is a fascinating setup:
1️⃣ Two similar patterns with three tops and three MACD resets.
2️⃣ AMEX:ETH is in a consolidation zone between $1950 and $1075, right where past rallies have started.
3️⃣ MACD on the weekly is near reset — a bullish reversal could kick in within 2 weeks and last 6+ months.
4️⃣ RSI is at the bottom, aligning perfectly with the MACD: this often signals a bounce.
📉 Yes, one last dip is possible — maybe $1150–$1250 — but I personally think AMEX:ETH will bounce above the previous low.
🚫 Don’t sell the bottom. Capitulating now could mean missing out on the reversal.
📅 Timeline? January was the time to exit. If you’re still in, just hold tight — things might look very different by May and beyond.
⚠️ Disclaimer: This is a chart-based analysis. Macro factors (👋 tariffs!) can shift everything, so stay alert and manage risk.

BTC WILL FALL BECAUSEIn my opinion we will see one more crash because of MSTR or ETH SCAM (Buterin, Saylor)

ETHSimple chart :
- Don’t fight the trend, just stick to your strategy.
- follow the signs.
- Never go all in and always DCA.
Only this way we will learn to master our emotions.
Happy Tr4Ding !

Nice squeeze ETHWe're still in a negative trend from December, but as you can see the situation is becoming a squeeze, what happens often after this is, if the green indicator breaks this line, there is a good chance that the next consolidation will be around 2000
Normally when that happens, people react and buy because they think its going to continue, and this brings more liquidity to the market
its is what is called FOMO - fear of losing out, and it can affect the actual trajectory big time
causing it to continue its climb until no one has any more funds to put in
but looking at the previous years of Eth and whats been happening this year, its the lowest eth has been in three years at this time of year
its an indicator too that anyone who is actually interested in eth will get on board, because of these trend signs.
So what ever your ideas or choices, know that Eth has a very strong buying price point right now. It can't really get much better.

ETHUSDT BUYEthereum buy signal on M15 Timeframe, Bullish triangle resistance was succesfully broken. Now bullish target is 1689 level. Risk reward 1/3

BRIEFING Week #15 : Arbitrages on the lookoutHere's your weekly update ! Brought to you each weekend with years of track-record history..
Don't forget to hit the like/follow button if you feel like this post deserves it ;)
That's the best way to support me and help pushing this content to other users.
Kindly,
Phil

Ethereum - The Perfect Crypto Trade!Ethereum ( CRYPTO:ETHUSD ) is retesting massive support:
Click chart above to see the detailed analysis👆🏻
For the past four years, Ethereum has overall been trading sideways with significant swings towards the upside and downside. As we are speaking, Ethereum is retesting a significant confluence of support and if the bullrun actually continues, Ethereum will rally parabolically.
Levels to watch: $2.000, $4.000
Keep your long term vision,
Philip (BasicTrading)
