Pullback resistance ahead?The Ethereum (ETH/USD) is rising towards the pivot which has been identified as a pullback resistance that lines up with the 50% Fibonacci retracement and could drop to the 1st support.
Pivot: 2,483.49
1st Support: 2,289.88
1st Resistance: 2,655.92
Risk Warning:
Trading Forex and CFDs carries a high level of risk to your capital and you should only trade with money you can afford to lose. Trading Forex and CFDs may not be suitable for all investors, so please ensure that you fully understand the risks involved and seek independent advice if necessary.
Disclaimer:
The above opinions given constitute general market commentary, and do not constitute the opinion or advice of IC Markets or any form of personal or investment advice.
Any opinions, news, research, analyses, prices, other information, or links to third-party sites contained on this website are provided on an "as-is" basis, are intended only to be informative, is not an advice nor a recommendation, nor research, or a record of our trading prices, or an offer of, or solicitation for a transaction in any financial instrument and thus should not be treated as such. The information provided does not involve any specific investment objectives, financial situation and needs of any specific person who may receive it. Please be aware, that past performance is not a reliable indicator of future performance and/or results. Past Performance or Forward-looking scenarios based upon the reasonable beliefs of the third-party provider are not a guarantee of future performance. Actual results may differ materially from those anticipated in forward-looking or past performance statements. IC Markets makes no representation or warranty and assumes no liability as to the accuracy or completeness of the information provided, nor any loss arising from any investment based on a recommendation, forecast or any information supplied by any third-party.
D-ETH

ETH - When $3,000??The one who frontrun ETH at the bottom are the real boss, looks good from 2460 for longs, and slit for buys at the range if something outlasts

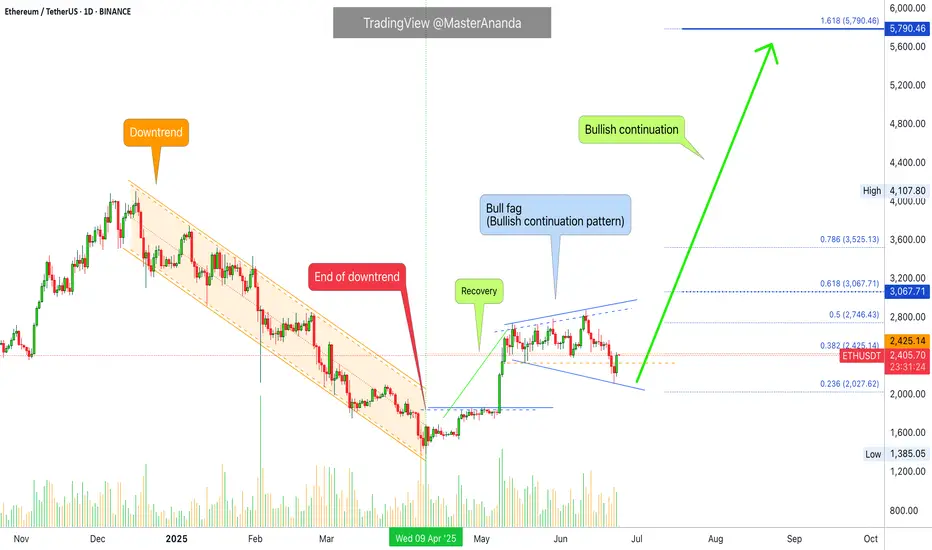
Ethereum vs Small Cap. & The 2025-26 Cryptocurrency Bull MarketThe last three days ended up being a very nice flush, a strong one but the action quickly recovered above the 18-May low.
Ethereum was trading above $2,300 since mid-May and always stayed above this level. It broke suddenly below, out of nowhere, but the action is bullish again. We can say that this was a stop-loss hunt event, a bear-trap and nothing more or else we would see a continuation of the bearish action rather than a strong inverse reaction, a bullish jump.
It is not only Ethereum of course that is experiencing this type of bullish action, some altcoins are going nuts. Really crazy right now producing so much momentum that people are still wondering if the market is going down... Or is it going up?
It is obviously up, just look at the 7-April low.
Ethereum hit a low of $1,385 on 7-April. The higher low yesterday ended at $2,111.
You see what I mean?
The market is ultra-bullish because the last low is so far away. It is impossible that it will be tested even less possible for it to break. Ok, so a market shakeout we agree but now that the shakeout is complete what is supposed to happen next?
Watch the smaller altcoins.
Thank you for reading.
Namaste.
Watching for a Double Signal on ETH ETH 4H – Watching for Dual Signal Confirmation
ETH is now trading above the BB center, with both the MLR and SMA also above.
PSAR hasn’t flipped yet, but if upside continues, we could see a bullish flip soon.
If PSAR flips while price holds above range low, that’s a potential dual signal (trend + structure).
Still, this is speculative—price could easily reject here and head lower.
Reminder: ETH remains under the 200MA on both the 4H and daily timeframes.
However, it’s currently holding the 5D 200MA. Idea on that coming soon.
Always take profits and manage risk.
Interaction is welcome.

ADA | BTC | ET | Why ALTSEASON is COMING SOONAfter a -34% retracement, ADA is ready to go higher alongside with the rest of the alt market.
We see a very interesting phenomena here, were ADA also represents a large part of the larger alts: BTC pulls back, ETH is starting to increase or trades sideways (before the increase) whilst the alts dip.
This is actually BULLISH for alts, showing the very clear rotation between BTC, ETH and top 15 alts.
If we look at the macro of ANY of the alts I've been working through recently, a similar pattern appears - a clear bottom, followed by a sideways trade. This is usually the point just before the big ALTS season.
We actually see this pattern at the end of the 2018 rally, as well as after the 202- Covid dip:
The bottom line -
ADA and other alts are gearing up for their ALTSEASON. With patience, we will soon see some great gains across the markets.

SOARING 20's are you ready for the Blowoff of the century#SPX v Currency in circulation
#Cup&Handle
1929 Echo bubble
AI will increase earnings and GDP
as ASI enters the workplace and Robotics grow us out of Debt
GDP = Number of people * Productivity
Now add an autonomous workforce to this.

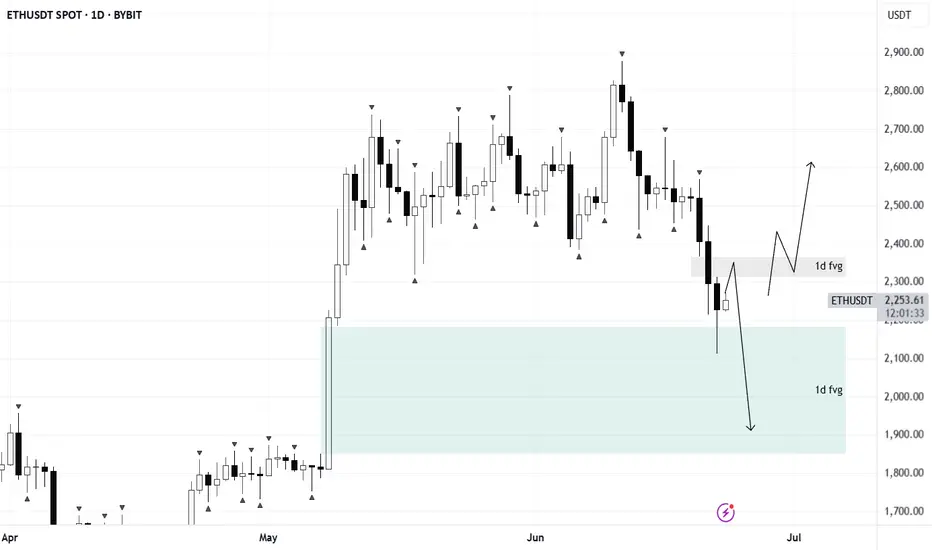
ETH/USDTPrice has entered a daily long FVG zone. For long setups to be valid, we’d like to see a short FVG inversion play out.
If no bullish reaction follows, the bias shifts to shorts — with potential downside targets in the $2000–$1800 range. Wait for confirmation before taking action.
USDT.D LONG - MID TERM PLANUSDT.D is one of the best tools to understand what's happening in the crypto market.
It shows the dominance of USDT across the entire space — and has a strong inverse correlation with BTC and crypto assets.
Technicals:
USDT.D is approaching its long-term support trendline.
I expect a deviation below that line — possibly toward the 0.75 Fibonacci level — before a strong move up.
That move could last 1–3 months, which means more downside for alts during this time.
Plan:
Shorting altcoins — especially ETH-related tokens and memecoins.
Looking to buy back around early August.

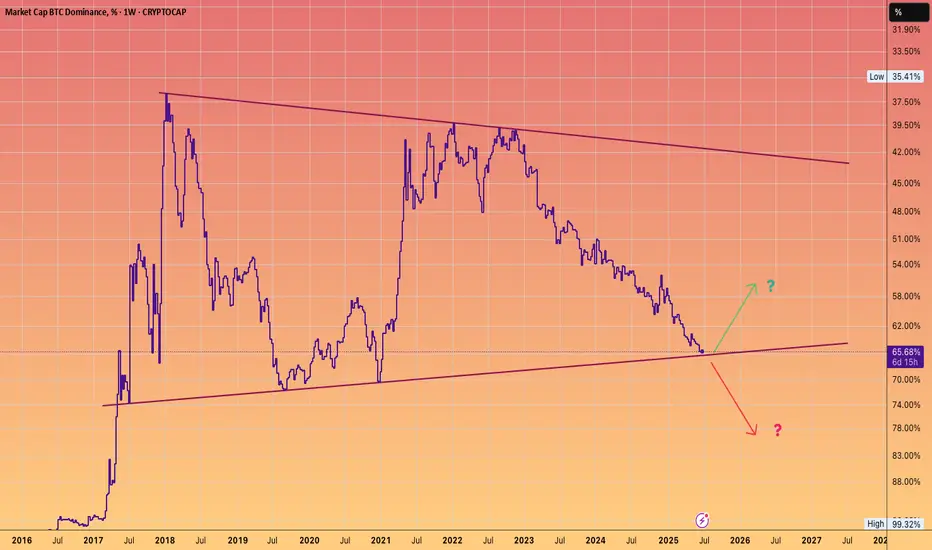
BTC DOMINANCE at pivotal juncture.Which direction do you favour?
The chart is inverted, so the up move will result in #Alts outperforming #Bitcoin.
Bullish bounce off 50% Fibonacci support?The Ethereum (ETH/USD) is reacting off the pivot which has been identified as an overlap support and could bounce to the 1st resistance.
Pivot: 2,089.45
1st Support: 1,669.20
1st Resistance: 2,687.43
Risk Warning:
Trading Forex and CFDs carries a high level of risk to your capital and you should only trade with money you can afford to lose. Trading Forex and CFDs may not be suitable for all investors, so please ensure that you fully understand the risks involved and seek independent advice if necessary.
Disclaimer:
The above opinions given constitute general market commentary, and do not constitute the opinion or advice of IC Markets or any form of personal or investment advice.
Any opinions, news, research, analyses, prices, other information, or links to third-party sites contained on this website are provided on an "as-is" basis, are intended only to be informative, is not an advice nor a recommendation, nor research, or a record of our trading prices, or an offer of, or solicitation for a transaction in any financial instrument and thus should not be treated as such. The information provided does not involve any specific investment objectives, financial situation and needs of any specific person who may receive it. Please be aware, that past performance is not a reliable indicator of future performance and/or results. Past Performance or Forward-looking scenarios based upon the reasonable beliefs of the third-party provider are not a guarantee of future performance. Actual results may differ materially from those anticipated in forward-looking or past performance statements. IC Markets makes no representation or warranty and assumes no liability as to the accuracy or completeness of the information provided, nor any loss arising from any investment based on a recommendation, forecast or any information supplied by any third-party.

ETH Weekly – Eyes on $1900When panic creeps in, zoom out.
ETH on the weekly has lost both the 200MA and the 0.5 Fib.
In my opinion, if the BB center doesn’t hold here, price could retest the 0.618 Fib level a zone it tends to flirt with often.
The $1900 area might become a solid buy zone.
Always take profits and manage risk.
Interaction is welcome.

Anti-bart in July for ETHWherever it bottoms, this is THE dip to buy. Analogue forecasting with fractals similar to the ones I make for Bitcoin. Let's try this.

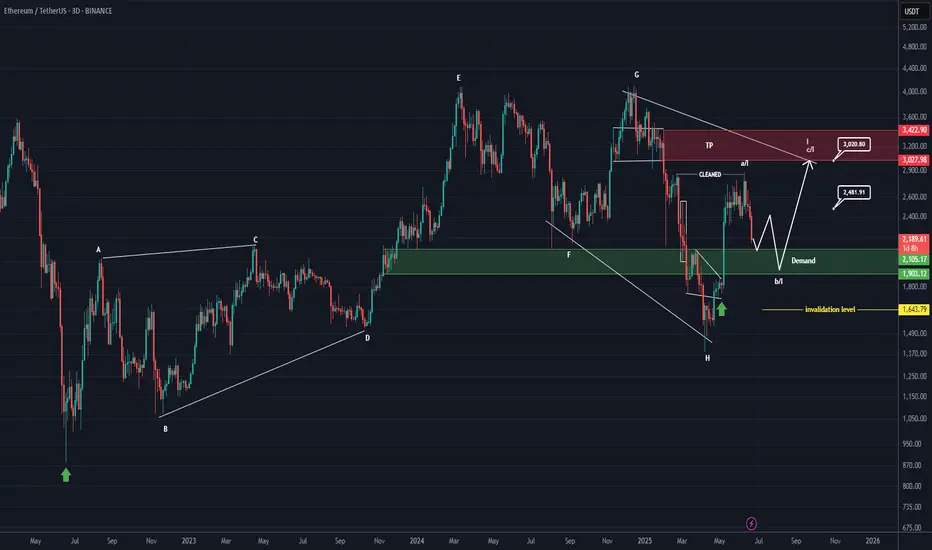
ETHEREUM Analysis (3D)First of all, pay close attention to the timeframe | it's a higher timeframe.
From the point where we placed the green arrow on the chart, Ethereum appears to have entered a bullish phase | specifically, a symmetrical pattern.
It currently seems to be in wave I of this symmetrical structure, which is the final wave. Wave I itself appears to be composed of three parts (ABC). At the moment, Ethereum seems to be in wave b of wave I.
We expect wave b of I to complete within the green zone, after which the price would move into wave c of I.
The price seems inclined to complete wave b of I near the bottom of the green zone.
Targets are marked on the chart.
In the green zone, it’s no longer reasonable to look for Sell/Short positions, especially when the price is approaching the bottom of the green area.
A weekly candle close below the green zone would invalidate this analysis.
For risk management, please don't forget stop loss and capital management
When we reach the first target, save some profit and then change the stop to entry
Comment if you have any questions
Thank You
ETH NEW UPDATE (8H)This analysis is an update of the analysis you see in the "Related publications" section
After the pump and hitting the red zone, it got rejected.
It's better not to open a short position on Ethereum, as its dominance appears bullish | which means it might be resilient against a potential drop.
The closing of a daily candle above the invalidation level will invalidate this analysis.
For risk management, please don't forget stop loss and capital management
Comment if you have any questions
Thank You


$ETH: The 1-week chart is an absolute disaster!Once again, I want to make it clear: I’m naturally a bull. But I live in Thailand, far from the noise of influencers shouting "buy, buy, buy!" I’ve learned my lesson—when they scream buy, you get rekt. That’s why I rely solely on the charts.
Charts are just mathematics—they don’t lie. So here’s my honest interpretation of what I’m seeing for Ethereum:
🕐 Daily Outlook
Yes, we might see a few nice bounces in the short term. But if your plan is to hold ETH, you should be paying attention to higher timeframes, especially the weekly.
📉 Weekly Chart — It's Ugly
We’re clearly in a descending wedge, and overall, ETH is bearish. Don’t be fooled by the hype or the people trying to take your money.
- RSI is bearish, with a strong bearish divergence still unfolding.
- MACD is on the verge of a bearish crossover, and what’s worse, it’s doing that without even touching the neutral zone—a major red flag.
The last time we saw this setup? November 2021. The price crashed below $1,000.
🔍 Where’s the Support?
This cycle, the support zone looks closer to $1,500, mainly due to institutional interest and the ETF narrative. A full retracement seems unlikely, but technically speaking—it’s still a possibility.
🤔 Why Is This Happening Despite Institutional FOMO?
Here’s the key: ETH has staking, and every month, new CRYPTOCAP:ETH is minted to pay stakers. This creates constant inflation. On top of that, many stakers compound their rewards, accelerating the inflation. And guess what? These same stakers are selling as soon as ETH pumps.
So fundamentally, Ethereum is under pressure because of its own staking mechanics—a system flaw that creates long-term selling pressure.
Do your own research (DYOR). I could be wrong—but at least I’m not trying to sell you a course.

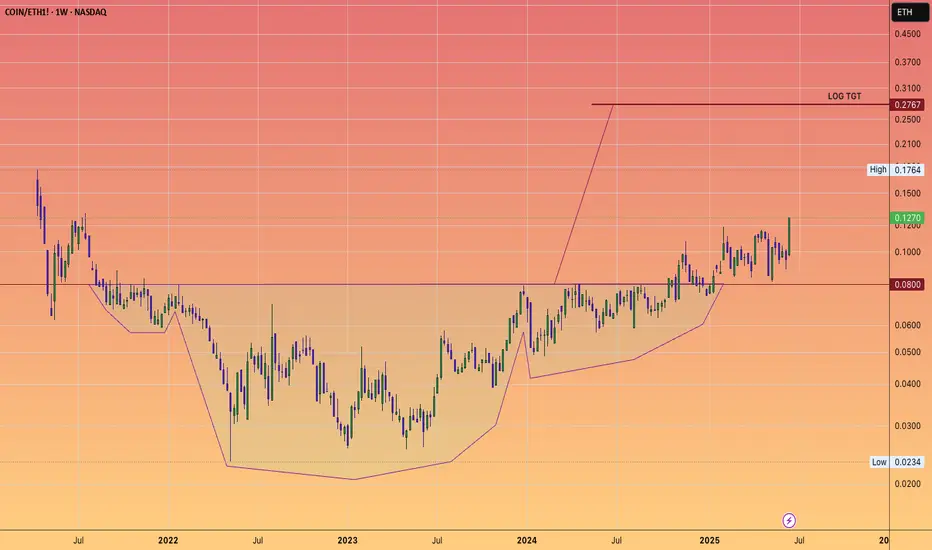
The Chart you don't want to see: Coinbase Vampire attacked ETHBrian Armstrong is a significant influencer in both Silicon Valley and now Washington, D.C., where he is instrumental in shaping legislation and attracting investments that benefit Coinbase and its shareholders.
Vitalik writes blogs and appoints EF directors who appear to have ambiguous gender identities and are quite out there on the spectrum.
Jesse Pollak is yet another astute player who has leveraged ETH's technology to transform BASE into a powerhouse integrating neatly into Coinbase platform for payments and now DEX trading within app.
ETH will thrive.
However, as we've observed, Joe Lubin's return as a public figure to advocate for and steer the future of Ethereum has never been more crucial.
But will it be sufficient to compete with Brian and Jesse? They seem to be operating on a significantly higher plane.
ETH 4H – Testing Support, Rejected by Weekly 200MAOn the 4H, ETH is closing below the weekly 200MA but is trying to hold the last daily close as support—similar to what it did on June 5 at 20:00.
The difference: back then, the 4H 200MA acted as support; now it’s been clearly rejected and price sits well below it.
With the weekly close approaching, if ETH stays under the weekly 200MA, there's a strong chance it revisits the range low support.
However, if it manages to reclaim the 200MA before the close, a move toward the last two weekly closes may still be on the table.
Always take profits and manage risk.
Interaction is welcome.

BRIEFING Week #25 : Heading into Summer ModeHere's your weekly update ! Brought to you each weekend with years of track-record history..
Don't forget to hit the like/follow button if you feel like this post deserves it ;)
That's the best way to support me and help pushing this content to other users.
Kindly,
Phil

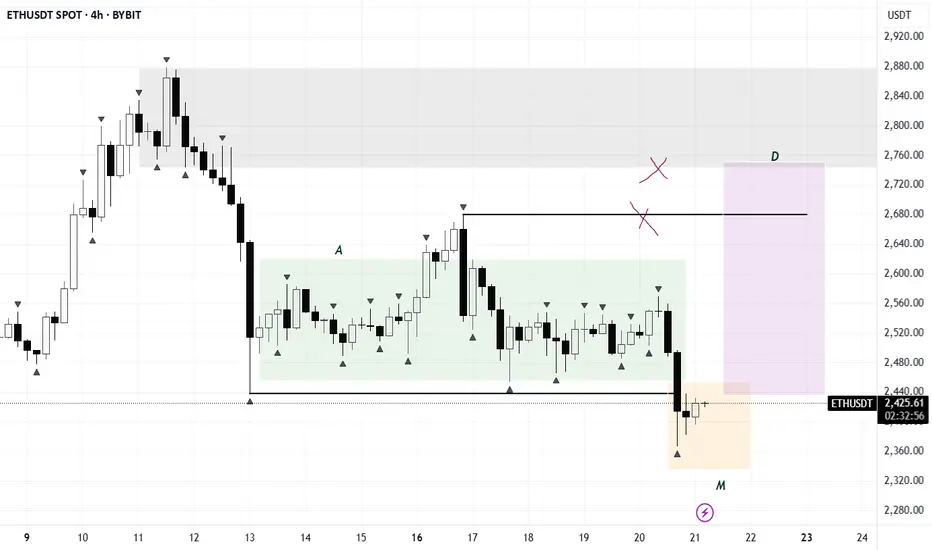
ETH/USDTFollowing the consolidation phase, we’ve seen a clear manipulation move — the structure closely resembles an AMD setup. As long as the pattern holds, upside targets are in the $2700–$3000 range.
ETHUSDT – LAST HOPE FOR BULLS!Hey Traders!
If you’re finding value in this analysis, smash that 👍 and hit Follow for high-accuracy trade setups that actually deliver!
ETH has officially broken below the ascending channel support and is now testing the final demand zone (highlighted in green). This zone also aligns with the 200 EMA on the 12H timeframe — historically a strong dynamic support.
📉 If ETH fails to hold this green box, it could trigger a deeper correction, potentially dragging the price back towards the $2,200–$2,100 range.
✅ Bullish Case: A quick reclaim of the $2,460–$2,500 area followed by strong volume could invalidate this breakdown and bring back momentum toward $2,800.
🚨 Bearish Confirmation: A clean close below $2,400 on the 12H/Daily with rejection wicks would open the floodgates for lower targets.
💡 This is a make-or-break moment. Bulls need to defend this zone with strength — or risk handing over full control to the bears.
📍 Levels to Watch:
Support: $2,360 / $2,280 / $2,120
Resistance: $2,500 / $2,660 / $2,800
📊 Stay cautious, stay prepared. Follow for real-time crypto breakdowns & setups.

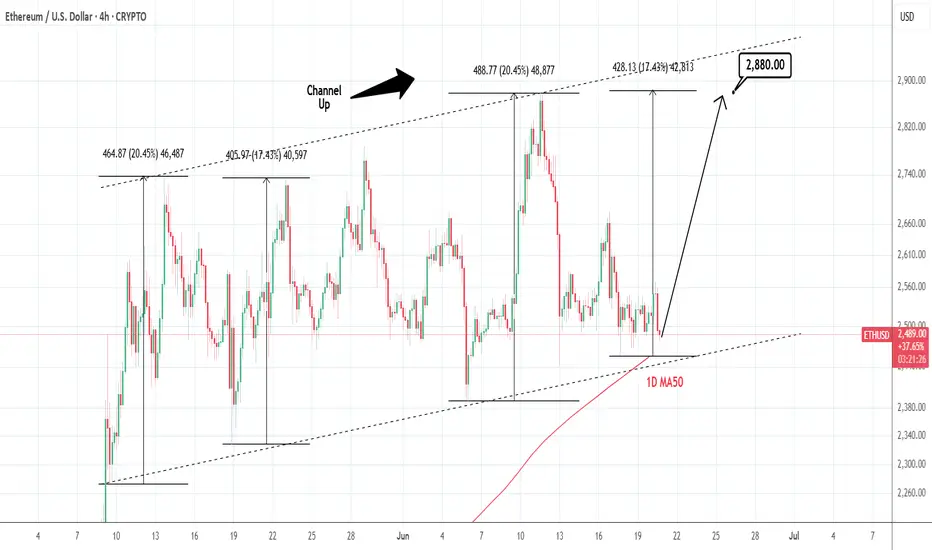
ETHUSD: Channel Up testing 1D MA50. Optimal buy.Ethereum is neutral on its 1D technical outlook (RSI = 47.020, MACD = 17.220, ADX = 20.205), consolidating for the past 3 days. This time it is about to test the 1D MA50, which is technically the long term Support. Since it is also almost at the bottom of the Channel Up, we see this as the most optimal level to buy and aim for the same +17.43% rise (TP = 2,880) it did in May.
## If you like our free content follow our profile to get more daily ideas. ##
## Comments and likes are greatly appreciated. ##
ETH - Do you Notice a Pattern here? I DO...Hello TradingView Family / Fellow Traders. This is Richard, also known as theSignalyst.
📈I find ETH 4h chart as it looks like history repeating itself.
Previously in 1 to 5 June, it formed a slight lower low before starting the next big bullish impulse leading towards the upper bound of the channel.
📚 Today, ETH just formed the slight lower low we are looking for.
Is it time for the next bullish impulse to start? well it will be confirmed after breaking above the last major high at $2,600.
What do you think?
📚 Always follow your trading plan regarding entry, risk management, and trade management.
Good luck!
All Strategies Are Good; If Managed Properly!
~Rich
