Dow Jones (US30) — Bullish Momentum, But a Retest AheadUS30 — Preparing for a Retest Before Higher Push
Subtitle: Technical Outlook — 27 June 2025
📈 Current Market Condition
The US30 index has shown strong bullish momentum, breaking above prior resistance around 43,000 and extending towards 43,500. Price is currently above both the 50 EMA (blue) and 200 EMA (red), reflecting a bullish structure. However, the Stochastic indicator signals overbought conditions, suggesting the index may be due for a pullback or consolidation before attempting to break higher into the 44,500–44,750 resistance zone.
🔑 Key Technical Highlights
Structure: Price broke above consolidation zone 42,750–43,000, retesting higher levels.
50 EMA (blue): Positioned near 42,750, acting as dynamic support.
200 EMA (red): Below at 42,200, major trend support.
Stochastic: Overbought — risk of a short-term correction or sideways move before continuation.
Resistance: Major resistance at 44,500–44,750.
Support: Immediate support at 43,000–43,250, deeper at 42,500.
📝 Trade Plan
Bullish Breakout (Long)
Trigger: Retest and hold of 43,000–43,250 zone with bullish confirmation (e.g. bullish engulfing, hammer).
Target: 44,500 / 44,75
Stop-loss: Below 42,900
Bearish Rejection (Short)
Trigger: Strong rejection from 44,500 with bearish reversal pattern.
Target: 43,250 / 42,750
Stop-loss: Above 44,700
Dip Buy
Trigger: Price tests 42,750 (50 EMA) and shows bullish reversal.
Target: 43,500 / 44,500
Stop-loss: Below 42,500
⚠️ Risk Management Note
US30 is trading in extended conditions, so chasing price here carries risk of getting caught in a pullback. Use staggered entries and adjust position size relative to volatility. Watch out for upcoming macroeconomic releases that could trigger sharp moves.
If you found this analysis valuable, kindly consider boosting and following for more updates.
Disclaimer: This content is intended for educational purposes only and does not constitute financial advice.
D-US30

Nasdaq100OANDA:NAS100USD
3. And Then price will begin to push down strong. This will happen only if there will be a very strong spike meaning an incredible amount of sells pushing the price down.

DOW JONES INDEX (US30): Consolidation is Over
Dow Jones Index completed a bullish accumulation on a daily.
The price violated a key horizontal resistance cluster and closed above that.
Next goal for bulls is 43790.
❤️Please, support my work with like, thank you!❤️
I am part of Trade Nation's Influencer program and receive a monthly fee for using their TradingView charts in my analysis.

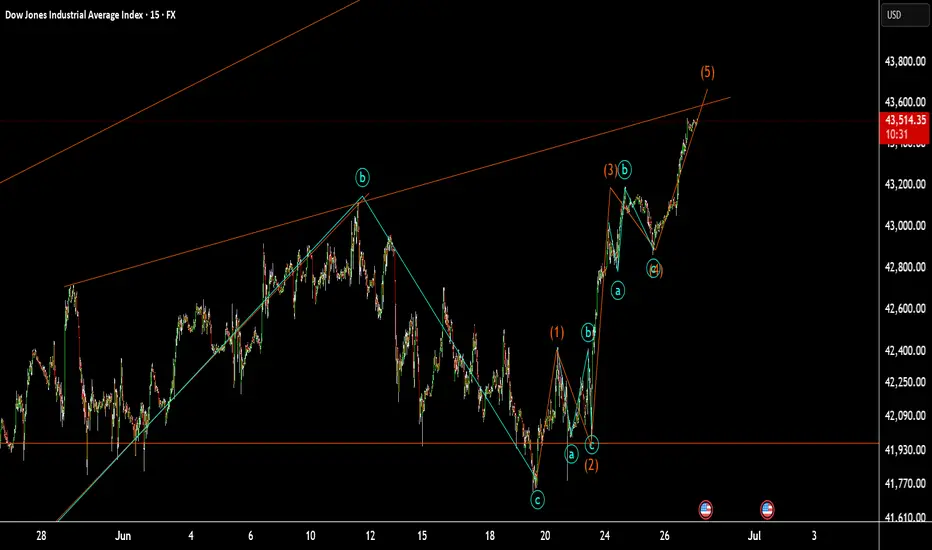
US30 at small resistanceUS30 at small resistance:
as I counter these wave we are in wave 5. it might be goes up to the maim trend Line in previous analysis.
Dollar Index Bearish to $96 (UPDATE)I posted this DXY sell thesis yesterday for you all while price was still at $97.70. Since then sellers have taken out the previous Wave 3 low, creating a new daily low today at $96.90📉
We still have more downside yet to come towards our $96.60 target. So, use this 'DXY Sell Thesis' to help you with your trading, so once you can use this as a confluence to buy inverse correlated markets

US30 - ShortLooking for the Short on US30 final pull back before we see extension to the upside 45,000.

DOW JONES: Technical pullback possible but 43,700 target remainsDow Jones is bullish on its 1D technical outlook (RSI = 62.550, MACD = 276.720, ADX = 11.070), extending the bullish wave of the 1 month Channel Up. This is only the second such wave of this pattern and its first pulled back to the 0.5 Fiboancci retracement level after making a +3.75% rise. It is possible to see such a retrace start either now or tomorrow but on the medium term the bullish target on the 1.236 Fibonacci extension is intact (TP = 43,700).
## If you like our free content follow our profile to get more daily ideas. ##
## Comments and likes are greatly appreciated. ##

DowJones bullish breakout supported at 42240Key Support and Resistance Levels
Resistance Level 1: 43200
Resistance Level 2: 43544
Resistance Level 3: 43900
Support Level 1: 42240
Support Level 2: 41740
Support Level 3: 41280
This communication is for informational purposes only and should not be viewed as any form of recommendation as to a particular course of action or as investment advice. It is not intended as an offer or solicitation for the purchase or sale of any financial instrument or as an official confirmation of any transaction. Opinions, estimates and assumptions expressed herein are made as of the date of this communication and are subject to change without notice. This communication has been prepared based upon information, including market prices, data and other information, believed to be reliable; however, Trade Nation does not warrant its completeness or accuracy. All market prices and market data contained in or attached to this communication are indicative and subject to change without notice.

US30 - Long 43,150Still looking for that 43,150 lets get a test of FVG then on bullish PA above we can plan trade. Stops would go below the order block.

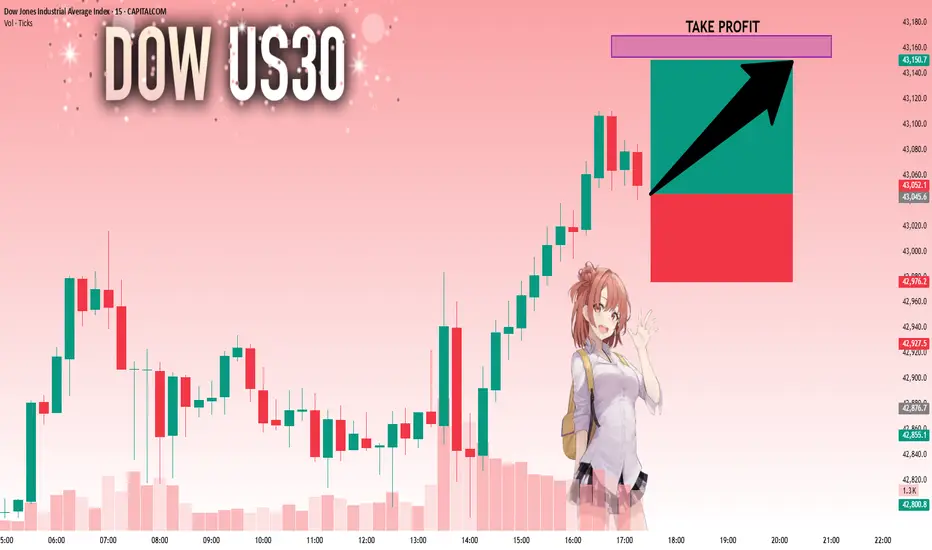
Bullish bounce for the Dow Jones?The price is falling towards the pivot which has been identified as an overlap support and could bounce from this level to our take profit.
Pivot: 42,588.80
1st Support: 42,119.27
1st Resistance: 43,222.33
Risk Warning:
Trading Forex and CFDs carries a high level of risk to your capital and you should only trade with money you can afford to lose. Trading Forex and CFDs may not be suitable for all investors, so please ensure that you fully understand the risks involved and seek independent advice if necessary.
Disclaimer:
The above opinions given constitute general market commentary, and do not constitute the opinion or advice of IC Markets or any form of personal or investment advice.
Any opinions, news, research, analyses, prices, other information, or links to third-party sites contained on this website are provided on an "as-is" basis, are intended only to be informative, is not an advice nor a recommendation, nor research, or a record of our trading prices, or an offer of, or solicitation for a transaction in any financial instrument and thus should not be treated as such. The information provided does not involve any specific investment objectives, financial situation and needs of any specific person who may receive it. Please be aware, that past performance is not a reliable indicator of future performance and/or results. Past Performance or Forward-looking scenarios based upon the reasonable beliefs of the third-party provider are not a guarantee of future performance. Actual results may differ materially from those anticipated in forward-looking or past performance statements. IC Markets makes no representation or warranty and assumes no liability as to the accuracy or completeness of the information provided, nor any loss arising from any investment based on a recommendation, forecast or any information supplied by any third-party.

GOLD - SHORT TO $2,800 (VIDEO ANALYSIS)Confluences👇
⭕️Wave 3 Peaked at Psychological Number of $2,500 (LQ Point).
⭕️Minor Wave 1 & 2 of Major Wave 4 Complete. But Wave 3 Pending.
⭕️Thin Liquidity In The Markets.
⭕️Gold Overbought/DXY Oversold.
✅HUGE 4,700 PIPS (14% ROI) POTENTIAL PROFIT✅

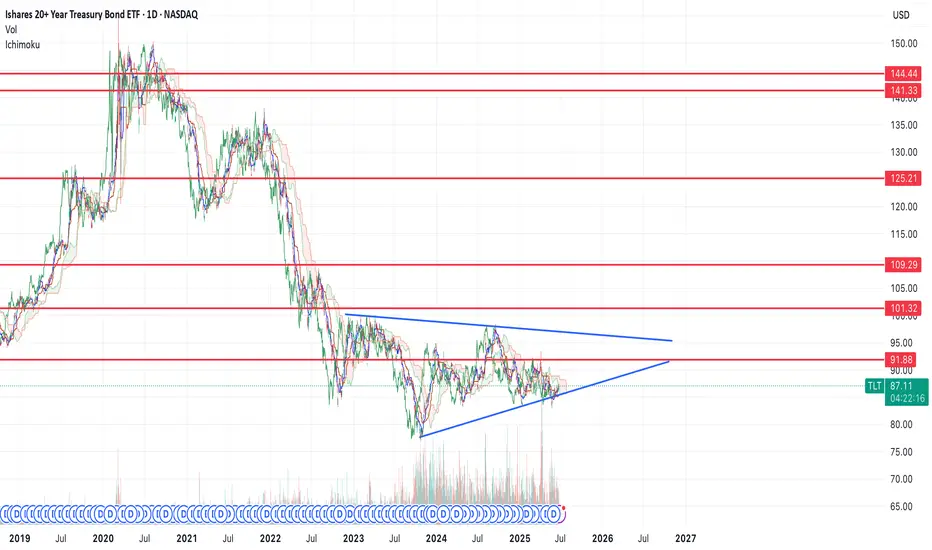
Bottom in for bonds, flight to safety trade coming soon $100+If we look at the chart of TLT, you can see that we're forming a bottoming reversal pattern.
We had a spike low down to $83 back to the middle of May and have now reclaimed the structure. I think that move marked the bottom.
I think it's very likely that bonds spike in the near future, if they can make it over the $92 resistance level, then I think price will see continuation and likely break the pattern finding the first resistance at that $101 level.
That said, I think this is the start of a larger move higher in bonds that will take us all the way up to the top resistance levels over the course of the next few years before the move is done and we start the long term trend in rates higher.
US30 - Entries ActiveAs anticipated got the sweep below then break above our area with a U shape formation. Looking to the upside.
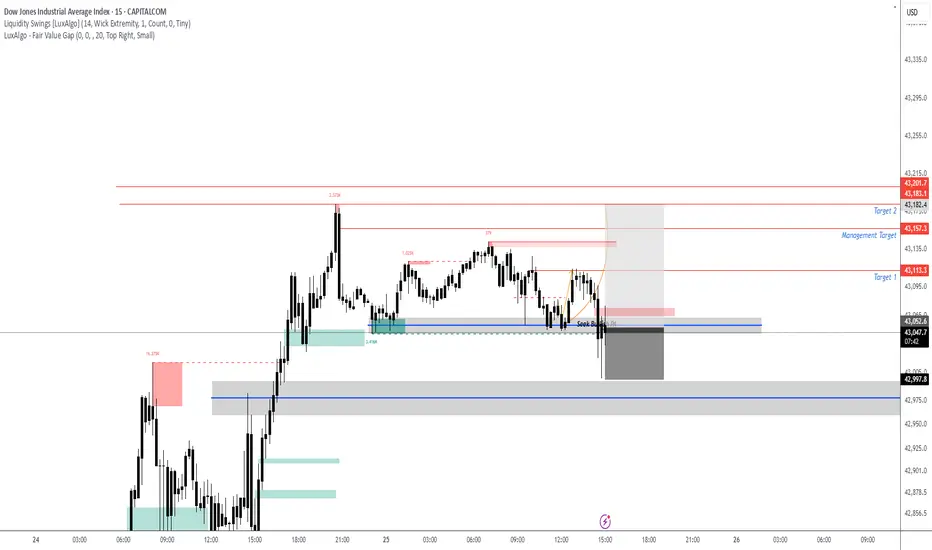
US30 - Final Push before PullbackPotentially another push to upper levels of supply potentially 43,150-43,200. Can see this retest before seeing a potential pull back based off larger time frame.

Why I’m Sitting Out: US30 Reaches Critical Range HighI’m currently keeping a close eye on the US30, along with the other major indices 🧐. What stands out the most right now is how overextended this rally has become across the board 📈.
The key concern here is that price has now pushed into a previous external range high, sweeping liquidity resting just above that level 💧. This area is a textbook zone where big money often steps in to offload positions — it’s the perfect place for institutions to find willing counterparties after prior accumulation 📍💼.
Given the aggressive nature of this move and how far price has stretched, I’m extremely hesitant to get involved at this stage 🚫. I have zero interest in buying into a market that’s trading at a premium and sitting at a potential reversal zone ⚠️.
The prudent move here is to wait for a retrace, followed by a bullish break in structure before considering re-entry 🔁📈. Sometimes, the most powerful edge in trading is knowing when not to trade — and for me, today is one of those days.
⚠️ This is not financial advice — just sharing my current perspective on the market.

US30: The Market Is Looking Up! Long!
My dear friends,
Today we will analyse US30 together☺️
The price is near a wide key level
and the pair is approaching a significant decision level of 43,045.6 Therefore, a strong bullish reaction here could determine the next move up.We will watch for a confirmation candle, and then target the next key level of 43,152.9.Recommend Stop-loss is beyond the current level.
❤️Sending you lots of Love and Hugs❤️
DowJones INTRADAY key trading levelsKey Support and Resistance Levels
Resistance Level 1: 43200
Resistance Level 2: 43550
Resistance Level 3: 43900
Support Level 1: 42240
Support Level 2: 41740
Support Level 3: 41280
This communication is for informational purposes only and should not be viewed as any form of recommendation as to a particular course of action or as investment advice. It is not intended as an offer or solicitation for the purchase or sale of any financial instrument or as an official confirmation of any transaction. Opinions, estimates and assumptions expressed herein are made as of the date of this communication and are subject to change without notice. This communication has been prepared based upon information, including market prices, data and other information, believed to be reliable; however, Trade Nation does not warrant its completeness or accuracy. All market prices and market data contained in or attached to this communication are indicative and subject to change without notice.

DOW JONES about to skyrocket based on the Gold/Silver ratio!Dow Jones (DJI) has been basically consolidating for the past month or so, following the massive April 7th bottom rebound but there is a very distinct indicator that shows it is about to skyrocket.
That is the Gold/ Silver ratio (blue trend-line). Gold (XAUUSD) as a safe haven, attracts capital in times of market uncertainty. Silver (XAGUSD), as a metal of industrial use, attracts capital in times of economic boom and prosperity.
In the past 6 years more particularly, every time the Gold/ Silver ratio declined, Dow started rising aggressively (exception July-Aug 2019, when the market rose straight after), as investors clearly showed their risk-on appetite by buying Silver (optimism) at the expense of Gold (fear).
Dow's current consolidation indicates that there may be high accumulation in the past month and the ratios extended decline suggests a skyrocket move is up next.
-------------------------------------------------------------------------------
** Please LIKE 👍, FOLLOW ✅, SHARE 🙌 and COMMENT ✍ if you enjoy this idea! Also share your ideas and charts in the comments section below! This is best way to keep it relevant, support us, keep the content here free and allow the idea to reach as many people as possible. **
-------------------------------------------------------------------------------
💸💸💸💸💸💸
👇 👇 👇 👇 👇 👇

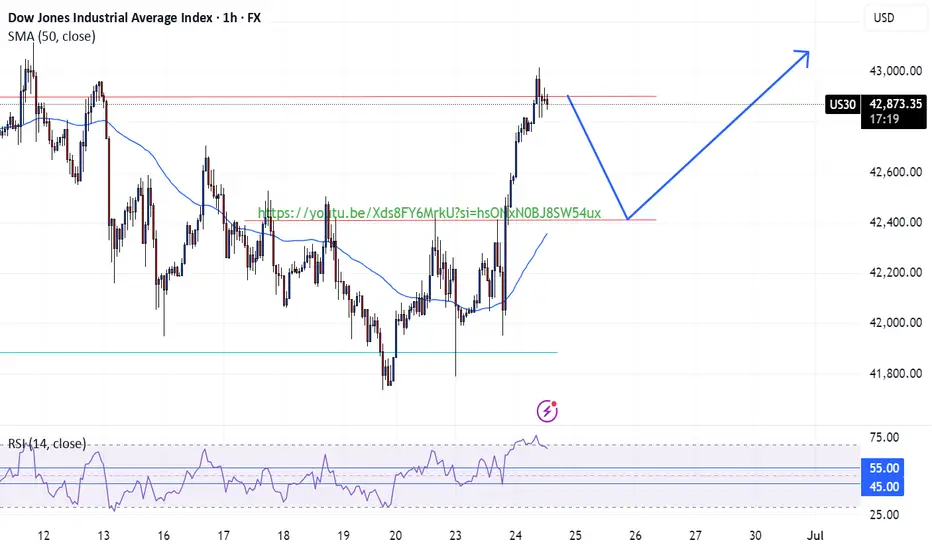
US30 Long Opportunity US30 shows strong bullish confluences at the opening of the week, currently testing the resistance level at 42,900. Price is above above the 50 SMA and favors bullish momentum per the RSI above 55.
Potentially retracement towards the break and retest level at 42,400 where we could see a potential continuation of the bullish trend after the market collects enough liquidity.
This is support by fundamentals of the day being the cease fire between Iran-Israel. investor more comfortable taking risks and stepping back into the indices.
Dow Jones Gains on Rate Cut Hopes and Ceasefire Relief US30 OVERVIEW
Wall Street Rises on Fed Rate Cut Hopes and Geopolitical De-escalation
The Dow Jones (US30) remains under bullish pressure, supported by rising expectations of a Federal Reserve rate cut later this year and a ceasefire agreement between Iran and Israel, which has eased market tensions.
TECHNICAL OUTLOOK – US30
The price maintains a bullish bias as long as it trades above the pivot level at 42,810, with upside potential toward the key resistance at 43,210.
A short-term bearish correction is possible toward 42,810 or even 42,670, but the broader structure remains bullish above these levels.
Resistance Levels: 43,060 → 43,210 → 43,350
Support Levels: 42,670 → 42,420 → 42,160
A sustained break below 42,670 could signal deeper correction, while a clear move above 43,210 would confirm continued bullish momentum.

US30 - Intraday long scalp then short Looking for that intraday scalp on the long around 120 points can hold potentially further up to our higher supply level. If bearish PA is confirmed around the 43,000 level can look to take this short. All dependent on PA.

US30 Will Grow!
HI,Traders !
#US30 is trading in an
Uptrend and the Indice
Made a bullish breakout
And a pullback so affter
The retest of the broken
Falling resistance which
Is now a support we will
Be expecting a further
Bullish move up !
Comment and subscribe to help us grow !

US 30 the 5th wave US 30 the 5th wave this is not an impulse wave totally.
just the conflict of is going to be peace so if we look at OIL we can see everything is good.
