US30 Market breadth EMA20 [INVESTIC]Introducing our Market Breadth Indicator for the Dow Jones Industrial Average (DJIA), based on the 20-day Exponential Moving Average (EMA). This tool is designed for traders looking to gauge short-term market sentiment and momentum within the Dow. By tracking how many of the 30 Dow Jones stocks are trading above their 20-day EMA, this indicator offers a quick and precise snapshot of the market’s short-term strength or weakness.
Traders can use this shorter-term market breadth indicator to identify emerging trends, confirm the direction of the market, and make more timely trading decisions. The 20-day EMA provides a more responsive view of market conditions compared to the longer days EMA, making it ideal for traders focused on capturing near-term movements. Displayed as a histogram ranging from 0 to 30, the indicator helps you quickly assess how many Dow Jones stocks are in a bullish or bearish stance over the short term.
🔶Usage
The Market Breadth based on the 20-day EMA is perfect for traders of all styles, from those who thrive on fast-paced intraday action to those with a longer-term view. Here’s how you can apply this indicator in different trading scenarios:
Intraday Trading:
Market Breadth is a powerful tool to spot shifts in momentum throughout the trading day. As the market moves, the histogram will quickly reflect changes in the number of stocks trading above their 20-day EMA, helping you identify potential entry or exit points.
As an example, this tool can be use to find short-term lows or peaks. As the histogram rises above the green zone in the session it may indicate increasing buying pressure, suggesting opportunities for quick long positions from the low.
Also it can help spot potential rebound in the near term, for example, a rising number of stocks while the index declines could signal a quick short-term trades.
Swing Trading:
Swing traders can use the Market Breadth to time trades more effectively within short- to medium-term trends. When the histogram is consistently high, it indicates that the majority of Dow stocks are experiencing short-term uptrends, making it a favorable environment to hold onto positions. However, if the histogram starts to drop, it may be an early warning that the trend is losing strength, prompting you to consider exiting or tightening your stop losses. This indicator helps you stay in tune with the market’s short-term direction, optimizing your swing trade entries and exits.
Longer-Term Trading:
While the 20-day EMA is more commonly associated with short-term analysis, it can still be valuable for longer-term traders who want to keep a pulse on shorter-term market movements. By monitoring the Market Breadth over weeks or months, you can spot when the market is reaching its peak or its low on a shorter timescale.
The 20-day EMA Market Breadth is a versatile tool that provides actionable insights across various trading horizons. Whether you’re looking to capture quick intraday moves, time your swing trades with precision, or keep an eye on short-term trends as part of a longer-term strategy, this indicator is designed to enhance your market analysis and trading decisions.
D-US30

Could price reverse from here?Dow Jones (US30) is rising towards the pivot which acts as a pullback resistance and could revers to the 23.6% Fibonacci support.
Pivot: 41,036.40
1st Support: 40,643.17
1st Resistance: 41,405.66
Risk Warning:
Trading Forex and CFDs carries a high level of risk to your capital and you should only trade with money you can afford to lose. Trading Forex and CFDs may not be suitable for all investors, so please ensure that you fully understand the risks involved and seek independent advice if necessary.
Disclaimer:
The above opinions given constitute general market commentary, and do not constitute the opinion or advice of IC Markets or any form of personal or investment advice.
Any opinions, news, research, analyses, prices, other information, or links to third-party sites contained on this website are provided on an "as-is" basis, are intended only to be informative, is not an advice nor a recommendation, nor research, or a record of our trading prices, or an offer of, or solicitation for a transaction in any financial instrument and thus should not be treated as such. The information provided does not involve any specific investment objectives, financial situation and needs of any specific person who may receive it. Please be aware, that past performance is not a reliable indicator of future performance and/or results. Past Performance or Forward-looking scenarios based upon the reasonable beliefs of the third-party provider are not a guarantee of future performance. Actual results may differ materially from those anticipated in forward-looking or past performance statements. IC Markets makes no representation or warranty and assumes no liability as to the accuracy or completeness of the information provided, nor any loss arising from any investment based on a recommendation, forecast or any information supplied by any third-party.

US30Dow Jones 4-hour time frame analysis
I expect the price to start correcting from this area until the swap zone is determined.
By seeing confirmation in these areas, we can expect price correction.

US30 shortsConfirmations:
1. Bearish 4hr 1hr Structure, 15 min and 5 min chart
2. Liquidity swept in 4hr 886 zone on 1hr
3.15 min institutional candle in 4hr 886 zone
4. Liquidity was taken on 1hr and trend line liquidity trend line target
5. 4hr imbalance as targets


DJIA H4 | Heading into swing-high resistanceDJIA (US30) is rising towards a swing-high resistance and could potentially reverse off this level to drop lower.
Sell entry is at 41,032.64 which is a swing-high resistance.
Stop loss is at 41,523.00 which is a level that sits above a swing-high resistance at the all-time high.
Take profit is at 40,417.18 which is a pullback support.
High Risk Investment Warning
Trading Forex/CFDs on margin carries a high level of risk and may not be suitable for all investors. Leverage can work against you.
Stratos Markets Limited (www.fxcm.com):
CFDs are complex instruments and come with a high risk of losing money rapidly due to leverage. 68% of retail investor accounts lose money when trading CFDs with this provider. You should consider whether you understand how CFDs work and whether you can afford to take the high risk of losing your money.
Stratos Europe Ltd, previously FXCM EU Ltd (www.fxcm.com):
CFDs are complex instruments and come with a high risk of losing money rapidly due to leverage. 73% of retail investor accounts lose money when trading CFDs with this provider. You should consider whether you understand how CFDs work and whether you can afford to take the high risk of losing your money.
Stratos Trading Pty. Limited (www.fxcm.com):
Trading FX/CFDs carries significant risks. FXCM AU (AFSL 309763), please read the Financial Services Guide, Product Disclosure Statement, Target Market Determination and Terms of Business at www.fxcm.com
Stratos Global LLC (www.fxcm.com):
Losses can exceed deposits.
Please be advised that the information presented on TradingView is provided to FXCM (‘Company’, ‘we’) by a third-party provider (‘TFA Global Pte Ltd’). Please be reminded that you are solely responsible for the trading decisions on your account. There is a very high degree of risk involved in trading. Any information and/or content is intended entirely for research, educational and informational purposes only and does not constitute investment or consultation advice or investment strategy. The information is not tailored to the investment needs of any specific person and therefore does not involve a consideration of any of the investment objectives, financial situation or needs of any viewer that may receive it. Kindly also note that past performance is not a reliable indicator of future results. Actual results may differ materially from those anticipated in forward-looking or past performance statements. We assume no liability as to the accuracy or completeness of any of the information and/or content provided herein and the Company cannot be held responsible for any omission, mistake nor for any loss or damage including without limitation to any loss of profit which may arise from reliance on any information supplied by TFA Global Pte Ltd.
The speaker(s) is neither an employee, agent nor representative of FXCM and is therefore acting independently. The opinions given are their own, constitute general market commentary, and do not constitute the opinion or advice of FXCM or any form of personal or investment advice. FXCM neither endorses nor guarantees offerings of third-party speakers, nor is FXCM responsible for the content, veracity or opinions of third-party speakers, presenters or participants.

US3015min bullish range, we are at htf OB, might be chance of swing high, need MSS to confirm on htf

DOW JONES Don't lose sight of the great picture. Still bullish.Last week, while Dow Jones (DJI) was still under its 1D MA50, we called for a major rally, as technically the 5-month Channel Up has just priced its new Higher Low:
The index has now almost reached the Target of the first Bullish Leg of this pattern, pointing to a potential relief next.
On the larger picture however (1M time-frame), we had posted an article named 'Secret Cycles' on April 12 2024 (see chart below), during Dow Jones' previous pull-back that again inflicted fear in the markets, calling for a strong buy:
It is this chart that we revisit and expand up today, as we don't think the long-term trend has changed. We want to maintain a clear long-term perspective and following August's massive recovery 1M candle, we believe that Dow will enter by Q4 2024, the final stage (rally) of its current Cycle.
That has historically been 1 year at least, so as long as the index keeps holding and closing the monthly candles above the 1M MA50 (red trend-line), we will continue buying all monthly dips. Our 48850 long-term Target is intact.
-------------------------------------------------------------------------------
** Please LIKE 👍, FOLLOW ✅, SHARE 🙌 and COMMENT ✍ if you enjoy this idea! Also share your ideas and charts in the comments section below! This is best way to keep it relevant, support us, keep the content here free and allow the idea to reach as many people as possible. **
-------------------------------------------------------------------------------
💸💸💸💸💸💸
👇 👇 👇 👇 👇 👇

US30 Will Go Higher From Support! Buy!
Please, check our technical outlook for US30.
Time Frame: 1D
Current Trend: Bullish
Sentiment: Oversold (based on 7-period RSI)
Forecast: Bullish
The market is on a crucial zone of demand 40,911.45.
The oversold market condition in a combination with key structure gives us a relatively strong bullish signal with goal 42,000.59 level.
P.S
We determine oversold/overbought condition with RSI indicator.
When it drops below 30 - the market is considered to be oversold.
When it bounces above 70 - the market is considered to be overbought.
Like and subscribe and comment my ideas if you enjoy them!

Additional rebound in US30 remains possible
US30 is showing a continuous uptrend as expectations for the US economy arise, along with the anticipation that Chairman Powell may provide clues about rate cuts at the Jackson Hole meeting. Goldman Sachs lowered its 12-month recession probability for the US economy from 25% to 20% following the release of July retail sales and jobless claims data.
The current market consensus is that the August employment report will determine future US30 price movements. Morgan Stanley stressed that the report's outcome will be the real test for the market, warning that a report showing weak employment would reignite growth concerns.
US30 quickly breached EMAs and continued its uptrend, rising above the trendline. The index needs an additional price trigger to retest its highs, but the current positive trend is expected to continue for the time being.
If US30 sustains support above the trendline, the index may gain upward momentum toward the 41500 high. Conversely, if US30 is pushed below the trendline and fails to hold above EMAs, the price may break the 39300 support and fall further to the 38000 level.


US30 TRADE IDEAUS30 still showing strong bullish momentum with a break above resistence followed by a retest while continuing to respect structure. A strong entry confirmation from the engulfing candlestick

US30 TRADE IDEAUS30 has been on an uptrend, indications of strong bullish momentum as price broke above resistence followed by a retest, the rejection is a confirmation for an enrty

US30 Bearish Bias!US30 has almost reached
The supply cluster of the
Falling and horizontal levels
So a move down is to be
Expected towards the
Target of 39411.7

Dow jones Potential UpsidesHey Traders, in tomorrow's trading session we are monitoring US30 for a buying opportunity around 40050 zone, Dow Jones is trading in an uptrend and currently is in a correction phase in which it is approaching the trend at 40050 support and resistance area.
Trade safe, Joe.

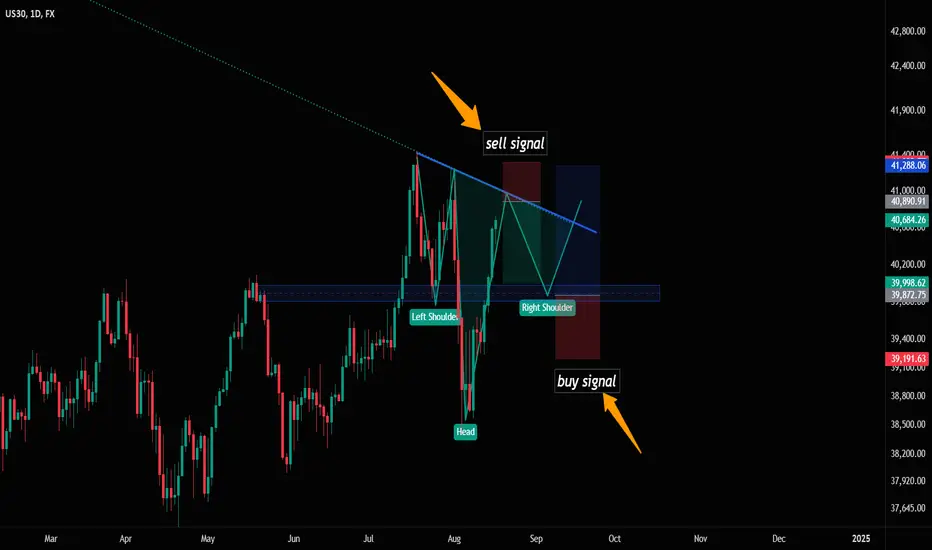
US30 SingalUS30 Analysis - Daily
In this analysis, we are anticipating the formation of a Head and Shoulders pattern. Based on this pattern:
Sell Entry Point: A sell signal has been triggered near the neckline and resistance area. If the neckline breaks downward, a significant bearish move is expected.
Buy Entry Point: If the price bounces off the identified support area below and fails to break down, a buy signal will be activated. In this scenario, the market could move towards higher targets.
Overall, we expect a continuation of the bearish move if the neckline is broken, but if not, a potential reversal to the upside is likely.