US30: Target Is Up! Long!
My dear friends,
Today we will analyse US30 together☺️
The price is near a wide key level
and the pair is approaching a significant decision level of 42.596.9 Therefore, a strong bullish reaction here could determine the next move up.We will watch for a confirmation candle, and then target the next key level of 42.690.5. Recommend Stop-loss is beyond the current level.
❤️Sending you lots of Love and Hugs❤️
D-US30

US30 Will Move Lower! Short!
Here is our detailed technical review for US30.
Time Frame: 12h
Current Trend: Bearish
Sentiment: Overbought (based on 7-period RSI)
Forecast: Bearish
The market is approaching a significant resistance area 42,464.8.
Due to the fact that we see a positive bearish reaction from the underlined area, I strongly believe that sellers will manage to push the price all the way down to 41,145.2 level.
P.S
The term oversold refers to a condition where an asset has traded lower in price and has the potential for a price bounce.
Overbought refers to market scenarios where the instrument is traded considerably higher than its fair value. Overvaluation is caused by market sentiments when there is positive news.
Disclosure: I am part of Trade Nation's Influencer program and receive a monthly fee for using their TradingView charts in my analysis.
Like and subscribe and comment my ideas if you enjoy them!

US500 potential buyUS500 is setting up for a classic Wyckoff spring. This is a high probability set up with high risk to reward (5R+)
Here is what needs to happen
For situations 1 and 2,
a. price should break blue support (traps sellers and shakes out weak hands)
b. price should then close above any of the 2 blue supports with high volume
c. enter at the close of that bar or retest of the blue line
d. T.P @ recent high.
What do you think? how would you approach this better?

SHORT ON US30US30 Has given us a change of character to the downside with a nice retest creating a lower high.
I will be selling us30 to the next demand zone looking to catch 500-1000 points.

S&P500 Index (US500): Bullish Accumulation Pattern
I spotted a nice example of an ascending triangle pattern on a daily time frame.
To confirm a bullish continuation, we will need a bullish breakout
of its neckline.
A daily candle close above 5996 will provide a reliable confirmation.
A rise will be anticipated at least to 6080 resistance then.
❤️Please, support my work with like, thank you!❤️
I am part of Trade Nation's Influencer program and receive a monthly fee for using their TradingView charts in my analysis.

US30 I Bearish Reversal Based on the M30 chart, the price is rising toward our sell entry level at 42,481.32, a pullback resistance that aligns with the 38.2% Fib retracement.
Our take profit is set at 42,326.96, a pullback support that aligns closely with the 50% Fib retracement.
The stop loss is set at 42,646.90, a swing high resistance.
High Risk Investment Warning
Trading Forex/CFDs on margin carries a high level of risk and may not be suitable for all investors. Leverage can work against you.
Stratos Markets Limited (tradu.com ):
CFDs are complex instruments and come with a high risk of losing money rapidly due to leverage. 63% of retail investor accounts lose money when trading CFDs with this provider. You should consider whether you understand how CFDs work and whether you can afford to take the high risk of losing your money.
Stratos Europe Ltd (tradu.com ):
CFDs are complex instruments and come with a high risk of losing money rapidly due to leverage. 63% of retail investor accounts lose money when trading CFDs with this provider. You should consider whether you understand how CFDs work and whether you can afford to take the high risk of losing your money.
Stratos Global LLC (tradu.com ):
Losses can exceed deposits.
Please be advised that the information presented on TradingView is provided to Tradu (‘Company’, ‘we’) by a third-party provider (‘TFA Global Pte Ltd’). Please be reminded that you are solely responsible for the trading decisions on your account. There is a very high degree of risk involved in trading. Any information and/or content is intended entirely for research, educational and informational purposes only and does not constitute investment or consultation advice or investment strategy. The information is not tailored to the investment needs of any specific person and therefore does not involve a consideration of any of the investment objectives, financial situation or needs of any viewer that may receive it. Kindly also note that past performance is not a reliable indicator of future results. Actual results may differ materially from those anticipated in forward-looking or past performance statements. We assume no liability as to the accuracy or completeness of any of the information and/or content provided herein and the Company cannot be held responsible for any omission, mistake nor for any loss or damage including without limitation to any loss of profit which may arise from reliance on any information supplied by TFA Global Pte Ltd.
The speaker(s) is neither an employee, agent nor representative of Tradu and is therefore acting independently. The opinions given are their own, constitute general market commentary, and do not constitute the opinion or advice of Tradu or any form of personal or investment advice. Tradu neither endorses nor guarantees offerings of third-party speakers, nor is Tradu responsible for the content, veracity or opinions of third-party speakers, presenters or participants.

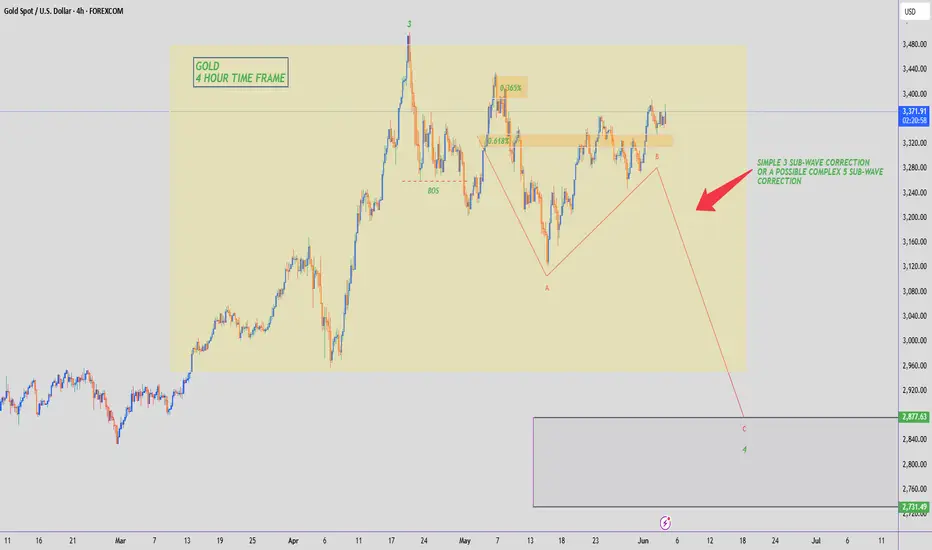
GOLD - WAVE 4 CORRECTION TO $2,800 (UPDATE)The 'resistance turned support' which I mentioned yesterday is holding up well. After the retest of the support zone, we're currently seeing bullish momentum keep Gold prices up.
As soon as Gold surpasses $3,400 & closes WITHIN the previous 0.365% zone, I will be sure that the 3 Sub-Wave (A,B,C) correction for sellers is over & buyers are now heading towards a new ATH. Until then I am still wary & being careful of sellers.
NASDAQ INDEX (US100): More Growth Ahead
For some unknown reason, I was asked by a dozen
of my subscribers to provide the update for US100.
Since early May, the index successfully updates the highs on a daily.
Such a tendency will remain at least till a test of a current ATH.
I think that the market is going to grow and reach at least 22100 level soon.
❤️Please, support my work with like, thank you!❤️

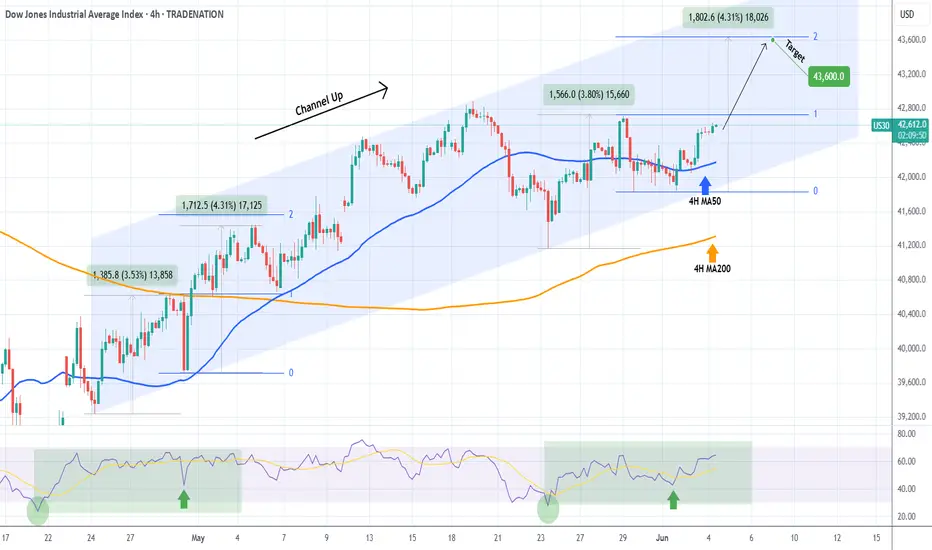
DOW JONES starting the new Bullish Leg.Dow Jones (DJI) is rallying off its 4H MA50 (blue trend-line), shortly after making a new Higher Low on its 6-week Channel Up. Technically that is the start of its new Bullish Leg.
With the 4H RSI being identical to the Bullish Leg at the start of the Channel Up, we expect it to again rise by +4.30% and touch the 2.0 Fibonacci extension. Target 43600.
-------------------------------------------------------------------------------
** Please LIKE 👍, FOLLOW ✅, SHARE 🙌 and COMMENT ✍ if you enjoy this idea! Also share your ideas and charts in the comments section below! This is best way to keep it relevant, support us, keep the content here free and allow the idea to reach as many people as possible. **
-------------------------------------------------------------------------------
Disclosure: I am part of Trade Nation's Influencer program and receive a monthly fee for using their TradingView charts in my analysis.
💸💸💸💸💸💸
👇 👇 👇 👇 👇 👇
US30 – Key Resistance at 42690 Ahead of ADP-Driven VolatilityUS30
The indices market is expected to be highly volatile today due to upcoming data releases, especially the ADP employment report.
Dow Jones (US30) appears to be continuing its bullish scenario toward 42690.
A break above 42690 may push the price further toward 42810, and if momentum holds, toward 43200.
However, stability below 42690 could trigger a strong correction toward 42460.
A sustained move below the pivot line at 42570 would shift the trend to bearish.
Resistance: 42690, 42810, 43200
Support: 42460, 42260, 42080

US30: Next Move Is Down! Short!
My dear friends,
Today we will analyse US30 together☺️
The recent price action suggests a shift in mid-term momentum. A break below the current local range around 42,499.2 will confirm the new direction downwards with the target being the next key level of 42,320.2.and a reconvened placement of a stop-loss beyond the range.
❤️Sending you lots of Love and Hugs❤️

DowJones INTRADAY broader concern over global trade headwindsTrade Tensions: US-China, US-Europe
Trump and Xi May Speak This Week: The call—if it happens—comes amid rising tensions over critical mineral exports, crucial for electronics and clean tech.
Market Implication: Ongoing uncertainty in US-China trade could pressure tech, EVs, and semiconductors, which rely on these materials. Watch for volatility in those sectors.
Europe Talks Stalling: Trade negotiations with Europe are also breaking down, with new tariff threats emerging.
Trading Angle: Defensive positioning in multinationals and exporters may be prudent. Currency pairs like EUR/USD could see movement on headline risk.
Corporate Layoffs: Disney, Microsoft
Disney & Microsoft Cut Jobs: Hundreds of layoffs in media and tech highlight continued weakness in entertainment and enterprise software demand.
Trading Relevance: Signals profit-margin pressure and shifting labor costs. Potential bearish signal for media ETFs and tech sector if layoff trend broadens.
China E-Commerce Firms Shift to Europe
Strategic Pivot: Chinese platforms are diversifying away from US markets due to tariffs and restrictions.
Market Watch: Could benefit European retail and logistics stocks. May also impact Chinese ADRs traded in the U.S.
Elon Musk’s xAI Debt Sale
$5B Debt Offering: Musk is raising capital for his AI venture, xAI Corp., while stepping back from politics.
Investor Focus: Watch Tesla and other Musk-related equities for capital allocation impacts. The move could dilute attention and increase risk premiums on his companies.
Harvard Legal Battle
Free Speech Lawsuit: Harvard pushes back on a Trump-era funding freeze.
Trading Impact: Limited direct effect, but feeds into broader political noise. May influence education sector stocks or legal/regulatory sentiment.
Wall Street Trade Idea (Nomura)
Strategy: Short S&P 500 on Trump trade threats, cover 5 days later → yielded 12% since February.
Application: Suggests short-term tactical trades can exploit volatility driven by political rhetoric. Useful for active traders focused on news-driven momentum.
Market Outlook
Futures Lower Today: Reflects broader concern over global trade headwinds.
Key Sectors to Watch: Tech (semis, EVs), Media, Chinese ADRs, European exporters, and AI-related plays.
Key Support and Resistance Levels
Resistance Level 1: 42920
Resistance Level 2: 43300
Resistance Level 3: 43620
Support Level 1: 41470
Support Level 2: 41160
Support Level 3: 40890
This communication is for informational purposes only and should not be viewed as any form of recommendation as to a particular course of action or as investment advice. It is not intended as an offer or solicitation for the purchase or sale of any financial instrument or as an official confirmation of any transaction. Opinions, estimates and assumptions expressed herein are made as of the date of this communication and are subject to change without notice. This communication has been prepared based upon information, including market prices, data and other information, believed to be reliable; however, Trade Nation does not warrant its completeness or accuracy. All market prices and market data contained in or attached to this communication are indicative and subject to change without notice.

DOW JONES: Inverse Head and Shoulders looking for a breakout.Dow Jones is marginally bullish on its 1D technical outlook (RSI = 55.600, MACD = 267.860, ADX = 21.901) as just now it is attempting to be detached from the 4H MA50. Technically this could be the attempt to break towards the 2.0 Fibonacci extension, after having formed the RS of an Inverse head and Shoulders pattern. With the 4H MACD close to a Bullish Cross, we are bullish, TP = 44,250.
## If you like our free content follow our profile to get more daily ideas. ##
## Comments and likes are greatly appreciated. ##

GOLD BULLISH TO $3,620 - $3,730Here's a breakdown video of how I used my EW strategy to identify the next bullish target for Gold towards a new ATH.
⭕️Wave 3 Peaked at $3,500.
⭕️Simple 3 Sub-Wave (A,B,C) Correction Complete for Wave 4.
⭕️Strong Support Zone at Wave 4 Low of $3,122.
⭕️Fibonacci Retracement Used to Target Wave 5 Target.

US30 SELLING ON DIPS !!HELLO TRADERS
AS I CAN SEE US30 is fail to break resistence zone after making a ATH its time to retrace as we can see bad econmy of US and GDP investors will pull money from stocks and invest in Safe haven so our Risk reward is great for us it is just a trade idea share ur thoughts stay tuned for more updates
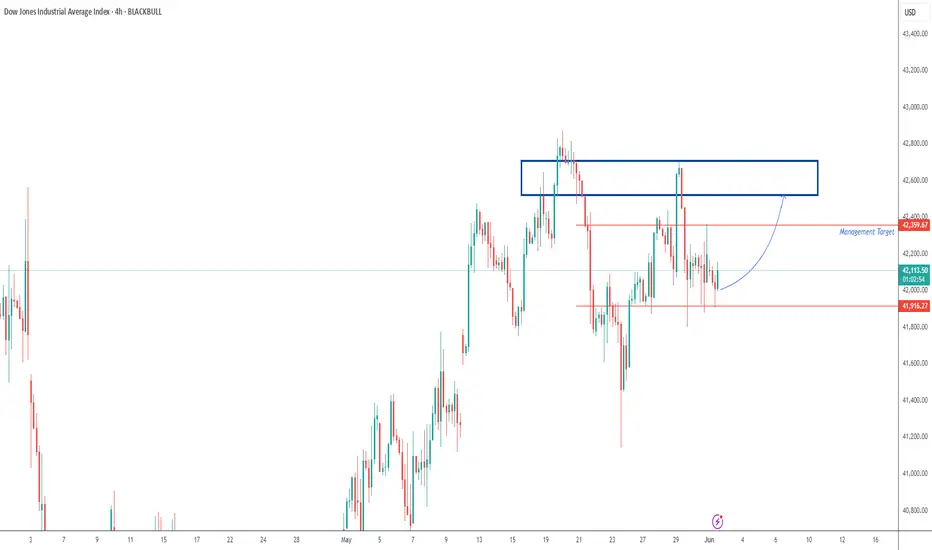
US30 JUNE 2What did the Buffalo say to his son when he left home? Bison...
Anyway, let's get to work. Price is looking very messy. So instead of trading it I'm going to draw a box around the consolidation and wait for price to break and retest the ends of the boxes.
Like always I'll wait for the 1m for price to break and retest before I enter the trade.
NEVER Trade Consolidation, it gets messy quickly.
Anywho... Have fun trading and be patient.

Gold 1H Intra-Day Chart 02.06.2025Huge push up on Gold on market open due to Russia - Ukraine war tension.
Option 1: Gold rejects from CMP and drops lower towards $3,270.
Option 2: If Gold closes bullish above $3,330 then $3,370 is the next major bullish target.
Which scenario do you find more likely?

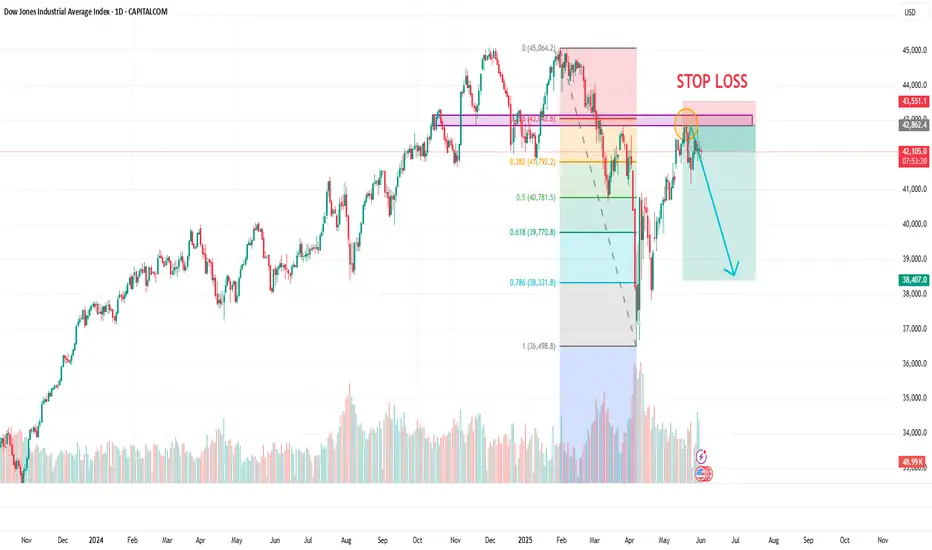
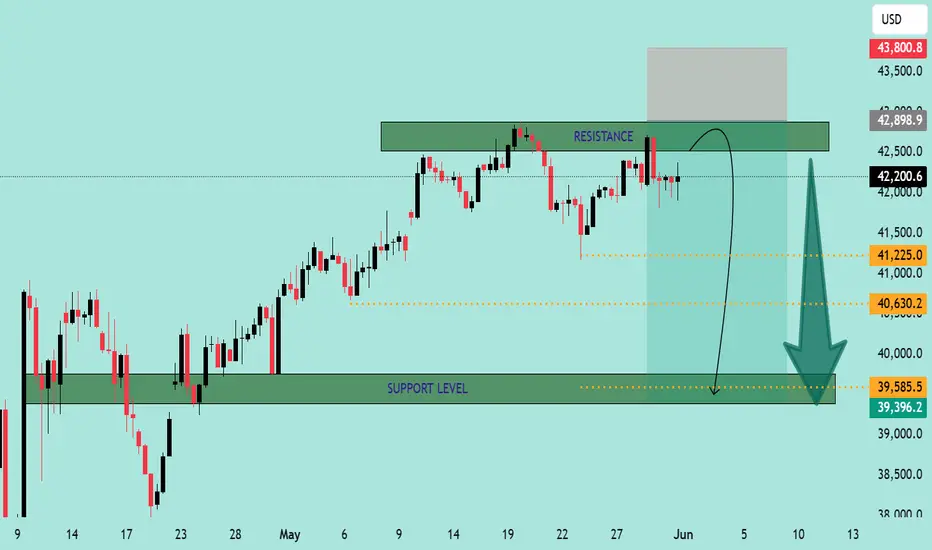
US30 Bearish Rejection at Resistance – Potential Drop Ahead📉 US30 Bearish Rejection at Resistance – Potential Drop Ahead 🚨
The US30 (Dow Jones Industrial Average) is exhibiting signs of bearish weakness after rejecting a strong resistance zone around 42,898.9 - 43,800.8. Here's a breakdown of the current market structure and outlook:
🔍 Technical Analysis
📌 Resistance Zone (Sell Pressure)
Price has failed to break above the marked resistance area multiple times.
Strong wicks and rejections indicate seller dominance near the top.
A short-term bounce into the resistance is anticipated before a likely reversal.
📌 Support Zone (Buy Interest)
The key support is at 39,396.2 - 39,585.5.
This zone has previously served as a strong demand area, with multiple bullish reversals in the past.
📌 Bearish Projection Path
Chart shows a potential rejection pattern playing out.
Price is expected to retest the resistance, then decline towards the support zone.
Intermediate support levels:
41,225.0
40,630.2
🔄 Outlook
🛑 Scenario A (Likely):
Price tests the upper resistance again and forms a double top or shooting star before declining toward the 39.5k support zone.
✅ Scenario B (Invalidation):
If price closes above 43,800 with strong volume, bearish bias will be invalidated, and a bullish continuation can be expected.
🧭 Trade Idea (Not Financial Advice)
🔹 Entry: Short near 42,800–43,000 (after confirmation)
🔹 Target 1: 41,225
🔹 Target 2: 40,630
🔹 Final Target: 39,585
🔹 Stop Loss: Above 43,800
Conclusion:
⚠️ The chart indicates a high-probability short setup unless bulls manage a strong breakout above resistance. Eyes on the price action near resistance for confirmation. 📉📊
US30 Is Going Down! Short!
Please, check our technical outlook for US30.
Time Frame: 9h
Current Trend: Bearish
Sentiment: Overbought (based on 7-period RSI)
Forecast: Bearish
The price is testing a key resistance 42,213.7.
Taking into consideration the current market trend & overbought RSI, chances will be high to see a bearish movement to the downside at least to 41,560.7 level.
P.S
The term oversold refers to a condition where an asset has traded lower in price and has the potential for a price bounce.
Overbought refers to market scenarios where the instrument is traded considerably higher than its fair value. Overvaluation is caused by market sentiments when there is positive news.
Disclosure: I am part of Trade Nation's Influencer program and receive a monthly fee for using their TradingView charts in my analysis.
Like and subscribe and comment my ideas if you enjoy them!

US30: Will Go Down! Short!
My dear friends,
Today we will analyse US30 together☺️
The in-trend continuation seems likely as the current long-term trend appears to be strong, and price is holding below a key level of 42,126.0 So a bearish continuation seems plausible, targeting the next low. We should enter on confirmation, and place a stop-loss beyond the recent swing level.
❤️Sending you lots of Love and Hugs❤️

GOLD - WAVE 4 CORRECTION TO $2,800 (UPDATE)Gold has once again rejected the 0.618 Fib level & dropped back into the lower bound of the range zone overnight, which is what we like to see.
But overall, we remain within the range so we exercise patience & keep an eye out for any possible alternatives which might happen for Gold. Nice profits for us either way.

DowJones INTRADAY Key trading zone retestKey Support and Resistance Levels
Resistance Level 1: 42,920
Resistance Level 2: 43,300
Resistance Level 3: 43,620
Support Level 1: 41,470
Support Level 2: 41,160
Support Level 3: 40,890
This communication is for informational purposes only and should not be viewed as any form of recommendation as to a particular course of action or as investment advice. It is not intended as an offer or solicitation for the purchase or sale of any financial instrument or as an official confirmation of any transaction. Opinions, estimates and assumptions expressed herein are made as of the date of this communication and are subject to change without notice. This communication has been prepared based upon information, including market prices, data and other information, believed to be reliable; however, Trade Nation does not warrant its completeness or accuracy. All market prices and market data contained in or attached to this communication are indicative and subject to change without notice.
