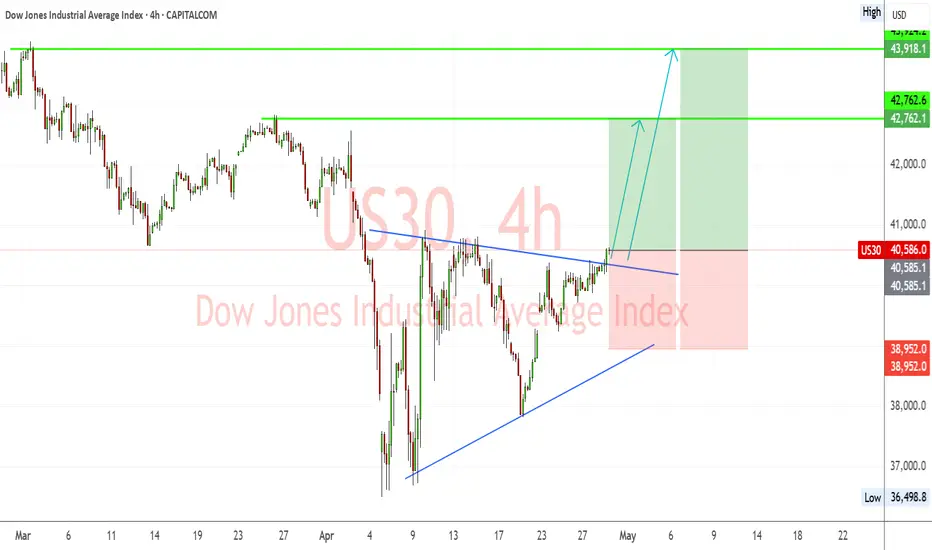
US30 Breakout from Symmetrical Triangle – Bullish Targets EyedUS30 (Dow Jones) has successfully broken out of a symmetrical triangle consolidation pattern, signaling a shift toward bullish momentum. The breakout is occurring after a strong recovery from April lows, with higher lows supporting upward price pressure.
🔹 Chart Structure:
Symmetrical triangle with a clean breakout above descending resistance.
Series of higher lows indicating accumulation.
Bullish breakout confirmed with price pushing above the 40,580 zone.
🔑 Key Levels:
Current Price: 40,586
Breakout Confirmation Level: 40,580
Immediate Resistance/TP1: 42,762
Major Resistance/TP2: 43,924
Support Zone: 38,950
Invalidation/Stop Level: Below 38,950
✅ Bullish Confluence Factors:
Breakout of symmetrical triangle pattern
Higher lows indicate bullish strength and accumulation
Momentum shift visible on lower timeframes
Positive correlation with improving US equity market sentiment
Anticipation of dovish Fed tone could boost equities
🧠 Fundamental Context:
Market is cautiously optimistic ahead of FOMC this week; dovish stance expected due to recent soft economic indicators.
Earnings season tailwinds and lower bond yields support index gains.
Ongoing political and tariff-related headlines may cause volatility, but technical breakout remains in focus.
💡 Trade Idea:
Bias: Bullish
Entry: On successful retest of 40,580 or continuation above 40,600
TP1: 42,762
TP2: 43,924
Stop Loss: Below 38,950
📌 Note: Watch for pullbacks to triangle resistance-turned-support. FOMC and US macro data releases midweek can impact momentum.
D-US30
DOW JONES History shows that we're now targeting 68000.Dow Jones (DJI) recovered its 1W MA50 (blue trend-line), sending a clear technical message that the 'Trade War' correction is over and the long-term bullish trend has been resumed.
The bottom of that correction was on the 1W MA200 (orange trend-line), which has been the absolute long-term Support trend-line for the index, having broken by a large extent only during the March 2020 COVID crash.
That was also a bottom for Dow's Bullish Megaphone pattern. The last time that the index handed a 1W MA200 bottom while trading within a Bullish Megaphone was on February 08 2016. On both bottoms, the 1W RSI hit the 30.00 oversold barrier.
In 2016 that bottom rebound initiated a (blue) Channel Up that lasted for almost 2 years and peaked on the 3.0 Fibonacci extension level. If Dow continues to replicate that pattern, we are looking at a 68000 Target (Fib 3.0 ext) by mid-2027.
-------------------------------------------------------------------------------
** Please LIKE 👍, FOLLOW ✅, SHARE 🙌 and COMMENT ✍ if you enjoy this idea! Also share your ideas and charts in the comments section below! This is best way to keep it relevant, support us, keep the content here free and allow the idea to reach as many people as possible. **
-------------------------------------------------------------------------------
💸💸💸💸💸💸
👇 👇 👇 👇 👇 👇

US30 ShortOverall, the Dow Jones (US30) is bullish.
But has we all know, all the gaps are always filled. I'm shorting until the gap is filled and then the market might continue it's movement to the upside.

DowJones INTRADAY key trading level at 41790US stocks point to slightly lower open as traders react to global and economic developments.
Main drivers:
Trump’s Gulf Visit: Markets are watching for any new investment deals or geopolitical tensions. A $600B Saudi investment deal was announced yesterday, and Trump is now heading to Qatar.
Tariff Optimism: Hopes of US-China tariff easing have supported recent rallies and reduced fears of a slowdown.
Rate Cut Expectations Lower: Stronger sentiment has reduced chances of near-term rate cuts by the Fed, ECB, and BoE. This may limit upside for some rate-sensitive stocks.
ECB Outlook: ECB’s Villeroy said a rate cut is likely this summer, keeping some dovish tone in Europe.
US CPI Impact: Markets are still digesting yesterday’s inflation data, which could affect future Fed moves.
Trading Takeaway:
Momentum is supported by global optimism, but fading rate cut hopes and geopolitical risks may keep gains in check. Stay alert for headlines out of the Gulf.
Key Support and Resistance Levels
Resistance Level 1: 42550
Resistance Level 2: 42910
Resistance Level 3: 43370
Support Level 1: 41790
Support Level 2: 41470
Support Level 3: 41220
This communication is for informational purposes only and should not be viewed as any form of recommendation as to a particular course of action or as investment advice. It is not intended as an offer or solicitation for the purchase or sale of any financial instrument or as an official confirmation of any transaction. Opinions, estimates and assumptions expressed herein are made as of the date of this communication and are subject to change without notice. This communication has been prepared based upon information, including market prices, data and other information, believed to be reliable; however, Trade Nation does not warrant its completeness or accuracy. All market prices and market data contained in or attached to this communication are indicative and subject to change without notice.

Trade Idea: US30 Long (BUY LIMIT)Justification:
Technical Analysis:
1. Daily Chart:
• Strong bullish reversal from recent lows.
• MACD is crossing up sharply, showing fresh bullish momentum.
• RSI at 62.33 — rising but not yet overbought (room to run).
• Price reclaiming key moving averages.
2. 15-Minute Chart:
• Clear uptrend continuation.
• MACD and RSI confirm bullish momentum.
• Price consolidating at recent highs — potential breakout formation.
3. 3-Minute Chart:
• Short-term consolidation near highs with low RSI (38.84) — possible dip-buy opportunity.
• MACD near zero — primed for a new short-term wave.
Fundamental Analysis (as of early May 2025 context):
• Likely market optimism surrounding softer inflation data and potential rate cuts.
• Dow components (industrials, financials) benefit from economic soft-landing expectations.
• VIX (if tracked) remains subdued, confirming risk-on sentiment.
⸻
Trade Plan (Long):
• Entry: 42,360
Near current consolidation zone on lower timeframes.
• Stop Loss (SL): 41,850
Below recent swing lows and key moving average support (approx. 510 pts risk).
• Take Profit (TP): 43,380
Targeting previous resistance area on the Daily chart (approx. 1020 pts reward).
FUSIONMARKETS:US30

US30 AFTERNOON SESSION MAY 13Damn!! Why price acting up for? Lol let's handle it.
Price, after a very heavy push up seems as if its starting to fall off bit. Its making a head & shoulders pattern and its starting to sell. When price breaks and retests the neckline I'm going to get in for the sell and sell it down to 41970. Trade responsibly and have fun.
US30: Next Move Is Down! Short!
My dear friends,
Today we will analyse US30 together☺️
The price is near a wide key level
and the pair is approaching a significant decision level of 42,240.1 Therefore, a strong bearish reaction here could determine the next move down.We will watch for a confirmation candle, and then target the next key level of 42,166.6.Recommend Stop-loss is beyond the current level.
❤️Sending you lots of Love and Hugs❤️

Potential bearish drop?Dow Jones (US30) is reacting off the pivot and could drop to the 1st support that aligns with the 61.8% Fibonacci retracement.
Pivot: 42,479.50
1st Support: 41,294.20
1st Resistance: 43,190.10
Risk Warning:
Trading Forex and CFDs carries a high level of risk to your capital and you should only trade with money you can afford to lose. Trading Forex and CFDs may not be suitable for all investors, so please ensure that you fully understand the risks involved and seek independent advice if necessary.
Disclaimer:
The above opinions given constitute general market commentary, and do not constitute the opinion or advice of IC Markets or any form of personal or investment advice.
Any opinions, news, research, analyses, prices, other information, or links to third-party sites contained on this website are provided on an "as-is" basis, are intended only to be informative, is not an advice nor a recommendation, nor research, or a record of our trading prices, or an offer of, or solicitation for a transaction in any financial instrument and thus should not be treated as such. The information provided does not involve any specific investment objectives, financial situation and needs of any specific person who may receive it. Please be aware, that past performance is not a reliable indicator of future performance and/or results. Past Performance or Forward-looking scenarios based upon the reasonable beliefs of the third-party provider are not a guarantee of future performance. Actual results may differ materially from those anticipated in forward-looking or past performance statements. IC Markets makes no representation or warranty and assumes no liability as to the accuracy or completeness of the information provided, nor any loss arising from any investment based on a recommendation, forecast or any information supplied by any third-party.

US30 Approaching Key Resistance Within Rising Channel:🧠 Chart Context & Overview
Chart Type: Candlestick
Time Frame: Appears to be Daily (based on price action and spacing of dates)
Current Price: ~$40,798.4
Indicators:
EMA 50 (Red): ~40,065.2
EMA 200 (Blue): ~41,475.6
Trend Structure: Ascending channel with higher highs and higher lows forming since early April.
🔍 Technical Breakdown
📈 Trend Analysis
The price is moving within a rising parallel channel, respecting both upper and lower boundaries.
The recent bullish candles indicate momentum building towards a breakout or test of resistance.
🔄 EMA Confluence
Price is above the 50 EMA, showing short-term bullish momentum.
EMA 200 is acting as overhead resistance (~41,475), aligned with the top of the channel—a key decision zone.
📊 Support & Resistance Levels
Immediate Resistance: ~41,475 (EMA 200 & upper channel boundary).
Support Levels:
~40,065 (EMA 50)
~39,000 (mid-channel support zone)
~38,000 (lower channel boundary)
📌 Scenarios to Watch
✅ Bullish Case:
A clean breakout above the channel and the 200 EMA (~41,475) with strong volume could trigger a trend continuation toward:
42,500 – next psychological and historical resistance
Potentially higher if macro sentiment aligns
⚠️ Bearish Case:
Rejection at 200 EMA or the upper channel could lead to:
A pullback to the mid-channel zone (~39,800–40,000)
Further downside to retest the lower channel support (~38,000)
📅 Outlook
The chart currently supports a bullish bias within an uptrend structure, but the key resistance zone (41,475) must be broken decisively for confirmation. Watch for volume and candle structure near that level to assess breakout validity.

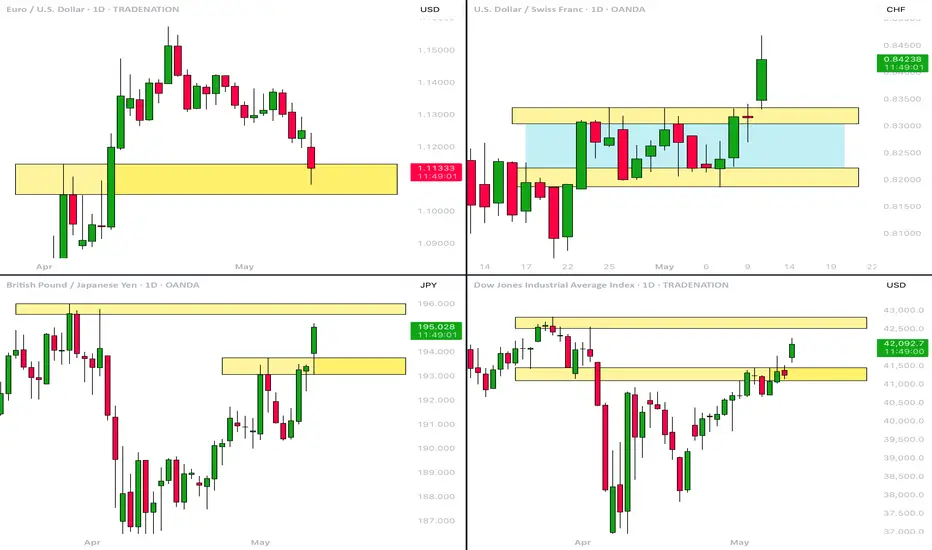
MarketBreakdown | EURUSD, USDCHF, GBPJPY, US30
Here are the updates & outlook for multiple instruments in my watch list.
1️⃣ #EURUSD daily time frame 🇪🇺🇺🇸
As I predicted, EURUSD dropped after the market opening.
The price is currently testing a significant daily demand zone.
Because the market looks relatively oversold after a selloff,
I think that there will be a high chance to see a pullback.
2️⃣ #USDCHF daily time frame 🇺🇸🇨🇭
The price completed a consolidation and a bullish accumulation
within a horizontal range on a daily.
Its resistance breakout is an important bullish signal.
Probabilities are high that the market will continue rising after a pullback.
3️⃣ #GBPJPY daily time frame 🇬🇧🇯🇵
The pair broke above a significant daily resistance cluster.
It opens a potential for more rise.
The market will most likely reach the underlined yellow resistance soon.
4️⃣ #US30 Index Dow Jones daily time frame 🇦🇺🇺🇸
The index successfully violated a major daily resistance.
Rise will continue and the market will reach the underlined
liquidity zone soon.
Do you agree with my market breakdown?
❤️Please, support my work with like, thank you!❤️
I am part of Trade Nation's Influencer program and receive a monthly fee for using their TradingView charts in my analysis.
GOLD - WAVE 4 CORRECTION TO $2,800 (UPDATE)Gold has started the week extremely bearish, by gapping down & taking out last week’s low.
Running 1,500 PIPS in profit, from rejecting our 0.365% supply zone, which I highlighted for you all last week on my analysis.

Trade Idea: US30 Short ( SELL STOP )Technical Analysis Overview:
1. Daily Chart:
• Price has retraced sharply into resistance (near 41,300–41,400), rejecting the 200-day EMA zone.
• MACD still negative but turning up—suggests potential for a failed bounce.
• RSI at 55.33—approaching overbought in a corrective move, ripe for reversal.
2. 15-Min Chart:
• Bearish divergence forming on RSI with lower highs.
• MACD is turning down with momentum fading after a recent high around 41,665.
• Price has broken short-term moving average support, with momentum shifting down.
3. 3-Min Chart:
• Clear bearish structure with lower highs and lower lows.
• MACD and RSI confirm short-term weakness.
• Price hovering near local support (around 41,302), if broken, would confirm further downside.
⸻
Fundamental Context (Macro):
• FOMC & NFP results (recent) suggest continued uncertainty in interest rate direction.
• US manufacturing and employment data have shown mixed signals—equities vulnerable to downside corrections amid macro volatility.
• Seasonally, May is often a pullback month (“Sell in May”).
⸻
TRADE IDEA – SHORT US30
• Entry: 41,295 (current price at resistance zone)
• Stop-Loss (SL): 41,670 (above recent intraday high and 15-min resistance)
• Take-Profit (TP): 40,500 (prior support zone on 15-min chart)
FUSIONMARKETS:US30

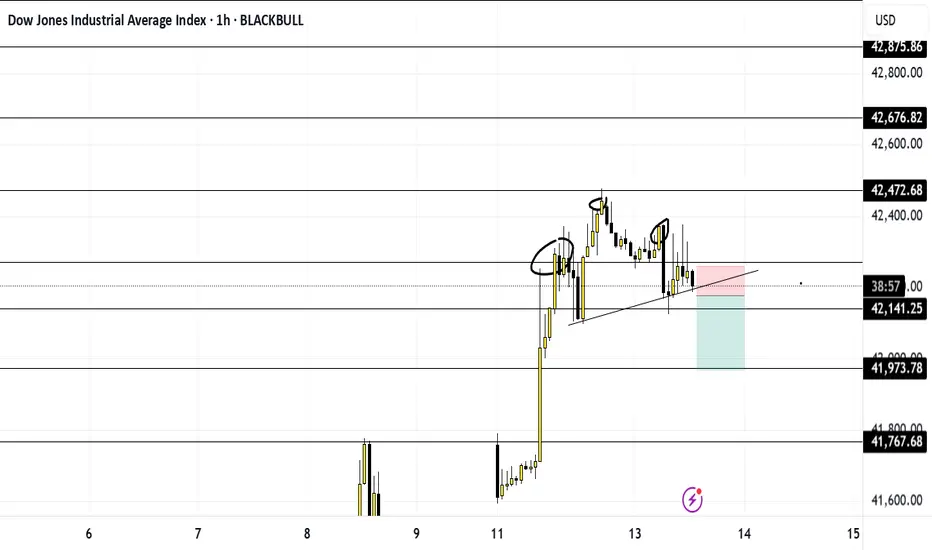
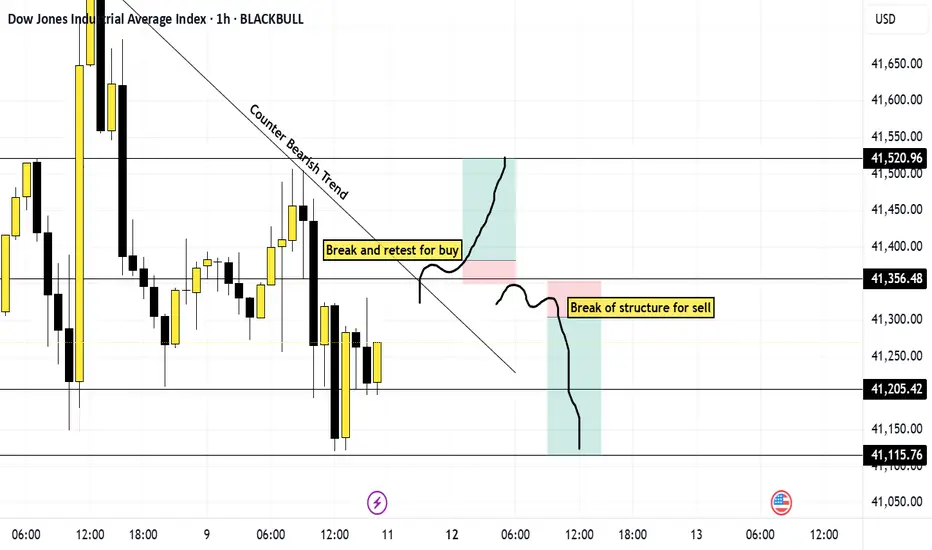
US30 Breakdown May 11thWhy don't skeletons fight each other? Cuz they ain't got guts, like you if you keep making excuses. Ok let's get to work.
Price has been steadily moving upwards this past month. Right now, there seems to be a counter bearish trend, so I plan to react to the market when it gets to my key level 41,353. If price breaks and retests that level on the 1 minute, and for extra confirmation the counter trendline, I will buy it to 41,500.
If price gets to that 41,353 level and decides to break structure and trend down, then I will sell it to 41,100 level.
But like my ex, price does whatever it wants, and it could buy earlier or sell earlier then I've predicted. So, when price gets around one of my key areas (any of the horizontal lines) and decides to start making higher highs and higher lows or breaks and retest it then I'll buy. And If price decides to start making lower highs and lower lows at my key area then I'll sell it.
Have Fun with trading. Keep smiling and I promise if you look at it with positivity you will always win
NZDUSD - Elliott Wave Setup: Eyes on the Buy Zone!NZDUSD - 3D Chart Elliott Wave Outlook
We've been tracking NZDUSD over the years and each move continues to align with Elliott Wave Theory.
The current structure is unfolding as a large ABC corrective pattern.
- Wave A and the complex Wave B (WXY) are now complete.
- We're now in Wave C, and we expect it to target the highs of Wave A.
Recently, NZDUSD made a clear bullish impulse but has been consolidating for the past 3 weeks. This correction is likely to resolve with a bullish breakout.
We've marked a buy zone between the 38.2% and 50% Fibonacci retracement levels, which we believe is the ideal entry area. We'll be watching this zone closely for lower timeframe bullish confirmations like a break of structure (BOS) or trendline break.
Trade Plan:
- Wait for price to enter the buy zone
- Look for bullish confirmations (BOS, trendline break)
- Enter after confirmation, with stops below the corrective lows
- Targets: 0.63 (500 pips), 0.65 (700 pips)
Goodluck and as always, Trade Safe!

DowJones INTRADAY important resistance retest Key Support and Resistance Levels
Resistance Level 1: 41,900
Resistance Level 2: 42,470
Resistance Level 3: 43,600
Support Level 1: 40,680
Support Level 2: 40,240
Support Level 3: 39,700
This communication is for informational purposes only and should not be viewed as any form of recommendation as to a particular course of action or as investment advice. It is not intended as an offer or solicitation for the purchase or sale of any financial instrument or as an official confirmation of any transaction. Opinions, estimates and assumptions expressed herein are made as of the date of this communication and are subject to change without notice. This communication has been prepared based upon information, including market prices, data and other information, believed to be reliable; however, Trade Nation does not warrant its completeness or accuracy. All market prices and market data contained in or attached to this communication are indicative and subject to change without notice.


DowJones INTRADAY resistance retestKey Support and Resistance Levels
Resistance Level 1: 41,900
Resistance Level 2: 42,470
Resistance Level 3: 43,600
Support Level 1: 40,680
Support Level 2: 40,240
Support Level 3: 39,700
This communication is for informational purposes only and should not be viewed as any form of recommendation as to a particular course of action or as investment advice. It is not intended as an offer or solicitation for the purchase or sale of any financial instrument or as an official confirmation of any transaction. Opinions, estimates and assumptions expressed herein are made as of the date of this communication and are subject to change without notice. This communication has been prepared based upon information, including market prices, data and other information, believed to be reliable; however, Trade Nation does not warrant its completeness or accuracy. All market prices and market data contained in or attached to this communication are indicative and subject to change without notice.

Bullish continuation?Dow Jones (US30) has bounced off the pivot and could rise to the 1st resistance which lines up with the 145% Fibonacci extension.
Pivot: 40,653.80
1st Support: 39,774.46
1st Resistance: 42,181.26
Risk Warning:
Trading Forex and CFDs carries a high level of risk to your capital and you should only trade with money you can afford to lose. Trading Forex and CFDs may not be suitable for all investors, so please ensure that you fully understand the risks involved and seek independent advice if necessary.
Disclaimer:
The above opinions given constitute general market commentary, and do not constitute the opinion or advice of IC Markets or any form of personal or investment advice.
Any opinions, news, research, analyses, prices, other information, or links to third-party sites contained on this website are provided on an "as-is" basis, are intended only to be informative, is not an advice nor a recommendation, nor research, or a record of our trading prices, or an offer of, or solicitation for a transaction in any financial instrument and thus should not be treated as such. The information provided does not involve any specific investment objectives, financial situation and needs of any specific person who may receive it. Please be aware, that past performance is not a reliable indicator of future performance and/or results. Past Performance or Forward-looking scenarios based upon the reasonable beliefs of the third-party provider are not a guarantee of future performance. Actual results may differ materially from those anticipated in forward-looking or past performance statements. IC Markets makes no representation or warranty and assumes no liability as to the accuracy or completeness of the information provided, nor any loss arising from any investment based on a recommendation, forecast or any information supplied by any third-party.

Trade Idea: US30 Long (BUY LIMIT)Technical Overview
Daily Chart (Macro View):
• Trend: Recent bounce from major support near ~37,600 after a sharp selloff.
• MACD: Still bearish but showing early signs of momentum reversal (histogram rising).
• RSI: Neutral (~53.8), coming up from oversold territory—indicative of potential recovery.
• Price: Holding above 41,000, a key psychological level and previous consolidation zone.
15-Minute Chart (Swing/Short-Term View):
• Price: Forming higher lows after a significant bounce.
• MACD: Nearing a bullish crossover.
• RSI: Moderately bullish at ~56.87.
3-Minute Chart (Entry Precision):
• Price: Recently broke above short-term moving average.
• MACD: Bullish with strong histogram momentum.
• RSI: Slightly overbought (~52.90), but not extreme.
⸻
Fundamental Context (as of May 2025):
• Market sentiment is cautiously bullish after Fed pause hints and solid tech earnings.
• Inflation pressures are easing slightly, supporting risk-on sentiment.
• Recent volatility due to rate expectations and macro data; however, markets are recovering from sharp selloffs.
⸻
Bias: Long Position
US30 shows a strong recovery setup with macro support, bullish lower-timeframe confirmation, and neutral-to-bullish momentum indicators.
Entry (Buy Limit):
40,960 – small retracement near the short-term EMA and previous breakout on the 3-min chart.
Stop Loss (SL):
40,700 – below the recent swing low and psychological round level.
Take Profit (TP):
41,560 – retest of minor resistance from earlier consolidation area, offering a solid risk-reward.
FUSIONMARKETS:US30

GOLD - WAVE 4 CORRECTION TO $2,800 (UPDATE)Gold climbed higher, but very swiftly rejected our 0.365% zone, melting back down 740 PIPS. Should see a continuation to the downside.
But as I said yesterday, if we see a breach of $3,465 then we'll create an alternate analysis which'll show Gold leading towards a new ATH, creating a 'redistribution phase' at higher prices.

DowJones INTRADAY awaits Fed Rate Decision Key Support and Resistance Levels
Resistance Level 1: 41,450
Resistance Level 2: 41,900
Resistance Level 3: 42,470
Support Level 1: 40,220
Support Level 2: 39,760
Support Level 3: 39,150
This communication is for informational purposes only and should not be viewed as any form of recommendation as to a particular course of action or as investment advice. It is not intended as an offer or solicitation for the purchase or sale of any financial instrument or as an official confirmation of any transaction. Opinions, estimates and assumptions expressed herein are made as of the date of this communication and are subject to change without notice. This communication has been prepared based upon information, including market prices, data and other information, believed to be reliable; however, Trade Nation does not warrant its completeness or accuracy. All market prices and market data contained in or attached to this communication are indicative and subject to change without notice.

DOW JONES Can this Channel Up hold after the Fed Rate Decision?Dow Jones (DJIA) has been trading within a Channel Up since the April 24 Low and yesterday's correction (technically its Bearish Leg) stopped on the 4H MA50 (blue trend-line). Having formed already a Golden Cross, as long as this 4H MA50 holds, it should technically fuel the pattern's new Bullish Leg.
The 'weakest' Bullish Leg within this Channel Up has been +3.58%, so we expect a minimum repeat of that, giving a Target at 42100 on the short-term. This falls perfectly at the bottom of the 5 week Resistance Zone.
If this Channel Up doesn't get invalidated after today's Fed Rate Decision, it will most likely push the price there.
-------------------------------------------------------------------------------
** Please LIKE 👍, FOLLOW ✅, SHARE 🙌 and COMMENT ✍ if you enjoy this idea! Also share your ideas and charts in the comments section below! This is best way to keep it relevant, support us, keep the content here free and allow the idea to reach as many people as possible. **
-------------------------------------------------------------------------------
💸💸💸💸💸💸
👇 👇 👇 👇 👇 👇

Hanzo : US30 15m : Breakouts Zones / Next Move is Confirmed 🆚 US30 – Hanzo’s Strike Setup
🔥 Timeframe: 15-Minute (15M)
——————
💯 Main Focus: Bullish After Break at 41150
We are watching this zone closely.
💯 Main Focus: Bearish After Break at 40950
We are watching this zone closely.
———
👌 Market Signs (15M TF):
• Liquidity Grab + CHoCH at 41300
• Liquidity Grab + CHoCH at 40990
• Strong Rejections seen at:
➗ 40950 – Major support / Key level x3 Retest
➗ 40690 – Major support / Key level x5 Retest
➗ 41150 – Proven resistance
Hanzo : NAS100 15m: Best Breakout Zones Confirmed After Liquidity Trap
