Golden Opportunities: Navigating the New Era of InvestmentFolks, we're witnessing something truly remarkable with XAUUSD. Gold's weekly uptrend is not just a blip on the radar; it's a beacon signaling a return to the fundamentals I've been harping on for ages. Recall my earlier insights? I pegged the long-term trend in Gold, and here we are, watching it soar. Trump's chatter about inflation and rates? It's like watching a chess game where each move by the Fed could be influenced by such rhetoric. The market, my friends, seems to be betting on this narrative, pricing in these potential shifts.
Now, let's not forget the basics. Historically, precious metals dance to the tune of real interest rates - those inflation-adjusted numbers. Sure, during times of market panic or geopolitical tension, Gold might get caught in the crossfire as either a collateral darling or a safe haven. But in these calmer waters, it's the real rates that dictate the dance. So, keep your eyes on the prize. Gold isn't just shining; it's setting the stage for what might be a golden era in investment. Watch, learn, and maybe, just maybe, enjoy the ride as we navigate these waters together. Stay vigilant, and may your investments be as golden as your opportunities.
Horban Brothers,
Alex Kostenich
D-XAU

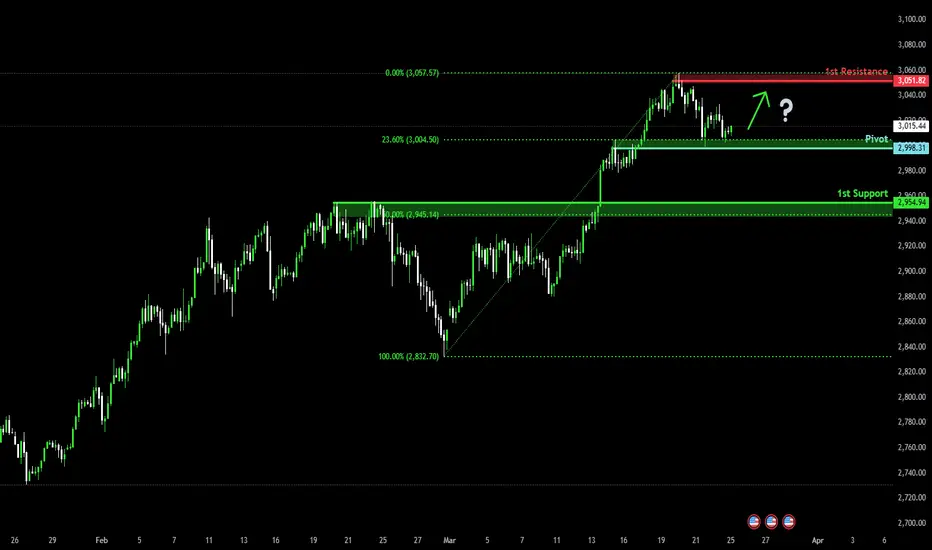
XAU/USD: Bullish Momentum Holds with Breakout PotentialXAU/USD closed its third straight bullish week, with price testing Tuesday’s low before rebounding and closing near the 50% mark of the weekly range. Despite a brief dip, the candle closed above last week’s high, showing continued strength. A breakout above the 3,000 level raises the potential for further gains, especially if the market opens with a gap up.
On the daily timeframe, Friday's candle recovered after early weakness, resembling a previous pullback seen earlier this month. With a 1.90% retracement, the structure suggests possible upward continuation. The market is currently moving sideways within Friday’s range, hovering around the 3,030 key level.
While high-impact news could cause volatility, any pullback toward the 3,000 support zone—aligned with the trendline and previous week’s high—may offer buying opportunities. A breakout from the inside bar pattern forming on the daily chart could target the 3075 resistance zone

Bullish momentum to extend?The Gold (XAU/USD) has reacted off the pivot which acts as a pullback support and could rise to the 1st resistance which has been identified as a pullback resistance.
Pivot: 2,998.31
1st Support: 2,954.94
1st Resistance: 3,051.82
Risk Warning:
Trading Forex and CFDs carries a high level of risk to your capital and you should only trade with money you can afford to lose. Trading Forex and CFDs may not be suitable for all investors, so please ensure that you fully understand the risks involved and seek independent advice if necessary.
Disclaimer:
The above opinions given constitute general market commentary, and do not constitute the opinion or advice of IC Markets or any form of personal or investment advice.
Any opinions, news, research, analyses, prices, other information, or links to third-party sites contained on this website are provided on an "as-is" basis, are intended only to be informative, is not an advice nor a recommendation, nor research, or a record of our trading prices, or an offer of, or solicitation for a transaction in any financial instrument and thus should not be treated as such. The information provided does not involve any specific investment objectives, financial situation and needs of any specific person who may receive it. Please be aware, that past performance is not a reliable indicator of future performance and/or results. Past Performance or Forward-looking scenarios based upon the reasonable beliefs of the third-party provider are not a guarantee of future performance. Actual results may differ materially from those anticipated in forward-looking or past performance statements. IC Markets makes no representation or warranty and assumes no liability as to the accuracy or completeness of the information provided, nor any loss arising from any investment based on a recommendation, forecast or any information supplied by any third-party.
GOLD LONG SIGNAL|
✅GOLD made a retest of the
Horizontal support of 3000$
And we are seeing a bullish
Reaction so we are bullish
Biased and we can enter
A long trade with the TP
Of 3023$ and the SL of 2997$
LONG🚀
✅Like and subscribe to never miss a new idea!✅
Disclosure: I am part of Trade Nation's Influencer program and receive a monthly fee for using their TradingView charts in my analysis.

Bullish bounce off pullback support?XAU/USD is falling towards the support level which is a pullback support that line sup with the 78.6% Fibonacci projection and could bounce from this level to our take profit.
Entry: 2,983.48
Why we like it:
There is a pullback support level that lines up with the 78.6% Fibonacci retracement.
Stop loss: 2,952.61
Why we like it:
There is a pullback support level that lines up with the 61.8% Fibonacci retracement.
Take profit: 3,028.95
Why we like it:
There is an overlap resistance level.
Enjoying your TradingView experience? Review us!
Please be advised that the information presented on TradingView is provided to Vantage (‘Vantage Global Limited’, ‘we’) by a third-party provider (‘Everest Fortune Group’). Please be reminded that you are solely responsible for the trading decisions on your account. There is a very high degree of risk involved in trading. Any information and/or content is intended entirely for research, educational and informational purposes only and does not constitute investment or consultation advice or investment strategy. The information is not tailored to the investment needs of any specific person and therefore does not involve a consideration of any of the investment objectives, financial situation or needs of any viewer that may receive it. Kindly also note that past performance is not a reliable indicator of future results. Actual results may differ materially from those anticipated in forward-looking or past performance statements. We assume no liability as to the accuracy or completeness of any of the information and/or content provided herein and the Company cannot be held responsible for any omission, mistake nor for any loss or damage including without limitation to any loss of profit which may arise from reliance on any information supplied by Everest Fortune Group.

xauusdtSupport and press the rocket to cheer me up
Observe the ten percent loss limit
Stay away from Bitcoins
Feel free to buy and sell and post your comments

GOLD will have a long vacation from ascending - and opt for RED.GOLD, has been the most resilient and rosy asset for the entire 2024 till q1 of this year.
It keeps breaking ATH on a regular weekly basis like its nothing -- reaching a parabolic high of an impressive 3057.
Trend is currently shifting based on the current metrics which has started this friday, March 21, 2024.
A reversal to the downside is in order from this peak range. Targeting below 3k levels again.
It's doing a transition to new track pattern where it creates a healthy pull back to create another curve up trend for continuation to the upside. A 38.2 / 0.50 level of retracement.
Last time it did this pattern was on October 2024.
This transitional period is healthy for sustainable price growth.
This red days will linger for a bit till it gets lighter -- but we may see a trim down of thousands of pips before we get to the most attractive bargain levels.
For the mean time, shorts will have the best season for now.
As for bulls -- stay in cash until it shifts again -- but more waiting is needed.
Spotted at 3057.
Target below 3000.
Overextended target below 2900.
Again these are all guidance. Be guided.
It can be invalidated anytime.
Trade safely always. TAYOR.

Bullish continuation?The Gold (XAU/USD is falling towards the pivot and could bounce to the 1st resistance which has been identified as a pullback resistance.
Pivot: 2,951.07
1st Support: 2,886.31
1st Resistance: 3,049.36
Risk Warning:
Trading Forex and CFDs carries a high level of risk to your capital and you should only trade with money you can afford to lose. Trading Forex and CFDs may not be suitable for all investors, so please ensure that you fully understand the risks involved and seek independent advice if necessary.
Disclaimer:
The above opinions given constitute general market commentary, and do not constitute the opinion or advice of IC Markets or any form of personal or investment advice.
Any opinions, news, research, analyses, prices, other information, or links to third-party sites contained on this website are provided on an "as-is" basis, are intended only to be informative, is not an advice nor a recommendation, nor research, or a record of our trading prices, or an offer of, or solicitation for a transaction in any financial instrument and thus should not be treated as such. The information provided does not involve any specific investment objectives, financial situation and needs of any specific person who may receive it. Please be aware, that past performance is not a reliable indicator of future performance and/or results. Past Performance or Forward-looking scenarios based upon the reasonable beliefs of the third-party provider are not a guarantee of future performance. Actual results may differ materially from those anticipated in forward-looking or past performance statements. IC Markets makes no representation or warranty and assumes no liability as to the accuracy or completeness of the information provided, nor any loss arising from any investment based on a recommendation, forecast or any information supplied by any third-party.

GOLD Risky Short! Sell!
Hello,Traders!
GOLD made a rebound
From the support and went
Up but will now retest a
Local horizontal level
Of 3030$ from where
We will be expecting
A local bearish reaction
Sell!
Comment and subscribe to help us grow!
Check out other forecasts below too!
Disclosure: I am part of Trade Nation's Influencer program and receive a monthly fee for using their TradingView charts in my analysis.

Could the Gold reverse from here?XAU/USD is rising towards the resistance level which is a pullback resistance that aligns with the 61.8% Fibonacci retracement and could reverse from this level to our take profit.
Entry: 3,032.98
Why we like it:
There is a pullback resistance level that aligns with the 61.8% Fibonacci retracement.
Stop loss: 3,056.27
Why we like it:
There is a swing high resistance level.
Take profit: 3,005.17
Why we like it:
There is an overlap support level.
Enjoying your TradingView experience? Review us!
Please be advised that the information presented on TradingView is provided to Vantage (‘Vantage Global Limited’, ‘we’) by a third-party provider (‘Everest Fortune Group’). Please be reminded that you are solely responsible for the trading decisions on your account. There is a very high degree of risk involved in trading. Any information and/or content is intended entirely for research, educational and informational purposes only and does not constitute investment or consultation advice or investment strategy. The information is not tailored to the investment needs of any specific person and therefore does not involve a consideration of any of the investment objectives, financial situation or needs of any viewer that may receive it. Kindly also note that past performance is not a reliable indicator of future results. Actual results may differ materially from those anticipated in forward-looking or past performance statements. We assume no liability as to the accuracy or completeness of any of the information and/or content provided herein and the Company cannot be held responsible for any omission, mistake nor for any loss or damage including without limitation to any loss of profit which may arise from reliance on any information supplied by Everest Fortune Group.

GOLD LOCAL BULLISH BIAS|LONG|
✅GOLD is set to retest a
Strong key support level below at 3000$
After trading in a local downtrend from some time
Which makes a bullish rebound a likely scenario
With the target being a local resistance above at 3024$
LONG🚀
✅Like and subscribe to never miss a new idea!✅
Disclosure: I am part of Trade Nation's Influencer program and receive a monthly fee for using their TradingView charts in my analysis.

Could the price drop from here?The Gold (XAU/USD) has reacted off the pivot and could drop to the pullback support.
Pivot: 3,052.78
1st Support: 3,020.46
1st Resistance: 3,059.37
Risk Warning:
Trading Forex and CFDs carries a high level of risk to your capital and you should only trade with money you can afford to lose. Trading Forex and CFDs may not be suitable for all investors, so please ensure that you fully understand the risks involved and seek independent advice if necessary.
Disclaimer:
The above opinions given constitute general market commentary, and do not constitute the opinion or advice of IC Markets or any form of personal or investment advice.
Any opinions, news, research, analyses, prices, other information, or links to third-party sites contained on this website are provided on an "as-is" basis, are intended only to be informative, is not an advice nor a recommendation, nor research, or a record of our trading prices, or an offer of, or solicitation for a transaction in any financial instrument and thus should not be treated as such. The information provided does not involve any specific investment objectives, financial situation and needs of any specific person who may receive it. Please be aware, that past performance is not a reliable indicator of future performance and/or results. Past Performance or Forward-looking scenarios based upon the reasonable beliefs of the third-party provider are not a guarantee of future performance. Actual results may differ materially from those anticipated in forward-looking or past performance statements. IC Markets makes no representation or warranty and assumes no liability as to the accuracy or completeness of the information provided, nor any loss arising from any investment based on a recommendation, forecast or any information supplied by any third-party.

GOLD in coming days...The price, as we expected, grew to the (ab=cd) extent after breaking out of this cup-and-handle pattern, and now, technically speaking, it needs some correction, which depends on the level of tensions.
Give me some energy !!
✨We spend hours finding potential opportunities and writing useful ideas, we would be happy if you support us.
Best regards CobraVanguard.💚
_ _ _ _ __ _ _ _ _ _ _ _ _ _ _ _ _ _ _ _ _ _ _ _ _ _ _ _ _ _ _ _
✅Thank you, and for more ideas, hit ❤️Like❤️ and 🌟Follow🌟!
⚠️Things can change...
The markets are always changing and even with all these signals, the market changes tend to be strong and fast!!

Why gold may—or may not—reach $3,060 next Gold is now up 15.57% in 2025 after gaining 27.2% in 2024.
If the current momentum continues, traders may target the upper parallel trendline near $3,060 and rising.
Safe-haven demand is a key driver of this rally, but what could disrupt it?
For one, U.S. President Donald Trump and Russian President Vladimir Putin spoke for 90 minutes today, agreeing on steps toward a peace deal in Ukraine, including a pause on attacks on energy infrastructure. However, Putin declined to accept a broader 30-day ceasefire proposed by U.S. and Ukrainian officials.

XAUUSD bearish targets It looks like gold has reached a strong supply zone and is now preparing for a retracement
Possible Retracement Levels:
First Target: 3011
Second Target: 3000
Third Target: 2993
Stop loss; 3034

GOLD - Price can correct to support area and then continue growHi guys, this is my overview for XAUUSD, feel free to check it and write your feedback in comments👊
A few moments ago price started to grow inside a rising channel, where it so long rose near support line and reached $2845 level.
Then Gold broke this level, exited from channel and started to trades inside flat, where it at once made retest.
After this movement, Gold started to grow and later grew to top part of flat, which coincided with $2955 level.
Price some time traded near this level and then corrected to support area, after which started to grow.
Gold rose to $2955 level and broke it, thereby exiting from flat too and then it continued to move up next.
Possibly, Gold can fall to the support area, correcting, and then continue to rise to $3040
If this post is useful to you, you can support me with like/boost and advice in comments❤️

HelenP. I Gold will continue to move up in upward channelHi folks today I'm prepared for you Gold analytics. Looking at the chart, we can see that the price entered the channel and began moving higher along the trend line. Soon, it climbed to Support 2, which aligned with the support zone, broke this level, retested it, and then continued its upward movement. Later, Gold reached Support 1, which also coincided with a support zone. Shortly after, it broke this level as well, reaching the resistance line of the channel before making a correction to another support zone. The price traded around this area for some time before making a corrective move below Support 1, even briefly breaking the trend line in a false breakout. However, it quickly resumed its upward movement within the channel. Gold then broke through Support 1 again, retested it, and rebounded from the support zone. Based on the current structure, I expect XAU/USD to make a corrective move toward the trend line before continuing its growth inside the upward channel. Given this scenario, my goal is set at 3070 points. If you like my analytics you may support me with your like/comment ❤️

Gold's Battle for $3,000Gold is currently trading at $2,996 per ounce, sitting in a phase of consolidation after recently touching the big $3,000 level. Over the last few sessions, the price has been bouncing between $2,985 and $3,005, showing that traders aren’t quite sure which way it’ll go next. This comes after an impressive rally where gold broke past $3,000 for the first time ever, fueled by trade tensions and talk of U.S. interest rate cuts making it a go-to safe-haven asset. But since it couldn’t hold above that milestone, the market seems to be taking a breather, waiting for something new, like economic news or global events, to push it one way or the other.
Technical Levels and Indicators
Looking at the 1-hour chart, gold is testing the upper edge of a descending channel, a pattern where the price has been making lower highs since its recent peak. Right now, it’s just below a key resistance at $3,000, which has been tough to crack, while $2,980 acts as a solid support level where buyers have stepped in before. The Relative Strength Index (RSI) is around 55, meaning momentum is neutral, not too hot or too cold. Meanwhile, the Moving Average Convergence Divergence (MACD) is showing a slight bullish signal, hinting that an upward move could be on the cards. Keep an eye out: a strong break above $3,005 could spark more buying, but a dip below $2,980 might mean a pullback is coming.
Market Sentiment and Fundamentals
Traders seem split on gold right now. Some are optimistic, pointing to ongoing global risks and central banks leaning toward looser policies, which could lift prices higher. Others are cautious after gold failed to stay above $3,000, with chatter on platforms suggesting a possible drop to $2,950 or even a bounce around $2,993 where big orders might be sitting. On the fundamental side, gold’s strength as a safe-haven shines when the economy feels shaky or inflation worries heat up. But watch out, a stronger U.S. dollar or hints of rising interest rates could put the brakes on gains. The next big economic report or geopolitical headline could be the trigger that decides gold’s next move.

Head & Shoulders Pattern Forming? 📊 GOLD (XAU/USD) 1H Timeframe Analysis – Head & Shoulders Pattern Forming? 🚀
📉 Gold is forming a possible Head & Shoulders pattern on the 1-hour chart.
🔄 Key Levels & Scenarios:
✅ Bearish Scenario: If the price breaks below the blue support zone, the next targets will be at the green line levels.
✅ Invalidation: If the price moves above the right shoulder, the bearish structure is invalidated, and we could see a bullish continuation.
📌 Watch for a confirmed breakout before taking a position!

Bullish continuation?XAU/USD is falling towards the support level which is a pullback support that is slightly below the 38.2% Fibonacci retracement and could bounce from this level to our take profit.
Entry: 2,952.19
Why we like it:
There rise a pullback support level that aligns with the 38.2% Fibonacci retracement.
Stop loss: 2,925.66
Why we like it:
There is a pullback support level that lines up with the 61.8% Fibonacci retracement.
Take profit: 3,000.05
Why we like it:
There is a pullback resistance level.
Enjoying your TradingView experience? Review us!
Please be advised that the information presented on TradingView is provided to Vantage (‘Vantage Global Limited’, ‘we’) by a third-party provider (‘Everest Fortune Group’). Please be reminded that you are solely responsible for the trading decisions on your account. There is a very high degree of risk involved in trading. Any information and/or content is intended entirely for research, educational and informational purposes only and does not constitute investment or consultation advice or investment strategy. The information is not tailored to the investment needs of any specific person and therefore does not involve a consideration of any of the investment objectives, financial situation or needs of any viewer that may receive it. Kindly also note that past performance is not a reliable indicator of future results. Actual results may differ materially from those anticipated in forward-looking or past performance statements. We assume no liability as to the accuracy or completeness of any of the information and/or content provided herein and the Company cannot be held responsible for any omission, mistake nor for any loss or damage including without limitation to any loss of profit which may arise from reliance on any information supplied by Everest Fortune Group.

XAUUSD GOLD Market Analysis & ForecastCurrent Market Condition
Gold (XAU/USD) is currently in a consolidation phase, trading within a range between $2930 and $2891. At present, the price stands at $2909.50, indicating that the market is indecisive and awaiting a breakout.
On the Daily (D1) timeframe, XAU/USD has broken the previous uptrend, signaling a potential shift in momentum. The current price action suggests that the market is undergoing a retracement phase, and a deeper correction may be expected.
Bearish Scenario: Downside Breakout Expected
The $2930 resistance level has been tested multiple times, with strong rejection, confirming the presence of strong sellers in the market.
If XAU/USD fails to regain strength above $2930, it is likely to break the key support level at $2891 and continue its downward move.
Once $2891 is broken, further downside targets are:
Target 01: $2859
Target 02: $2834
These levels align with historical support zones and Fibonacci retracement levels, further supporting the bearish outlook.
Bullish Scenario: Breakout Above $2930
If XAU/USD gains bullish momentum and breaks above the $2930 level, buyers will take control, and the price may rally further.
The immediate upside targets in this scenario are:
Target 01: $2956
Target 02: $2980
Additionally, market sentiment remains highly bullish in the long term, with expectations that gold could test its all-time high of $3000.
Market Sentiment & Conclusion
The current sentiment in XAU/USD suggests a higher probability of downside movement, as long as the price remains below $2930. However, a breakout above this level will shift the momentum in favor of buyers, targeting new highs. Traders should monitor key levels closely and watch for confirmation before entering trades.
📌 Key Levels to Watch:
🔻 Support: $2891, $2859, $2834
🔺 Resistance: $2930, $2956, $2980, $3000

BTC & GOLD (XAU) CorrelationWith this idea I am not trying to prove anything.
Recently I bumped into the idea about Bitcoin and Precious metals correlation and BTC/GOLD looks interesting.
Topic is open for discussions, what you think ? Do we still have a room for further price surge in terms of Bitcoin ?
Please share your ideas in comments.
Good Luck everyone on this choppy market.

GOLD - Price can turn around and start to fall to $2835 levelHi guys, this is my overview for XAUUSD, feel free to check it and write your feedback in comments👊
Price started to grow inside rising channel, where it soon reached $2690 level, but then made small correction.
After this, Gold broke $2690 level, made retest and then continued to move up inside rising channel.
Later price reached $2835 level, which coincided with support area and soon broke it too, thereby exiting from channel.
Next, Gold started to trades inside a flat, where it at once rose to the top part and some time traded near it.
Then price corrected to support level, after which started to grow and now it trades almost near top part of a flat.
In my mind, Gold can reach the top part of flat and then start to decline to $2835 support level.
If this post is useful to you, you can support me with like/boost and advice in comments❤️
