Follow the trendWon 2 lost 1, So far so good, can't win them all. Important is to have proper risk management.
Find the trend, follow the trend, stay on trend.
D-XAU

Gold surges, just $17 away from $3,000 Gold is sprinting to new all-time highs and approaching the $3000 level. The price has just reached $2983 at the time of writing, just $17 away from the key $3000 level.
Alex Ebkarian from Allegiance Gold forecasts “prices to trade between $3,000 and $3,200 this year,”.
Momentum is currently being driven by uncertainty around Trump tariffs and stalled ceasefire talks with Vladimir Putin, who has outlined sweeping conditions for any potential truce.
The upcoming Federal Reserve meeting next Wednesday could also be influencing prices. While the central bank is expected to keep its rate at 4.25%-4.50% until at least June, with the current economic environment, a change in guidance from the Fed might be warranted. A delay in the anticipated June rate cut wouldn't be helpful for the gold price

GOLD Strong Bullish Breakout! Buy!
Hello,Traders!
GOLD is trading in a strong
Uptrend and the price
Made a bullish breakout
Of the key horizontal level
Of 2949$ and the breakout
Is confirmed so we are
Bullish biased and we will
Be expecting a further move
Up after the potential pullback
Sell!
Comment and subscribe to help us grow!
Check out other forecasts below too!
Disclosure: I am part of Trade Nation's Influencer program and receive a monthly fee for using their TradingView charts in my analysis.

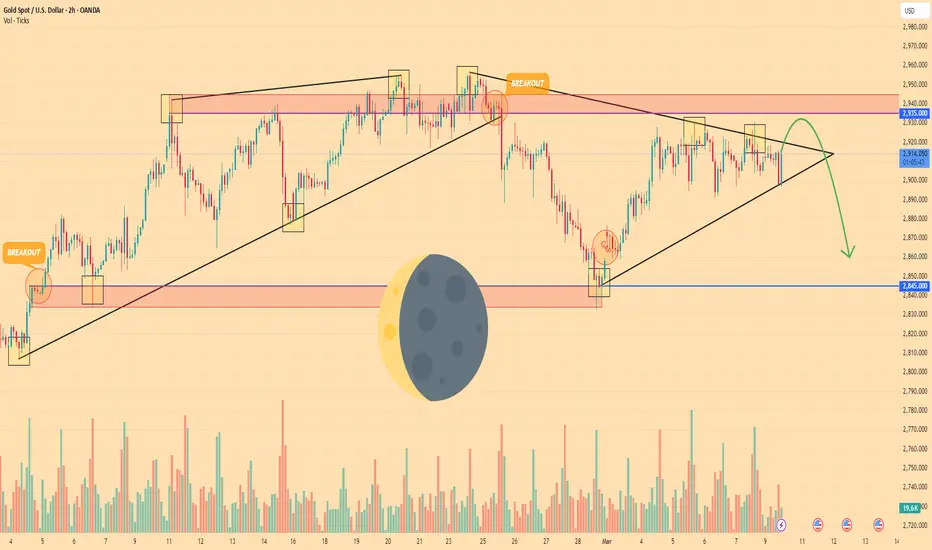
HelenP. I Gold can make small correction and then continue growHi folks today I'm prepared for you Gold analytics. A short while ago, the price was trading near the support zone, which aligned with the support level, before rebounding up to the resistance level. Following this movement, Gold made a correction, quickly reversed, and then repeated the corrective move once again. After that, the price climbed back to the resistance level and entered the resistance zone, where it consolidated for some time before beginning a decline within a triangle pattern. Within this structure, XAU broke below the 2935 level and dropped further to the trend line, also breaking through the 2865 support level. After this move, XAU reversed direction, rebounded from the trend line, and soon reclaimed the 2865 level. The price then nearly reached the resistance line of the triangle before making a correction back to the trend line. It later turned around again, climbed higher, and reached the resistance line. Currently, Gold is trading near this resistance line, and I anticipate a correction toward the trend line before rebounding upward, breaking out of the triangle, and surpassing the resistance level. Given this setup, my target is set at 2950 points. If you like my analytics you may support me with your like/comment ❤️

GOLD RESISTANCE AHEAD|SHORT|
✅GOLD is going up now
But a strong resistance level is ahead at 2956$
Thus I am expecting a pullback
And a move down towards the target at 2938$
SHORT🔥
✅Like and subscribe to never miss a new idea!✅
Disclosure: I am part of Trade Nation's Influencer program and receive a monthly fee for using their TradingView charts in my analysis.

GOLD Bullish Breakout! Buy!
Hello,Traders!
GOLD is going up now
And made a strong bullish
Breakout of the key
Horizontal level of 2923$
So we are bullish
Biased now therefore
We will be expecting a
Further bullish move up
Buy!
Comment and subscribe to help us grow!
Check out other forecasts below too!
Disclosure: I am part of Trade Nation's Influencer program and receive a monthly fee for using their TradingView charts in my analysis.

Rounding Top Formation & Key Support📊 TVC:GOLD (XAU/USD) Market Update – Rounding Top Formation & Key Support Test
📉 Gold is currently forming a rounding top pattern, indicating potential weakness in momentum.
🔄 Current Scenario:
If the price returns to the green support zone, it could act as a strong support level.
Buyers may step in at this zone, leading to a potential bounce and renewed bullish momentum.
📌 Traders should watch for confirmation signals at the green zone to assess whether buyers regain control.

Bearish drop?XAU/USD is rising towards the resistance level which is a pullback resistance and could drop from this level to our take profit.
Entry: 2,925.63
Why we like it:
There is a pullback resistance level.
Stop loss: 2,953.39
Why we like it:
There is a pullback resistance level.
Take profit: 2,876.15
Why we like it:
There is a pullback support level.
Enjoying your TradingView experience? Review us!
Please be advised that the information presented on TradingView is provided to Vantage (‘Vantage Global Limited’, ‘we’) by a third-party provider (‘Everest Fortune Group’). Please be reminded that you are solely responsible for the trading decisions on your account. There is a very high degree of risk involved in trading. Any information and/or content is intended entirely for research, educational and informational purposes only and does not constitute investment or consultation advice or investment strategy. The information is not tailored to the investment needs of any specific person and therefore does not involve a consideration of any of the investment objectives, financial situation or needs of any viewer that may receive it. Kindly also note that past performance is not a reliable indicator of future results. Actual results may differ materially from those anticipated in forward-looking or past performance statements. We assume no liability as to the accuracy or completeness of any of the information and/or content provided herein and the Company cannot be held responsible for any omission, mistake nor for any loss or damage including without limitation to any loss of profit which may arise from reliance on any information supplied by Everest Fortune Group.

GOLD SHORT FROM RESISTANCE|
✅GOLD will soon retest a key resistance level of 2930$
So I think that the price will make a pullback
And go down to retest the demand level below at 2911$
SHORT🔥
✅Like and subscribe to never miss a new idea!✅

HelenP. I Gold will correct to support level and then rebound upHi folks today I'm prepared for you Gold analytics. Looking at the chart, we can see that the price initially climbed near the trend line before reaching Support 2, which aligned with the support zone. After this move, it reversed and dropped back to the trend line, then rebounded and eventually broke through Support 2. The price then made a retest and continued to rise, eventually reaching Support 1, which also coincided with another support zone. Shortly after, XAU broke this level and started consolidating around it. At some point, Gold attempted to push higher but later reversed, dropping back to the trend line and breaking Support 1. However, it quickly rebounded, surging back to the support zone and even higher, breaking Support 1 once again. Currently, the price is trading near this area, and I anticipate that XAUUSD will decline toward the support level before reversing and rebounding upward. In this scenario, my goal is set at 2960 points. If you like my analytics you may support me with your like/comment ❤️

Could the Gold drop from here?The price is reacting off the pivot which is a pullback resistance and could drop to the pullback support.
Pivot: 2,900.98
1st Support: 2,863.32
1st Resistance: 2,926.83
Risk Warning:
Trading Forex and CFDs carries a high level of risk to your capital and you should only trade with money you can afford to lose. Trading Forex and CFDs may not be suitable for all investors, so please ensure that you fully understand the risks involved and seek independent advice if necessary.
Disclaimer:
The above opinions given constitute general market commentary, and do not constitute the opinion or advice of IC Markets or any form of personal or investment advice.
Any opinions, news, research, analyses, prices, other information, or links to third-party sites contained on this website are provided on an "as-is" basis, are intended only to be informative, is not an advice nor a recommendation, nor research, or a record of our trading prices, or an offer of, or solicitation for a transaction in any financial instrument and thus should not be treated as such. The information provided does not involve any specific investment objectives, financial situation and needs of any specific person who may receive it. Please be aware, that past performance is not a reliable indicator of future performance and/or results. Past Performance or Forward-looking scenarios based upon the reasonable beliefs of the third-party provider are not a guarantee of future performance. Actual results may differ materially from those anticipated in forward-looking or past performance statements. IC Markets makes no representation or warranty and assumes no liability as to the accuracy or completeness of the information provided, nor any loss arising from any investment based on a recommendation, forecast or any information supplied by any third-party.

GOLD, massive rise awaits here... Seed at 2880 level, 3k next.TRADE SEED Signal:
BUY GOLD / XAUUSD.
After our successful trade on GOLD short yesterday registering a whopping 300 pips gain, we are now looking to be on the other side -- as initial shift in behavior has been spotted.
We are now at a higher pre basing zone area. Expect some weighty rise from here on target ATH levels anew with a possible break/
LONG at 2880
Target 3000.
TAYOR.
Trade safely.

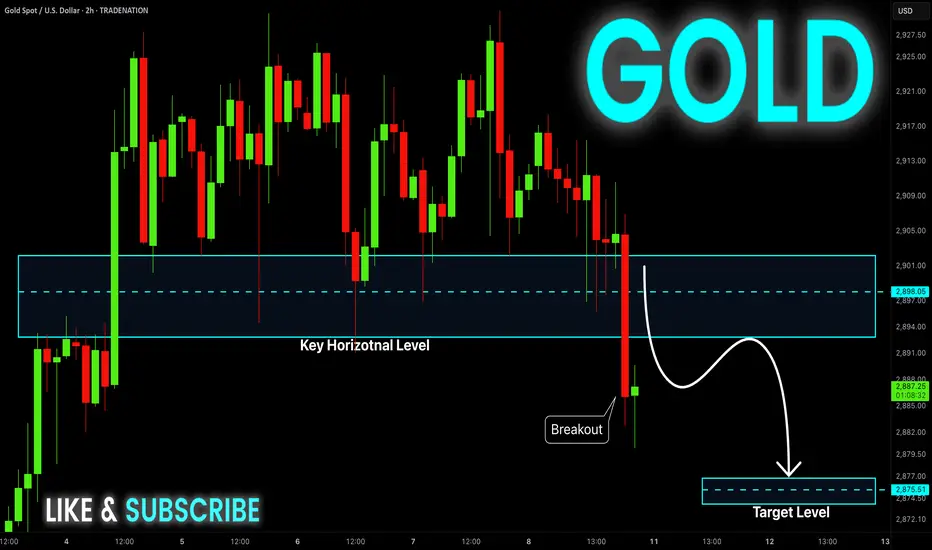
GOLD Risky Short! Sell!
Hello,Traders!
GOLD made a bearish
Breakout of the key
Horizontal level of 2900$
And the breakout is confirmed
So we are locally bearish
Biased and we will be
Expecting a further move down
Sell!
Comment and subscribe to help us grow!
Check out other forecasts below too!
Disclosure: I am part of Trade Nation's Influencer program and receive a monthly fee for using their TradingView charts in my analysis.
GOLD - Price can exit of triangle and then drop to support levelHi guys, this is my overview for XAUUSD, feel free to check it and write your feedback in comments👊
A few moments ago, the price entered a wedge, bounced from the support line, and rose to the resistance area.
Also, price breaking $2845 level and then it turned around and made correction from resistance area to support line.
Then Gold rose to resistance area again, where it some time traded and then dropped to support level.
Thereby price broke $2935 level and exited from a wedge, after which it started to trades inside a triangle.
In this pattern, price made a gap and then rose to resistance line of the triangle, after which made correction.
Now, I think that Gold can exit from a triangle and then start to decline to $2860
If this post is useful to you, you can support me with like/boost and advice in comments❤️
XAU/USD (Gold) Trendline Breakout (10.03.2025)The XAU/USD Pair on the M30 timeframe presents a Potential Selling Opportunity due to a recent Formation of a Trendline Breakout Pattern. This suggests a shift in momentum towards the downside in the coming hours.
Possible Short Trade:
Entry: Consider Entering A Short Position around Trendline Of The Pattern.
Target Levels:
1st Support – 2877
2nd Support – 2860
🎁 Please hit the like button and
🎁 Leave a comment to support for My Post !
Your likes and comments are incredibly motivating and will encourage me to share more analysis with you.
Best Regards, KABHI_TA_TRADING
Thank you.

Gold has a strong bullish momentum, could it rise from here?The price haas bounced off the pivot and could potentially rise to the 1st resistance.
Pivot: 2,859.06
1st Support: 2,790.01
1st Resistance: 2,989.91
Risk Warning:
Trading Forex and CFDs carries a high level of risk to your capital and you should only trade with money you can afford to lose. Trading Forex and CFDs may not be suitable for all investors, so please ensure that you fully understand the risks involved and seek independent advice if necessary.
Disclaimer:
The above opinions given constitute general market commentary, and do not constitute the opinion or advice of IC Markets or any form of personal or investment advice.
Any opinions, news, research, analyses, prices, other information, or links to third-party sites contained on this website are provided on an "as-is" basis, are intended only to be informative, is not an advice nor a recommendation, nor research, or a record of our trading prices, or an offer of, or solicitation for a transaction in any financial instrument and thus should not be treated as such. The information provided does not involve any specific investment objectives, financial situation and needs of any specific person who may receive it. Please be aware, that past performance is not a reliable indicator of future performance and/or results. Past Performance or Forward-looking scenarios based upon the reasonable beliefs of the third-party provider are not a guarantee of future performance. Actual results may differ materially from those anticipated in forward-looking or past performance statements. IC Markets makes no representation or warranty and assumes no liability as to the accuracy or completeness of the information provided, nor any loss arising from any investment based on a recommendation, forecast or any information supplied by any third-party.

GOLD - Price can correct to support level and then start to growHi guys, this is my overview for XAUUSD, feel free to check it and write your feedback in comments👊
The chart shows how the price rose in a rising channel, reaching the $2925 level before breaking it.
Then it touched resistance line of channel and made correction to $2925 level, where it some time traded.
After this, price moved up and then started to decline inside a triangle, where it soon exited from channel.
Next, price broke $2925 level and declined until to support line of the triangle, breaking $2880 level too.
But soon, Gold made strong movement up, breaking $2880 level and rose to resistance level, after which it corrected.
Now, I think that XAU can exit from a triangle, fall to support level and then start to grow to $2940
If this post is useful to you, you can support me with like/boost and advice in comments❤️

XAU/USD Bullish Flag (06.03.25)The XAU/USD pair on the M30 timeframe presents a Potential Buying Opportunity due to a recent Formation of a Bullish Flag Pattern. This suggests a shift in momentum towards the upside and a higher likelihood of further advances in the coming hours.
Possible Long Trade:
Entry: Consider Entering A Long Position around Trendline Of The Pattern.
Target Levels:
1st Resistance – 2949
2nd Resistance – 2969
🎁 Please hit the like button and
🎁 Leave a comment to support for My Post !
Your likes and comments are incredibly motivating and will encourage me to share more analysis with you.
Best Regards, KABHI_TA_TRADING
Thank you.

Gold XAUUSD Price AnalysisGold (XAU/USD) has encountered a strong resistance zone between 2921 and 2924, leading to a rejection at this level. This area has proven to be a significant hurdle for buyers, indicating strong selling pressure. As a result, we may see a potential downside move unless gold manages to break above this resistance convincingly.
Key Levels and Market Outlook:
Bearish Scenario:
If the rejection holds, gold could move lower towards its immediate support levels.
The first downside target is 2906, which acts as a minor support.
If selling pressure continues and gold breaks below 2906, the next target is 2892, a stronger support level where buyers might step in.
Bullish Breakout Possibility:
If gold breaks above the 2924 resistance level, the next resistance to watch is at 2930.
A break above 2930 would indicate strong bullish momentum, potentially leading to a further rally in gold prices.
Market Sentiment and Trading Plan:
A bearish bias is favored as long as gold remains below 2924 and continues rejecting this level.
A bullish breakout scenario will be confirmed only if gold surpasses 2930, leading to a continuation of the uptrend.

GOLD - Price can continue to grow and exit from wedgeHi guys, this is my overview for XAUUSD, feel free to check it and write your feedback in comments👊
The price started to grow inside the rising channel, first reaching the support line and then rising to the $2835 support level.
Next, Gold broke this level and continued to move up and rose to $2930 level, after which started to fall in wedge.
Gold exited from a channel and continued to decline near support line of wedge, but later it bounced to resistance area.
Long time XAU trades in this area and reached resistance line of wedge, after which turned around and started to fall.
Price broke $2930 level and fell to support line of wedge, after which bounced and made a gap.
So, I expect that Gold can correct little and then rise to $2930 level, exiting from wedge pattern.
If this post is useful to you, you can support me with like/boost and advice in comments❤️

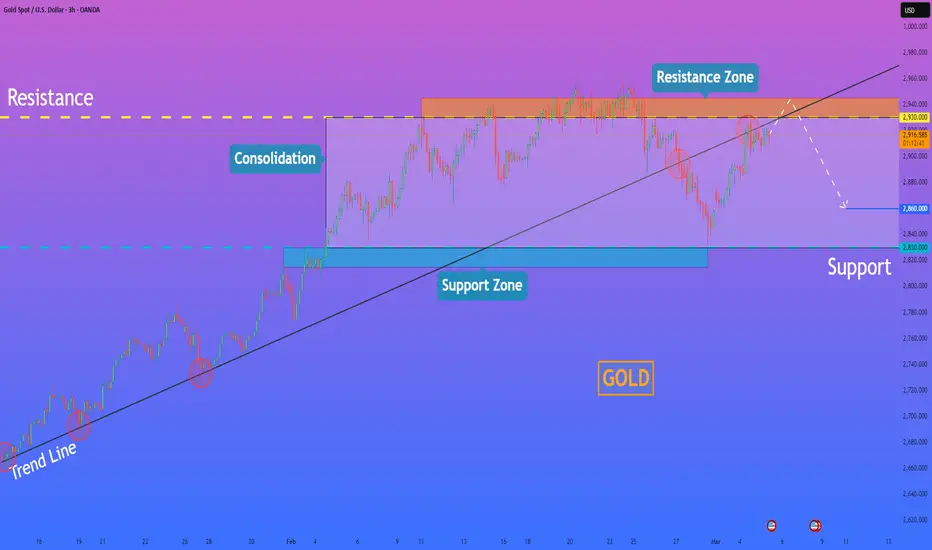
HelenP. I Gold can rebound down from resistance zone Hi folks today I'm prepared for you Gold analytics. On this chart, we can observe how the price rebounded from the trend line and began rising along it. Shortly after, the price climbed towards the support level, which aligned with the support zone, broke through it, and then entered a consolidation phase. Within this range, the price retested the broken level before surging toward the resistance level, which coincided with the upper boundary of the consolidation. It even briefly moved into the resistance zone. However, the price then reversed, made a slight correction, and quickly pushed back into the resistance area. Gold traded within the resistance zone for some time before dropping to the support level, breaking below the trend line, and then rebounding. Soon after, it recovered to the trend line but recently reversed and started declining again. In my view, XAUUSD is likely to re-enter the resistance area before reversing and declining toward 2860 points within the consolidation. If you like my analytics you may support me with your like/comment ❤️
GOLD POTENTIAL SHORT|
✅GOLD has retested a key resistance level of 2927$
And as the price is already making a bearish pullback
A move down to retest the demand level below at 2895$ is likely
SHORT🔥
✅Like and subscribe to never miss a new idea!✅

Bearish drop?XAU/USD has reacted off the resistance level which is a pullback resistance that is slightly below the 78.6% Fibonacci retracement and could drop from this level to our take profit.
Entry: 2,925.63
Why we like it:
There is a pullback resistance level that is slightly below the 78.6% Fibonacci retracement.
Stop loss: 2,953.39
Why we like it:
There is a swing high resistance level.
Take profit: 2,880.98
Why we like it:
There is a pullback support level that lines up with the 50% Fibonacci retracement.
Enjoying your TradingView experience? Review us!
Please be advised that the information presented on TradingView is provided to Vantage (‘Vantage Global Limited’, ‘we’) by a third-party provider (‘Everest Fortune Group’). Please be reminded that you are solely responsible for the trading decisions on your account. There is a very high degree of risk involved in trading. Any information and/or content is intended entirely for research, educational and informational purposes only and does not constitute investment or consultation advice or investment strategy. The information is not tailored to the investment needs of any specific person and therefore does not involve a consideration of any of the investment objectives, financial situation or needs of any viewer that may receive it. Kindly also note that past performance is not a reliable indicator of future results. Actual results may differ materially from those anticipated in forward-looking or past performance statements. We assume no liability as to the accuracy or completeness of any of the information and/or content provided herein and the Company cannot be held responsible for any omission, mistake nor for any loss or damage including without limitation to any loss of profit which may arise from reliance on any information supplied by Everest Fortune Group.
