GOLD to continue in the downward move?Gold - 24h expiry
Our short term bias remains negative.
The trend of higher intraday lows has also been broken.
Offers ample risk/reward to sell at the market.
50 1hour EMA is at 2871.
The overnight rally has been sold into and there is scope for further bearish pressure going into this morning.
We look to Sell at 2874.5 (stop at 2895.1)
Our profit targets will be 2820.8 and 2809.8
Resistance: 2876.6 / 2890.0 / 2910.0
Support: 2855.0 / 2832.4 / 2815.0
Risk Disclaimer
The trade ideas beyond this page are for informational purposes only and do not constitute investment advice or a solicitation to trade. This information is provided by Signal Centre, a third-party unaffiliated with OANDA, and is intended for general circulation only. OANDA does not guarantee the accuracy of this information and assumes no responsibilities for the information provided by the third party. The information does not take into account the specific investment objectives, financial situation, or particular needs of any particular person. You should take into account your specific investment objectives, financial situation, and particular needs before making a commitment to trade, including seeking advice from an independent financial adviser regarding the suitability of the investment, under a separate engagement, as you deem fit.
You accept that you assume all risks in independently viewing the contents and selecting a chosen strategy.
Where the research is distributed in Singapore to a person who is not an Accredited Investor, Expert Investor or an Institutional Investor, Oanda Asia Pacific Pte Ltd (“OAP“) accepts legal responsibility for the contents of the report to such persons only to the extent required by law. Singapore customers should contact OAP at 6579 8289 for matters arising from, or in connection with, the information/research distributed.
D-XAU

Bearish drop?The Gold (XAU/USD) is reacting off the pivot and could drop to the 1st support that is slightly above the 50% Fibonacci retracement.
Pivot: 2,879.45
1st Support: 2,788.35
1st Resistance: 2,952.32
Risk Warning:
Trading Forex and CFDs carries a high level of risk to your capital and you should only trade with money you can afford to lose. Trading Forex and CFDs may not be suitable for all investors, so please ensure that you fully understand the risks involved and seek independent advice if necessary.
Disclaimer:
The above opinions given constitute general market commentary, and do not constitute the opinion or advice of IC Markets or any form of personal or investment advice.
Any opinions, news, research, analyses, prices, other information, or links to third-party sites contained on this website are provided on an "as-is" basis, are intended only to be informative, is not an advice nor a recommendation, nor research, or a record of our trading prices, or an offer of, or solicitation for a transaction in any financial instrument and thus should not be treated as such. The information provided does not involve any specific investment objectives, financial situation and needs of any specific person who may receive it. Please be aware, that past performance is not a reliable indicator of future performance and/or results. Past Performance or Forward-looking scenarios based upon the reasonable beliefs of the third-party provider are not a guarantee of future performance. Actual results may differ materially from those anticipated in forward-looking or past performance statements. IC Markets makes no representation or warranty and assumes no liability as to the accuracy or completeness of the information provided, nor any loss arising from any investment based on a recommendation, forecast or any information supplied by any third-party.

Bearish drop for the Gold?XAU/USD is rising towards the resistance level which is an overlap resistance that aligns with the 38.2% Fibonacci retracement and could drop from this level to our take profit.
Entry: 2,882.39
Why we like it:
There is an overlap resistance level which is an overlap resistance that aligns with the 38.2% Fibonacci retracement.
Stop loss: 2,924.57
Why we like it:
There is an overlap resistance level that is slightly below the 78.6% Fibonacci retracement.
Take profit: 2,830.85
Why we like it:
There is a pullback support level.
Enjoying your TradingView experience? Review us!
Please be advised that the information presented on TradingView is provided to Vantage (‘Vantage Global Limited’, ‘we’) by a third-party provider (‘Everest Fortune Group’). Please be reminded that you are solely responsible for the trading decisions on your account. There is a very high degree of risk involved in trading. Any information and/or content is intended entirely for research, educational and informational purposes only and does not constitute investment or consultation advice or investment strategy. The information is not tailored to the investment needs of any specific person and therefore does not involve a consideration of any of the investment objectives, financial situation or needs of any viewer that may receive it. Kindly also note that past performance is not a reliable indicator of future results. Actual results may differ materially from those anticipated in forward-looking or past performance statements. We assume no liability as to the accuracy or completeness of any of the information and/or content provided herein and the Company cannot be held responsible for any omission, mistake nor for any loss or damage including without limitation to any loss of profit which may arise from reliance on any information supplied by Everest Fortune Group.

Gold may continue to fall inside downward wedgeHello traders, I want share with you my opinion about Gold. A short while ago, the price dropped to the support line, breaking through the resistance level that aligned with the resistance area. Following this, it rebounded and quickly climbed to the 2935 level, even entering the seller’s zone before pulling back to the support line. After that, the price made another push toward the seller’s zone but remained range-bound near the 2935 resistance level. Eventually, it reversed and began to decline, first breaking below 2935 and soon after breaching the support line as well. Gold then continued its downward movement within a falling wedge pattern. Inside this formation, the price touched the support line before rebounding to the resistance line, where it hovered for a while before eventually dropping back to the wedge’s support line, breaking the current resistance level along the way. At the moment, XAU is still moving lower, but I anticipate a temporary rise toward the resistance area before the decline resumes. Given this scenario, I have set my TP at 2830, which aligns with the wedge’s support line. Please share this idea with your friends and click Boost 🚀

GOLD possible bearish continuationXAUUSD - Possible for a bearish continuation for next week, with NFP forecasted to be weaker. But watchout for some retrace / correction for intraday play.

XAU/USD Breakdown – Key Support Levels Tested After Major Drop!### **Analysis & Description:**
This 1-hour chart of **Gold (XAU/USD)** from **OANDA** presents a strong **bearish move** following a key **liquidity grab and rejection** from the 2,942–2,950 resistance zone.
#### **Key Observations:**
- **Fair Value Gap (FGV 4H)**: The price initially tapped into the imbalance before facing a strong rejection.
- **Liquidity Sweep**: The sharp move up prior to the decline suggests that smart money may have induced liquidity before the major bearish move.
- **Bearish Break & Retest**: The price has broken through significant **support levels** around 2,892 and 2,878 and is now approaching the next support at **2,834**.
- **Fibonacci & Structure**: The Fibonacci retracement aligns with a deeper correction, with the price possibly targeting **2,820–2,800** if bearish momentum continues.
- **Risk-Reward Setup**: The risk-to-reward ratio in this trade setup suggests a well-executed short position, capturing nearly **3.70% downward movement** (approx. **-108 points**).
### **Potential Scenarios:**
🔴 **Bearish Case:** If the price sustains below 2,844 and fails to reclaim key resistance zones, further downside is likely toward **2,820–2,800**.
🟢 **Bullish Case:** A strong bounce from current levels (2,834) could trigger a short-term retracement before resuming downward momentum.
#### **Final Thought:**
Gold remains in a **strong downtrend**, and traders should watch for price action confirmation around support levels before considering further positions.

XAUUSD SHORT 4H (ALL targets DONE/Congratulations)All key targets were achieved, the position was 101% justified
Congratulations to everyone

Gold Price Analysis: Bearish Breakdown Below Key Support at 2888Gold (XAU/USD) has broken below the strong support level of 2888, indicating a potential continuation of the downtrend. This breakdown suggests increasing bearish momentum, and traders should be prepared for further declines.
Downtrend Scenario & Targets
If the bearish pressure continues, gold is likely to move toward the following downside targets:
✅ Target 01: 2866 – A minor support level where price may consolidate before further movement.
✅ Target 02: 2855 – A stronger support zone that could act as a temporary stopping point for sellers.
✅ Target 03: 2835 – A key demand zone, where buyers may step in to slow the decline.
Possible Retracement Before Further Drop
Despite the bearish outlook, gold may experience a temporary pullback before continuing lower. A retracement toward the previous support-turned-resistance at 2888 or even 2898 is possible. If the price fails to break above these levels, it could serve as confirmation for further downside movement.
Trading Strategy Considerations
🔸 Sell on Retracement: If gold retraces to 2888 or 2898 and shows rejection (bearish candlestick patterns, wicks, or resistance confirmation), it could provide a good short-selling opportunity.
🔸 Break & Retest Confirmation: If gold retests 2888 and fails to break above, it would signal further downside movement.
🔸 Risk Management: Set stop-loss above 2900 to manage risk in case of unexpected bullish reversals.

GOLD - Price can correct to support area and then start to growHi guys, this is my overview for XAUUSD, feel free to check it and write your feedback in comments👊
Some time ago, the price started to grow inside the wedge, where it immediately corrected from the resistance line to $2864 points.
Then it turned around and started to grow inside the wedge, soon broke the $2885 level and continued to grow.
Price later reached $2940 level and even long time traded near this level and later broke also broke it.
But soon, Gold turned around and made a downward movement, thereby breaking $2940 level and exiting from a wedge.
Next, price entered to triangle and continued to fall in it, and even reached a support level, after which bounced up.
So, I think that Gold can bounce from support area and rise to $2920, exiting from a triangle.
If this post is useful to you, you can support me with like/boost and advice in comments❤️

XAUUSD todays rangeThis was an awsome week so far! Great setups, great trades and 9% Profit in OANDA:XAUUSD (gold).
Probably today its better to sit on your hands. We are having a big range, its end of the week and some big news are coming up.
Stay safe traders
- No financial advice

XAG/USD Bearish Flag (27.2.25)The XAG/USD Pair on the M30 timeframe presents a Potential Selling Opportunity due to a recent Formation of a Bearish Flag Pattern. This suggests a shift in momentum towards the downside in the coming hours.
Possible Short Trade:
Entry: Consider Entering A Short Position around Trendline Of The Pattern.
Target Levels:
1st Support – 31.06
2nd Support – 30.66
🎁 Please hit the like button and
🎁 Leave a comment to support for My Post !
Your likes and comments are incredibly motivating and will encourage me to share more analysis with you.
Best Regards, KABHI_TA_TRADING
Thank you.

XAUUSD SHORT 4H (Results 3 Targets)Taking into account the existing formation structure, the logical and correct decision now would be to move the stop order to $2929.56.
part of the volume in position is held in accordance with the expectations of the targets:
4 - $2864.330
5 - $2834.270
6 - $2817.215

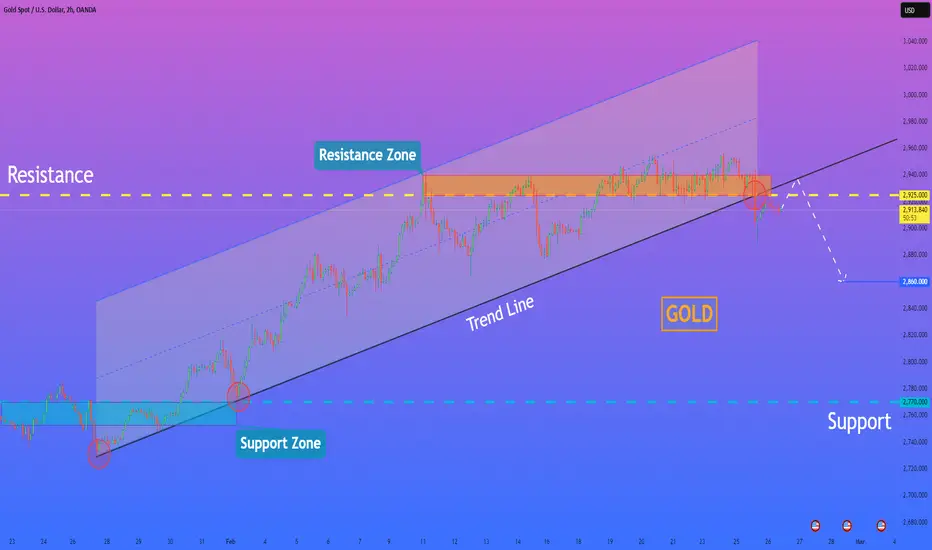
HelenP. I Gold will grow to trend line and then rebound downHi folks today I'm prepared for you Gold analytics. On this chart, we can observe how the price was trading near the support level, which aligned with a key support zone. Gold initially dropped, rebounded from the trend line, and began moving higher within an upward channel. However, it eventually broke below the support level. Following this, the price made a correction to the trend line, which acted as support, before continuing its upward movement. Later, it reached the resistance level, which coincided with a resistance zone, and then pulled back downward. After this move, the price made a minor correction and quickly returned to the resistance area. Gold repeated this pattern once more, spending some time trading near resistance before recently breaking below it. Additionally, the price has broken through the trend line and exited the channel. Given this setup, I anticipate that XAUUSD will first rise back to the trend line before resuming its decline. My goal for this scenario is set at 2860. If you like my analytics you may support me with your like/comment ❤️
XAUUSD - Worries about the US economy!?Gold is below the EMA200 and EMA50 on the 30-minute timeframe and is in its descending channel. An upward correction of gold towards the supply limits will provide us with the next selling position with a good risk-reward ratio.
An economist believes that the massive influx of gold and silver into the United States, coupled with speculation about the liquidity of the country’s gold reserves, could have profound effects on American consumers as well as the domestic and global economy.
Thorsten Pollitt, professor emeritus of economics at the University of Bayreuth and publisher of the BOOM & BUST report, told Kitco News that the increase in physical gold and silver inflows into the US is not surprising, as banks are increasing their reserves to counter potential risks associated with tariffs. He stressed that while the likelihood of tariffs on gold and silver is low, the risk is significant enough for banks and investors to take a precautionary approach.
Looking at the long-term implications of this, Pollitt explained that the increase in US gold and silver reserves, coupled with the government’s renewed focus on its reserves, could lead to expectations that both precious metals would be used as currency alongside the US dollar.
He added that using gold and silver as hard currency alongside the dollar could help reduce the problem of inflation, which has become a major challenge for the economy. However, he stressed that for such a scenario to happen, the price of gold and silver would have to reach a much higher level to be commensurate with the size of the US economy. (Hard currency refers to a form of currency that is globally accepted and retains its value due to its stability and reliability.)
Pollitt went on to explain that the significant increase in US government debt has put not only the Federal Reserve, but the entire fiat-based monetary system at risk. “In the future, the Federal Reserve will no longer be able to maintain the same flexibility that it has in the past,” he said. For example, in times of financial crises, the Fed would usually support the economy by injecting liquidity into it. But now, doing so could trigger a wave of hyperinflation. We now know that the Fed can no longer simply be the savior of the economy as it used to be.”
He also warned that the Fed’s policies have led to the market not pricing in risks properly. For example, yields on risky corporate bonds are significantly below their historical average. Currently, the yield spread between B-rated corporate bonds and U.S. Treasury bonds is 1.45 percent, its lowest level since mid-1979.
Warren Buffett, one of the most influential figures in the investment world, has made his concerns clear. In his annual letter to shareholders, the 94-year-old has a stark message for policymakers in Washington: financial turmoil and monetary instability pose a serious threat to the U.S. economy.
The warning comes as his conglomerate Berkshire Hathaway has delivered a record-breaking profit and a record $334.2 billion in cash. But Buffett is treading carefully as investment opportunities appear to be shrinking and is preparing to hand over the reins to his appointed successor, Greg Abel.
In the letter, Buffett expressed concern about the growing U.S. budget deficit and warned of a possible extension of tax cuts that began under Trump. He emphasizes that “irresponsible fiscal policies can destroy the value of paper money” and emphasizes the importance of sound public financial management. According to him, the stability of the US economy depends on a strong dollar, and any mistake in monetary policy can have irreparable consequences.
With the rapidly growing budget deficit and increasing discussions about extending the Trump-era tax cuts, Buffett warns that the value of the dollar may weaken. He calls on Washington policymakers to maintain a stable economic framework and support the vulnerable:
“Support people who have been unfortunate in life through no fault of their own. They deserve a better life.”
Warren Buffett reminds us of one of the fundamental principles of investing: “In times of uncertainty, caution and responsible management are more important than ever.” His warning about the growth of the US public debt and the depreciation of the dollar may come true if current trends continue.
Moreover, his focus on investing in Japan and preparing for his successor is a key step for the future of Berkshire Hathaway, a company that must find its way without him in a world of increasing economic instability.

XAUUSD - 1hr | Wyckoff Event UPDATEWe await the price to confirm the last step (6) to complete the distribution Phase. The price has fallen to SUPPORT as we predicted. Once a LOWER LOWER is formed, the Distribution Phase is complete. Expect gold turn to remain bearish. Falling as low as 2815.
BULLS :
If the price can respect the support and bounce back above 2910 with strong bullish momentum, we can see the price rally back up to the 2950 area.
BEARS :
If the price creates the lower low as we are expecting around 2860-2880. Then look for the price to:
1. retest support as far back up to 2910.
2. dramatically fall and continue its pullback as low as 2800-2820

GOLD - Price can make movement up and then fall to $2880Hi guys, this is my overview for XAUUSD, feel free to check it and write your feedback in comments👊
Not a long time ago, the price started to grow inside rising channel, where it soon reached $2760 level.
Price some time traded inside support area and then broke $2760 level, after which continued to grow next.
Soon, price made a correction to support line of channel and then rose to $2880 level and at once made a small correction.
After this, Gold broke $2880 level and then exited from a channel and started to trades inside flat.
In flat, Gold declined to support level and then in a short time rose to the top part of flat, where it trades near now.
In my mind, Gold can make a move up and then start to decline to $2880 support level.
If this post is useful to you, you can support me with like/boost and advice in comments❤️

XAUUSD SHORT 4H (Results)Due to inattentive study of the rules of the tradingviews platform, the trading idea was blocked
I apologize to those who used this idea in their trading system due to the blocking, I will be more careful in the future.
Result : XAUUSD SHORT 4H reaches the 2 targets zone for taking profits.
I move my stop into profit and wait for new variables from the market .

GOLD (XAU/USD) – Breakdown from Flat Range? Hello traders
💰 Gold Spot (XAU/USD) - 2H Chart Analysis
🔍 Market Insights:
🔹 Uptrend Channel Breakout: Gold was trending in a bullish channel but broke out and transitioned into a flat consolidation.
🔹 Flat Price Action: After multiple rejections at the top, price has failed to continue the bullish momentum.
🔹 Potential Breakdown: The price is now showing bearish momentum and could test the $2,880 support level.
📉 Key Levels to Watch:
✅ Resistance: $2,950 - $2,960 (Flat Range Top)
✅ Support: $2,880 (Key Support) & $2,760 (Major Support)
📊 Possible Scenarios:
📌 Bearish Continuation: If the price fails to reclaim $2,925, we may see a drop to $2,880, and potentially $2,760 if bearish pressure continues.
📌 Reversal Opportunity: A bounce from $2,880 could lead to a retest of the upper range near $2,950.
💬 Will gold break down further or find support for another push higher? Let me know in the comments! 🔥👇
#gold #xauusd #forex #trading #priceaction #technicalanalysis

GOLD (XAU/USD) – Breakout or Deeper Pullback?Hello, Traders! 👋
What are your thoughts on gold?
Gold remains in a robust uptrend, with each downturn providing a buying opportunity inside the trend.
The ideal strategy at this point is to wait patiently for a price pullback to support levels before starting a buy position.
Another method is to wait for a break above the most recent high before buying on a pullback to the broken level.
The bullish trend continues, but trades must be performed with correct risk management and confirmation indications.
What is your opinion on gold? Do you anticipate further growth?
🚀 GOLD (XAU/USD) – Breakout or Deeper Pullback? 🔥
💰 Gold Spot (XAU/USD) - 8H Chart Analysis
🔍 Market Insights:
🔹 Strong Uptrend: Gold continues to hold its bullish momentum, respecting the ascending trendline.
🔹 Key Resistance Zone: The $2,945 - $2,960 area has been acting as a supply zone (black box).
🔹 Fibonacci Support: Price recently tested the 0.236 Fib levels ($2,902 & $2,871), which align with a key demand zone (yellow box).
📈 Two Potential Scenarios:
📌 Bullish Breakout: If price holds above the trendline & reclaims resistance, we may see a breakout towards $2,980 - $3,000 🚀.
📌 Deeper Pullback: If support breaks, we could see a correction to $2,875 - $2,850 before a stronger reversal.
📊 Key Levels to Watch:
✅ Support: $2,902 - $2,871 (Fib Levels & Trendline)
✅ Resistance: $2,945 - $2,960 (Supply Zone)
💬 Do you think gold will break out or dip before the next leg up? Drop your thoughts below! 🔥👇
#gold #xauusd #forex #trading #priceaction #technicalanalysis

XAU/USD – Trendline Breakout Signals Sell!The XAU/USD Pair on the M30 period offers a potential selling opportunity due to the recent formation of a Trendline Breakout Pattern. This indicates a shift in momentum to the downside in the coming hours.
For a short trade, consider entering around the pattern's trendline.
Target levels: 2904 (first support) and 2880 (second support).
:
🚨 XAU/USD – Trendline Breakout Signals Sell! 📉
💰 Gold Spot (XAU/USD) - 30M Chart Breakdown
🔍 Key Observations:
🔹 Trendline Breakout: Price broke below the strong ascending trendline, confirming a bearish shift.
🔹 Resistance Zone: $2,942 - $2,954 acted as a rejection point, leading to a sharp sell-off.
🔹 Strong Bearish Momentum after breaking key support levels.
📉 Bearish Trade Setup:
📌 As long as price remains below $2,912, we expect further downside towards:
🎯 1st Support: $2,903
🎯 2nd Support: $2,880
📌 A break above $2,912 could lead to a short-term recovery, but overall bias remains bearish.
📊 Key Levels to Watch:
✅ Resistance: $2,942 - $2,954
✅ Support: $2,903 & $2,880
💬 Do you agree with this bearish outlook? Let us know in the comments!👇🔥
#gold #xauusd #forex #trading #priceaction #technicalanalysis

XAU/USD (Gold) Trendline Breakout (21.02.2025)The XAU/USD Pair on the M30 timeframe presents a Potential Selling Opportunity due to a recent Formation of a Trendline Breakout Pattern. This suggests a shift in momentum towards the downside in the coming hours.
Possible Short Trade:
Entry: Consider Entering A Short Position around Trendline Of The Pattern.
Target Levels:
1st Support – 2904
2nd Support – 2880
🎁 Please hit the like button and
🎁 Leave a comment to support for My Post !
Your likes and comments are incredibly motivating and will encourage me to share more analysis with you.
Best Regards, KABHI_TA_TRADING
Thank you.

HelenP. I Gold may enter to resistance zone and then start fallHi folks today I'm prepared for you Gold analytics. Not long ago, the price climbed into the support zone before making a corrective move down to the trend line. After that, it reversed and began rising within a wedge pattern, eventually reaching the support level, breaking through it, and continuing to move higher. Later, Gold surged into the resistance zone but soon faced a sharp correction back to the trend line. However, in a short time, it rebounded and returned to the resistance level. After another drop to the trend line, the price once again started climbing. Soon, Gold reached the resistance level and consolidated below it for some time before finally breaking through and touching the wedge’s resistance line. Following this movement, the price reversed and started declining. It attempted to recover but is currently trading below the resistance level. From my perspective, XAUUSD is likely to enter the resistance zone again before reversing and falling back to the trend line, which also acts as the wedge’s support. Given this outlook, I’ve set my target at 2915, close to the trend line. If you like my analytics you may support me with your like/comment ❤️

$GOLD ANALYSIS (15-Minute Timeframe)! TVC:GOLD is testing the black resistance line ⚫ on the 15-minute chart.
✅ If breakout is successful, the first target is the green line level 🟩.
