GOLD Bullish Bias! Buy!
Hello,Traders!
GOLD is making a bullish
Rebound from the support
Cluster of rising and horizontal
Support levels so as Gold is
Trading in an uptrend we are bullish
Biased and we will be expecting
A further bullish move up
Buy!
Comment and subscribe to help us grow!
Check out other forecasts below too!
D-XAU

GOLD GROWTH AHEAD|LONG|
✅GOLD is trading in an
Uptrend along the rising
Support and we are already
Seeing a bullish rebound
So we will be expecting
A further bullish move up
LONG🚀
✅Like and subscribe to never miss a new idea!✅

XAU/USD may enter the resistance zone and then start fallingHello everyone, today I'm ready to provide you with Gold analytics. Not long ago, the price surged into the support zone before correcting back down to the trend line. Following that, it reversed and began rising in a wedge formation, finally hitting the support level, breaking through it, and continuing higher. Later, gold rose into the resistance zone, but it quickly corrected back to the trend line. However, it quickly recovered and returned to the resistance level. Following another drop to the trend line, the price resumed its upward trend. Gold quickly approached the resistance level and consolidated beneath it for some time before breaking through and touching the wedge's resistance line. Following this fluctuation, the price reversed and began to decline. It attempted to recover, but is now trading below the resistance level. From my perspective, XAUUSD is expected to retest the resistance zone before reversing and dropping back to the trend line, which also serves as the wedge's support. Given this view, I've set a goal of 2915, which is close to the trend line.
:
🚀 XAU/USD – Rising Wedge Formation! Key Breakdown Incoming? 📉
💰 Gold Spot (XAU/USD) - 1H Chart Analysis
🔍 Key Observations:
🔹 Ascending Trend Line is acting as strong dynamic support.
🔹 Resistance Zone at the top of the wedge is holding price down.
🔹 Support Zone has been tested multiple times, showing buying pressure.
🔹 Price is currently at the upper boundary of the wedge—possible rejection?
📉 Potential Trade Setups:
📌 Bearish Scenario:
If price rejects from the resistance zone, a drop toward $2,915 is likely.
A break below $2,915 could trigger further downside toward $2,880 support.
📌 Bullish Scenario:
A clear breakout above resistance and trend line invalidates the wedge.
If price closes above $2,950, it may rally toward $2,970 - $2,980.
🔔 Key Levels to Watch:
✅ Resistance: $2,950 - $2,960
✅ Support: $2,915 - $2,880
💬 What’s your bias? Breakout or Breakdown? Drop your thoughts below! 🔥👇
#gold #xauusd #forex #trading #priceaction #technicalanalysis

Gold might descend to a support level, breaching the resistance Hi, traders. I'd like to share with you my thoughts on Gold. On this chart, we can observe that the price has recovered from the mirror line and begun to rise. Shortly later, it approached the support level, broke it, and hovered for a while before returning to the mirror line. Later, the price broke through the support level once more and resumed trading inside a range. During this phase, it climbed to the resistance level, which coincided with the seller zone, before retreating to the mirror line. Gold then dipped into the buyer zone before quickly rising over the mirror line and into the seller zone. Following this movement, XAU corrected below the mirror line and resumed its upward journey. Shortly later, the price approached the resistance level, broke through it, and departed the range. For a while, gold traded above the seller zone, but it subsequently plummeted and is presently hovering at the 2930 resistance level within the sale zone. I anticipate Gold will climb little before continuing to drop, eventually shattering the resistance level. Furthermore, I believe that following the breakout, it will prolong its slide toward the 2865 support level. Please share this idea with your friends and click Boost! 🚀
:
📉 XAU/USD - Bearish Reversal from Seller Zone! 🚨
💰 Gold Spot (XAU/USD) - 1H Chart Analysis
Key Insights:
🔹 Resistance Level Held Strong – Price tested the seller zone but failed to break through, signaling strong bearish momentum.
🔹 Buyer Zone Played Out – Earlier, buyers pushed the price up from a strong accumulation zone, but exhaustion is visible now.
🔹 False Breakout & Range Formation – A range developed at the top, indicating distribution before a potential drop.
🔹 Support Level in Sight – If the price follows the projected path, we might see a test of the $2,865 - $2,850 zone soon.
📊 Trading Plan:
📌 Bearish Bias: Look for short opportunities as long as price stays below resistance.
📌 Confirmation Needed: A break below $2,930 would strengthen bearish sentiment.
📌 Targets: $2,900, then $2,865 - $2,850.
🚀 What do you think? Will gold break down or bounce back? Drop your thoughts in the comments! 👇🔥
#gold #xauusd #trading #forex #priceaction #technicalanalysis

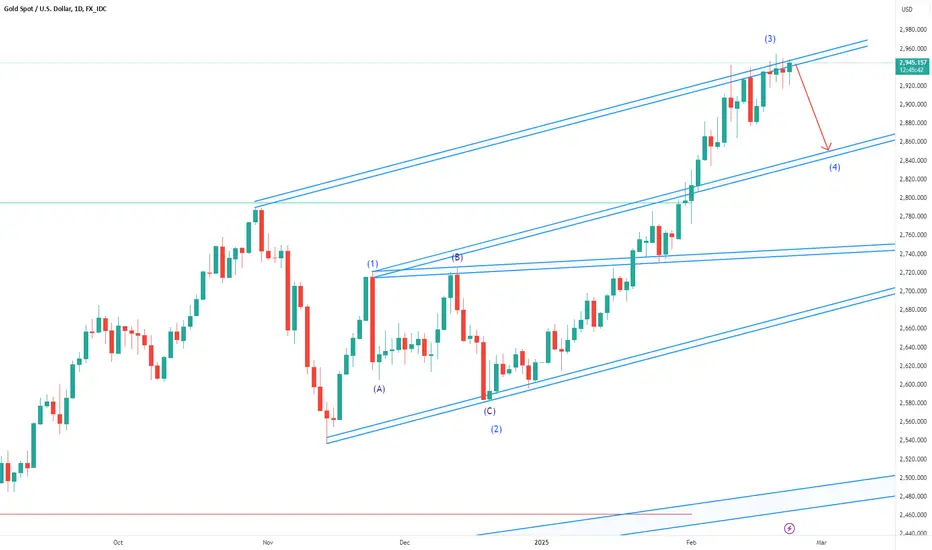
#Gold Wave 4 soon$3000 is a psychological level. So, I believe wave 3 should end here. It could go a little higher ~$3030ish. Then will drop about 5%-7% to conclude wave 4.
Overall I am bullish on Gold (XauUsd).
#XAU
TVC:XAU

XAUUSD - 1hr | Wyckoff EventSimple Trading: Distribution Phase
First, we can see that gold has started to consolidate. Once we see this, we look back at previous candles to identify the patterns in this phase:
(1) preliminary resistance
(2) the last buy
(3) a retest to confirm support
(4) confirm resistance without making a higher high.
(5) Higher high (typically a FAKEOUT)
We are waiting for the price to confirm the last step (6) to complete the pattern. If the price falls to SUPPORT, creating a LOWER LOWER, the Distribution Phase is complete. Expect gold turn to remain bearish.
Falling as low as 2815.

Gold might descend to a support level, breaching the resistance Hi, traders. I'd like to share with you my thoughts on Gold. On this chart, we can observe that the price has recovered from the mirror line and begun to rise. Shortly later, it approached the support level, broke it, and hovered for a while before returning to the mirror line. Later, the price broke through the support level once more and resumed trading inside a range. During this phase, it climbed to the resistance level, which coincided with the seller zone, before retreating to the mirror line. Gold then dipped into the buyer zone before quickly rising over the mirror line and into the seller zone. After this movement, XAU corrected below the mirror line and resumed its upward journey.
Shortly later, the price approached the resistance level, broke through it, and departed the range. For a while, gold traded above the seller zone, but it subsequently plummeted and is presently hovering at the 2930 resistance level within the sale zone. I anticipate Gold will climb little before continuing to drop, eventually shattering the resistance level. Furthermore, I believe that following the breakout, it will prolong its slide toward the 2865 support level. Please share this idea with your friends and click Boost! 🚀
📊 XAU/USD – Key Levels for the Week Ahead 🔍
Gold (XAU/USD) is trading within a well-defined range, testing the seller zone near resistance while eyeing the buyer zone near support.
🔴 Resistance Level: 2,930 - 2,940 (Seller Zone)
🟢 Support Level: 2,865 (Buyer Zone)
📉 Potential Scenarios:
1️⃣ Bearish Rejection from resistance could push price down to the support level (2,865).
2️⃣ Breakout Above 2,940 may signal further upside potential.
3️⃣ Range-Bound Movement between support and resistance until a clear breakout.
📌 Market Outlook: Watching price action near key levels for confirmation before entering trades! 🚀

Gold can drop to support level, breaking resistance levelHello traders, I want share with you my opinion about Gold. On this chart, we can see that the price rebounded from the mirror line and began to rise. Shortly after, it reached the support level, broke it, and hovered around this area for some time before dropping back to the mirror line. Later, the price broke through the support level once again and started trading within a range. During this phase, it climbed to the resistance level, which aligned with the seller zone, before pulling back to the mirror line. Gold then dipped into the buyer zone but quickly surged above the mirror line, entering the seller zone. After this movement, XAU corrected below the mirror line before resuming its upward trajectory. Not long after, the price reached the resistance level, broke through it, and exited the range. For some time, Gold traded above the seller zone, but recently, it dropped and is now hovering near the 2930 resistance level within the seller zone. I believe that Gold might rise slightly before continuing its decline, eventually breaking the resistance level. Additionally, I anticipate that after the breakout, it could extend its decline toward the 2865 support level. Please share this idea with your friends and click Boost 🚀

HelenP. I Gold may continue an upward trendHi folks today I'm prepared for you Gold analytics. In this scenario, we can observe how the price initially reached Support 2 before dropping further to Support 3, eventually breaking through and touching the trend line. From there, the price began to rise, fluctuating between the trend line, and soon broke through Support 3 once again. After this, the price made a slight correction toward the support zone before climbing back to the trend line, continuing to move upward just below it. Shortly after, Gold reached Support 2 again and swiftly broke through, even making a false breakout of the trend line before correcting back to the support zone. Following this move, XAU resumed its upward trajectory, eventually breaking above the trend line and reaching Support 1, which aligned with the support zone. The price continued its bullish movement, surging as high as 2942 points before correcting back to the trend line. Currently, Gold remains in an uptrend, and I anticipate another correction to the trend line before continuing its upward movement. Based on this outlook, I have set my target at 3000 points. If you like my analytics you may support me with your like/comment ❤️

Gold (XAU/USD) Bullish Trend – Retest of Support Before BreakoutGold (XAU/USD) Bullish Trend – Retest of Support Before Breakout 🚀
📊 Timeframe: 4H
💰 Current Price: $2,938
📈 Trend: Strong Uptrend with Higher Highs & Higher Lows
Market Overview:
Gold is following a well-established bullish trend, consistently respecting the trendline support and bouncing off key support zones. The price is currently retesting a critical support level at $2,865, which aligns with previous breakout zones.
Key Levels to Watch:
✅ Support Zones: $2,865 (Major trendline support)
✅ Resistance Zones: $3,000 (Psychological level & next target)
✅ Potential Deeper Pullback: $2,730 (Secondary support)
Technical Analysis:
🔹 Trendline Holding: Price has respected the trendline multiple times, acting as dynamic support.
🔹 Support Zone Confirmation: Each dip into the support zones has led to a continuation of the uptrend.
🔹 Potential Breakout Towards $3,000: If support holds, gold could target the psychological level of $3,000.
Trade Plan:
🔹 Bullish Scenario:
A successful retest of $2,865 with bullish confirmation (strong candles, wicks rejecting lower levels) could trigger an entry.
Target: $3,000 (resistance zone)
🔹 Bearish Scenario:
If price breaks below $2,865, we could see a correction to $2,730 before resuming the uptrend.

GOLD - After correct to support line, price can bounce to $2930Hi guys, this is my overview for XAUUSD, feel free to check it and write your feedback in comments👊
Recently price started to grow inside upward wedge, and soon reached $2855 level and broke it, after which made retest.
Then Gold some time traded near this level, corrected to support area and then continued to move up.
Later it reached resistance line of wedge, before making a gap, after which price turned around and dropped.
Price almost fell to support line of wedge and then bounced up to resistance area, after which quickly fell back.
Next, price in a short time rose to resistance line of wedge, breaking $2930 level, but then started to decline.
In my opinion, after a breakout of $2930 level, Gold can bounce up to $2970 from support line and exit from wa edge.
If this post is useful to you, you can support me with like/boost and advice in comments❤️

GOLD Will Keep Growing! Buy!
Hello,Traders!
GOLD is trading in an uptrend
Along the rising support line
And the price made a bullish
Breakout of the key horizontal
Level of 2940$ which reinfrces
Our bullish bias and makes
Us expect a further
Bullish continuation
Buy!
Comment and subscribe to help us grow!
Check out other forecasts below too!

$BTC have a gold fractal!Please pay attention to the Bitcoin chart and the Gold fractal! It's incredible, but it looks very similar. The level of correlation is quite high! Similar formation of tops, bottoms, breakout without retest and then now breakout phase with retest. The retest was successful. Very soon there will be the strongest growth! Good luck!
Horban Brothers!

Gold is boring? Until it moves! – PipGuard Guide PT. 3 🔥 Gold is boring? Until it moves! – PipGuard Guide PT. 3 🔥
📢 Let's talk: FOLLOW ME, COMMENT, and DROP A BOOST! Because in here, we help each other and we mean business! 💪🔥
Welcome to the PipGuard Guide , the only one that tells it like it is: no filters, no fairy tales, just a pinch of sarcasm. Gold is playing hard to get (what a shock, right?), but trust me, sooner or later, it wakes up—and when it does, fireworks will follow.
🎯 Key levels to watch:
🚀 Bullish resistances: $2947 / $2943
🛠️ Bullish support: $2924
📉 Bearish resistances: $2918 / $2906
⚔️ Make-or-break level: $2906-$2905 ➜ Above? Bulls take charge. Below? Bears lurking.
💎 PipGuard Targets:
🎯 Bullish Premium: $3015
🔻 Bearish Premium: $2856
Watch out for $2906: that’s the thin line between paradise and disaster.
📌 If we hold above: bulls have room to run, aiming for $3015.
📌 If we break below: bears take over, dragging us down to $2856.
💡 So, what’s the move? Wait for a strong signal, then act—no hesitation. We're dancing above $2906, but if we slip… expect a hard fall. The market is either slapping us in the face or rewarding us with solid gold. And you? Ready to take your position?!
🔥 DROP A BOOST and COMMENT BELOW! What do you think? Sleeping gold or ready to strike? See you on the battlefield!
🚀 PipGuard

GOLD STRONG BULLISH BIAS|LONG|
✅GOL D made a strong bullish
Rebound from the horizontal
Support below of 2868$ just as
We predicted in our previous
Analysis and and is going up now
Which combined with the fact
That gold is trading in a strong
Long-term uptrend along the
Rising support line makes us
Bullish biased and IF we see a
Bullish breakout of the
Horizontal resistance level above
Around 2940$ this will serve as
A confirmation of our bullish
Bias and we will be expecting
A further bullish continuation on Gold
SWING LONG🚀
✅Like and subscribe to never miss a new idea!✅

GOLD Very Risky Short! Sell!
Hello,Traders!
GOLD is trading in an
Strong uptrend but the
Price will soon hit a strong
Horizontal resistance level
Of 2943$ which is an
All-time-high so after the
Retest we will be expecting
A local bearish correction
Sell!
Comment and subscribe to help us grow!
Check out other forecasts below too!

Daily Market Outlook: BTC, DXY & Gold – Key Trade Setups (#5)The market still seems indecisive , but I’m here to find the best trade triggers for BTC and Forex. Let’s break it down.
📊 DXY – Breaking Key Support
DXY has entered a corrective phase after breaking below the 107.335 support.
🔹 Key Support Levels:
105.656 (Aligned with the 30% Fibonacci retracement)
103.367 (Aligned with the 60% Fibonacci retracement)
💡 106.602 could act as a short-term support, and if it breaks, it might be time to focus on USD pairs for potential setups.
🟡 XAU/USD (Gold) – Retesting ATH?
Gold rejected its all-time high at 2937.91 and now seems to be retesting this major resistance.
📊 What’s happening?
Gold is still in an uptrend, but momentum is fading.
Smaller bullish candles vs. larger bearish candles indicate possible exhaustion.
A correction could be healthy, but shorting remains risky in an uptrend.
📌 Trade Triggers:
✅ Long Entry: After a confirmed breakout above 2940
❌ Short Entry: Below 2879.74 (High risk due to trend direction)
📉 BTC – 95K Support Breaking?
BTC is attempting to break below the 95K support. If this level is lost, we could see a move toward 92K, 85K, and even 82K.
📌 Strategy:
✅ Short Trigger (Activated): 95245 (Yesterday’s signal)
✅ If You Missed It: Wait for a pullback or a new structure before entering.
Final Thoughts
⚠ This is a highly volatile market – avoid chasing trades and wait for confirmations.
⚠ If you’re not using risk management, these setups may not be suitable for you.
I’m Skeptic , see you tomorrow with another market breakdown! <3

Gold (XAU/USD) Technical Analysis – February 18, 2025Trend : Gold is in a strong uptrend, trading within a rising channel.
The price has consistently respected the green trendline (support).
Higher highs and higher lows confirm bullish momentum.
Key Levels:
Support: $2,750, $2,650 (major swing lows)
Resistance: $2,950, $3,000 (psychological level)
Technical Patterns:
There are multiple bullish breakouts from consolidation zones, marked by red resistance trendlines. The recent breakout above $2,850 suggests a continuation toward $3,000.
Ascending channel formation with a possible breakout to $3,250 in the long term.
Indicators:
Bollinger Bands: The price is riding the upper band, showing strong buying pressure.
Momentum: Continues to favor bulls unless there’s a breakdown below $2,850.
1-Hour Chart (Second Image) Analysis
Short-Term Trend:
Gold recently retested support around $2,880 and is consolidating.
Price is trading above the green trendline, maintaining a bullish structure.
Bearish Pullback Areas:
The bearish wick at $2,940 suggests rejection from strong resistance.
A break below $2,880 may signal a temporary correction toward $2,850.
Key Intraday Levels:
Support: $2,880, $2,850
Resistance: $2,940, $3,000
Possible Setups:
Breakout Buy: Above $2,940 → Target $3,000.
Support Buy: Around $2,880–$2,850 with stop loss below $2,840.
Short-term Sell: If price rejects $2,940 again, targeting $2,880.
Trading Ideas & Strategy
1. Swing Trading (Daily Chart Perspective)
Long Entry: Buy on a pullback near $2,850–$2,880, targeting $3,000–$3,250.
Stop Loss: Below $2,820.
2. Intraday Trading (1H Chart)
Buy: If price reclaims $2,940 → Target $3,000.
Sell: If price rejects $2,940 again → Target $2,880 with a stop loss at $2,955.
3. Risk Management
Keep SL tight (~$20-$30 range) due to Gold’s volatility.
Use trailing stop loss to secure profits as price moves higher.
Conclusion
Bullish Trend Dominates: Gold remains in a strong uptrend, and as long as it holds above $2,850–$2,880, buying dips remains the best approach.
Short-term Rejections Possible: If resistance at $2,940 holds, a small pullback may happen before another push higher.
Long-term Target: $3,000–$3,250 remains achievable in the coming weeks if bulls maintain control.

HelenP. I Gold may correct to trend line and then start to growHi folks today I'm prepared for you Gold analytics. Recently, the price began to rise from the trend line and quickly approached Support 2. After breaking this level, which aligned with the support zone, it made a slight upward movement before pulling back to the trend line. Following this correction, the price resumed its upward momentum and soon reached Support 1, another level that matched the support zone. At this point, Gold traded around Support 1 for some time before making a minor correction. Then it reversed direction and decisively broke through Support 1, entering a consolidation phase. Within this range, the price initially climbed to the upper boundary before retracing back to Support 1. Gold lingered near this level for a while and eventually rose again to the upper part of the range, only to reverse and start declining. Currently, Gold has reached a support level and is trading near it. In my view, XAUUSD will likely drop further into the support zone, touch the trend line, and then begin moving upward toward the top of the consolidation range. For this scenario, I have set my target at 2940 points, which aligns with the upper boundary of the range. If you like my analytics you may support me with your like/comment ❤️

Bullish bounce?The Gold (XAU/USD) is falling towards the pivot which acts as a pullback support and could bounce to the 1st resistance.
Pivot: 2,790.01
1st Support: 2,721.96
1st Resistance: 2,929.89
Risk Warning:
Trading Forex and CFDs carries a high level of risk to your capital and you should only trade with money you can afford to lose. Trading Forex and CFDs may not be suitable for all investors, so please ensure that you fully understand the risks involved and seek independent advice if necessary.
Disclaimer:
The above opinions given constitute general market commentary, and do not constitute the opinion or advice of IC Markets or any form of personal or investment advice.
Any opinions, news, research, analyses, prices, other information, or links to third-party sites contained on this website are provided on an "as-is" basis, are intended only to be informative, is not an advice nor a recommendation, nor research, or a record of our trading prices, or an offer of, or solicitation for a transaction in any financial instrument and thus should not be treated as such. The information provided does not involve any specific investment objectives, financial situation and needs of any specific person who may receive it. Please be aware, that past performance is not a reliable indicator of future performance and/or results. Past Performance or Forward-looking scenarios based upon the reasonable beliefs of the third-party provider are not a guarantee of future performance. Actual results may differ materially from those anticipated in forward-looking or past performance statements. IC Markets makes no representation or warranty and assumes no liability as to the accuracy or completeness of the information provided, nor any loss arising from any investment based on a recommendation, forecast or any information supplied by any third-party.

GOLD REBOUND AHEAD|LONG|
✅GOLD went down from
The resistance of 2942$ just
As we predicted in our previous
Analysis and keeps falling
So now Gold is locally oversold
And after the retest of the
Horizontal demand level below
Around 2868$ a local bullish
Correction is to be expected
LONG🚀
✅Like and subscribe to never miss a new idea!✅

GOLD Risky Long! Buy!
Hello,Traders!
GOLD is making a strong
Bearish correction and
Looks locally oversold so
After it hits the horizontal
Support level of 2868$
We will be expecting a
Local bullish rebound
And a move up
Buy!
Comment and subscribe to help us grow!
Check out other forecasts below too!
