Potential bearish drop off major support?The Gold (XAU/USD0 has broken out of the pivot which acts as an overlap support and could drop to the 1st support which has been identified as an overlap support.
Pivot: 3,374.04
1st Support: 3,341.44
1st Resistance: 3,398.38
Risk Warning:
Trading Forex and CFDs carries a high level of risk to your capital and you should only trade with money you can afford to lose. Trading Forex and CFDs may not be suitable for all investors, so please ensure that you fully understand the risks involved and seek independent advice if necessary.
Disclaimer:
The above opinions given constitute general market commentary, and do not constitute the opinion or advice of IC Markets or any form of personal or investment advice.
Any opinions, news, research, analyses, prices, other information, or links to third-party sites contained on this website are provided on an "as-is" basis, are intended only to be informative, is not an advice nor a recommendation, nor research, or a record of our trading prices, or an offer of, or solicitation for a transaction in any financial instrument and thus should not be treated as such. The information provided does not involve any specific investment objectives, financial situation and needs of any specific person who may receive it. Please be aware, that past performance is not a reliable indicator of future performance and/or results. Past Performance or Forward-looking scenarios based upon the reasonable beliefs of the third-party provider are not a guarantee of future performance. Actual results may differ materially from those anticipated in forward-looking or past performance statements. IC Markets makes no representation or warranty and assumes no liability as to the accuracy or completeness of the information provided, nor any loss arising from any investment based on a recommendation, forecast or any information supplied by any third-party.
D-XAU

XAU - Its TIME!After all the fall comes a time, Though i have made the chart earlier and cant illustrate where i did but yes thing is commencing soon as stated! marked the drawing what i drew

GOLD Rising Support Ahead! Buy!
Hello,Traders!
GOLD is trading in an uptrend
So despite the price is going
Down now we will be expecting
A strong rebound and a move up
After the price hits the
Rising support below
Buy!
Comment and subscribe to help us grow!
Check out other forecasts below too!
Disclosure: I am part of Trade Nation's Influencer program and receive a monthly fee for using their TradingView charts in my analysis.

Gold Supported by Central Bank Demand Despite Global UncertaintyGold Prices Likely Supported by Central Bank Demand
Gold prices are expected to find continued support from strong central bank buying. Since the start of the Ukraine war, average annual central bank gold purchases have doubled from 500 to 1,000 tons.
The primary drivers remain gold’s role as a crisis hedge, portfolio diversifier, and store of value.
While de-dollarization is not an explicit motivation, many central banks anticipate a gradual decline in the U.S. dollar’s share of global reserves.
Technical Outlook:
Gold remains in bullish territory as long as it trades above 3365. This supports a move toward 3403, and if the price stabilizes above that level, the uptrend may extend toward 3430 and 3448.
A break below 3364 would invalidate the bullish structure and shift momentum downward, with potential targets at 3347 and 3322.
Key Levels:
• Resistance: 3403 / 3430 / 3448
• Support: 3365 / 3347 / 3322

GOLD SUPPORT AHEAD|LONG|
✅GOLD is trading in an uptrend
With the price set to retest
The rising support line
From where I think the growth will continue
LONG🚀
✅Like and subscribe to never miss a new idea!✅
Disclosure: I am part of Trade Nation's Influencer program and receive a monthly fee for using their TradingView charts in my analysis.

Gold Faces Resistance as Israel-Iran Conflict Fails to Fuel RallGold Unlikely to Sustain Long-Term Gains on Israel-Iran Tensions
Despite escalating geopolitical risks, gold’s upside remains limited. Julius Baer's Carsten Menke notes that the recent move is likely driven by short-term speculative and algorithmic flows, not physical safe-haven demand—consistent with historical patterns of brief geopolitical spikes.
Technical Outlook:
Gold is currently trading below 3404, suggesting possible range-bound consolidation between 3404 and 3480.
A 1H close below 3380 could trigger further downside toward 3365 and 3347.
Conversely, a break above 3404 would open the way for a bullish push toward 3448.
Key Levels:
• Pivot: 3381
• Support: / 3365 / 3347 / 3321
• Resistance: 3404/ 3420 / 3448

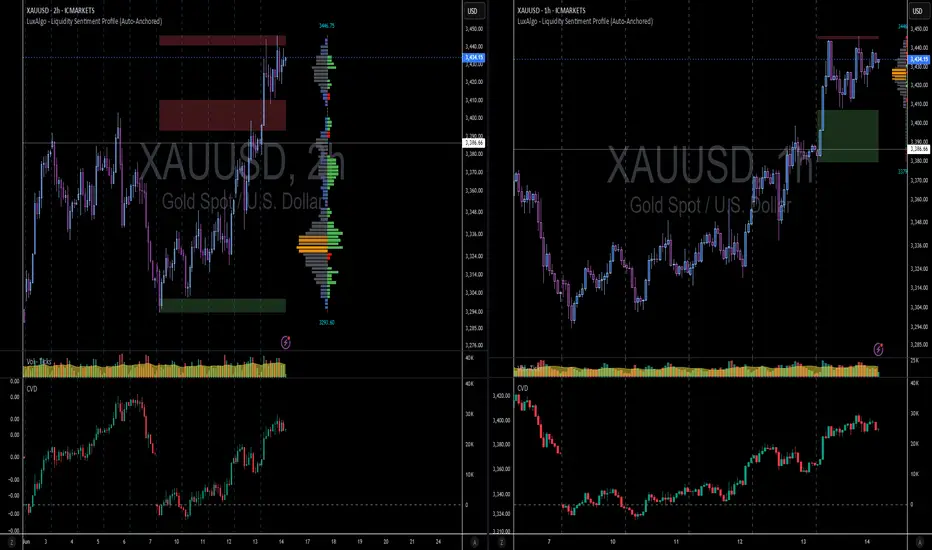
Bullish reversal off 50% Fibonacci support?The Gold (XAU?USD) has bounced off the pivot and could rise to the 1st resistance which acts as a pullback resistance.
Pivot: 3,374.04
1st Support: 3,348.45
1st Resistance: 3,444.62
Risk Warning:
Trading Forex and CFDs carries a high level of risk to your capital and you should only trade with money you can afford to lose. Trading Forex and CFDs may not be suitable for all investors, so please ensure that you fully understand the risks involved and seek independent advice if necessary.
Disclaimer:
The above opinions given constitute general market commentary, and do not constitute the opinion or advice of IC Markets or any form of personal or investment advice.
Any opinions, news, research, analyses, prices, other information, or links to third-party sites contained on this website are provided on an "as-is" basis, are intended only to be informative, is not an advice nor a recommendation, nor research, or a record of our trading prices, or an offer of, or solicitation for a transaction in any financial instrument and thus should not be treated as such. The information provided does not involve any specific investment objectives, financial situation and needs of any specific person who may receive it. Please be aware, that past performance is not a reliable indicator of future performance and/or results. Past Performance or Forward-looking scenarios based upon the reasonable beliefs of the third-party provider are not a guarantee of future performance. Actual results may differ materially from those anticipated in forward-looking or past performance statements. IC Markets makes no representation or warranty and assumes no liability as to the accuracy or completeness of the information provided, nor any loss arising from any investment based on a recommendation, forecast or any information supplied by any third-party.

XAUUSD - Is the gold bullish trend over?!Gold is trading in its ascending channel on the four-hour timeframe, above the EMA200 and EMA50. We should wait for consolidation or not above the drawn trend line to determine the future path of gold, which can be entered after its failure in the formed line, and on the other hand, if gold corrects towards the demand zone, it can be purchased in the short term with appropriate risk-reward.
Over the past week, the gold market moved within a narrow, calm range and showed little reaction to encouraging inflation data—until geopolitical developments once again shifted the landscape. Heightened tensions in the Middle East brought safe-haven demand back to the forefront of traders’ minds.
Following initial reports of regional unrest, gold quickly climbed from $3,324 to a weekly high of $3,377. Although the price saw a brief correction down to around $3,345, it resumed its upward momentum and opened Thursday’s trading session just one dollar below the symbolic $3,400 mark.
Rich Checkan, President and CEO of Asset Strategies International, commented on these recent geopolitical developments, stating: “The market’s direction is clear: it’s upward. With tensions rising following Israel’s attack on Iran, there’s no doubt gold will continue its climb next week.”
Darin Newsom, senior analyst at Barchart.com, also pointed to rising risks both domestically and globally: “Gold is on an upward path. Domestic unrest in the U.S., escalating conflict in the Middle East, broad selling of the U.S. dollar by other countries, and expectations that the Federal Reserve will hold rates steady—all support gold’s rise.”
Meanwhile, Daniel Pavilonis, senior broker at RJO Futures, analyzed the simultaneous reactions of gold and oil amid the recent Middle East tensions, looking for clues on their future direction. He explained: “Oil’s behavior can serve as an indicator for gold, as both are seen as inflation hedges and are sensitive to bond yields.”
Surprised that gold hasn’t yet reclaimed its April highs, Pavilonis emphasized: “If tensions escalate further, we could see additional gains. But if Iran moves toward negotiations or a truce, gold could remain elevated but range-bound, similar to the past two months. Breaking previous highs would require a stronger catalyst and a more significant worsening of the crisis.” He noted that while geopolitical tensions are currently the primary driver of gold’s strength, such rallies are typically short-lived.
Pavilonis added: “We saw a similar pattern last April—gold and oil spiked sharply but quickly corrected. Back then, trade war concerns with China persisted, inflation rates had fallen noticeably, and the initial supportive factors for gold gradually faded. Now, once again, a fresh geopolitical shock has emerged that may temporarily drive gold higher.”
After a week where market attention focused mainly on U.S. inflation data, investors’ focus in the coming days will shift to central bank policy decisions and potential signals regarding the future path of interest rates.
The trading week begins Monday with the release of the Empire State Manufacturing Index, offering an early view of industrial activity in New York. That same day, the Bank of Japan will announce its latest interest rate decision, potentially setting a new tone for Asian markets and the yen’s value.
On Tuesday, U.S. May retail sales data will be published—a key indicator of consumer strength. Signs of weakness could bolster market expectations for a rate cut.
Wednesday will be the pivotal day, as the Federal Reserve reveals its rate decision. While markets have fully priced in a pause in tightening, attention will focus on Jerome Powell’s remarks for any hints of rate cuts in the coming months. Also on Wednesday, May housing starts data and weekly jobless claims will be released.
With U.S. markets closed Thursday for Juneteenth, the spotlight will shift to monetary policy decisions from the Swiss National Bank and the Bank of England, both of which could impact currency market volatility. The week wraps up Friday with the Philadelphia Fed Manufacturing Index, a leading gauge closely watched by traders to assess the health of the manufacturing sector in the U.S. Northeast.

GOLD Eyes New Highs Amid Geopolitical Risk and Bullish StructureGOLD – Safe-Haven Demand Lifts Gold, Eyes on New Highs if Tensions Escalate
Gold futures pared some gains after approaching fresh record highs earlier in the session. The metal rallied strongly on Friday as escalating Middle East tensions — particularly between Israel and Iran — drove investors toward safe-haven assets.
Analysts note that if the conflict intensifies further in the coming days, new highs could be within reach for gold.
Technical Outlook:
A short-term correction toward 3404 or 3390 is likely. However, as long as the price holds above this support zone, the bullish trend is expected to continue toward 3448, with potential to reach 3486.
For a bearish shift, the price must break below the 3391–3381 area with at least a confirmed 1H close, which would open the path toward 3347.
Key Levels:
• Resistance: 3431, 3449, 3486
• Support: 3404, 3391, 3381

Gold Eyes ATH Amid Escalating Geopolitical TensionsGOLD – OVERVIEW
Commodities, particularly gold, are experiencing strong bullish pressure due to escalating tensions between Israel and Iran. With no signs of negotiation or de-escalation, the ongoing conflict continues to fuel safe-haven demand. As long as geopolitical risks remain elevated, bullish momentum in commodities is expected to persist.
Technical Outlook:
Gold maintains a bullish structure as long as it trades above 3404. Holding above this level supports a continuation toward the ATH at 3486, with potential extensions to 3529 and 3560. A retest of the 3404 support remains possible, and an opening gap toward 3486 cannot be ruled out. Overall, the prevailing trend remains upward.
A bearish scenario would only be valid if tensions in the Middle East ease significantly or if negotiations between Israel and Iran begin.
Key Levels:
• Pivot: 3431
• Resistance: 3486, 3529, 3560
• Support: 3404, 3381, 3347

XAUUSD - High possibility of volatile market opening (20250616)Well, it is quite obvious we have a volatile geo-political crisis this weekend, so market may overreact once again to bring Gold to at least 3500 opening.
Looking at volume, though Gold is in uncharted territory and it can be move as high as 3550 - 3600, I rather play for a quick profit.
Hope later this Sunday, we can find some positive news that can at least hold the surge of Gold to minimum.
Trade safe, Trade wisely. Monday will be a very volatile opening.
Gold Testing Daily Resistance – Will the Breakout Hold?Gold is currently testing a major 1D resistance zone at 3432–3450 after a strong bullish move.
• 1D Chart: Price has rallied back into the resistance zone after bouncing from ascending trendline support.
• 4H Chart: Strong momentum candle broke through the prior 4H resistance zone at ~3360, confirming bullish pressure.
• 1H & 23m Chart: Price is holding within a bullish channel, but showing signs of consolidation under key resistance.
Key Zones:
• Support: 3380 / 3360
• Resistance: 3432–3450
Bias: Bullish above 3360. Needs daily close above 3450 for continuation.

Bullislh continuation?The Gold (XAU/USD) is falling towards the pivot which is a pullback support that aligns with the 23.6% Fibonacci retracement and could bounce to the 1st resistance that lines up with the 100% Fibonacci projection.
Pivot: 3,374.04
1st Support: 3,348.45
1st Resistance: 3,414.78
Risk Warning:
Trading Forex and CFDs carries a high level of risk to your capital and you should only trade with money you can afford to lose. Trading Forex and CFDs may not be suitable for all investors, so please ensure that you fully understand the risks involved and seek independent advice if necessary.
Disclaimer:
The above opinions given constitute general market commentary, and do not constitute the opinion or advice of IC Markets or any form of personal or investment advice.
Any opinions, news, research, analyses, prices, other information, or links to third-party sites contained on this website are provided on an "as-is" basis, are intended only to be informative, is not an advice nor a recommendation, nor research, or a record of our trading prices, or an offer of, or solicitation for a transaction in any financial instrument and thus should not be treated as such. The information provided does not involve any specific investment objectives, financial situation and needs of any specific person who may receive it. Please be aware, that past performance is not a reliable indicator of future performance and/or results. Past Performance or Forward-looking scenarios based upon the reasonable beliefs of the third-party provider are not a guarantee of future performance. Actual results may differ materially from those anticipated in forward-looking or past performance statements. IC Markets makes no representation or warranty and assumes no liability as to the accuracy or completeness of the information provided, nor any loss arising from any investment based on a recommendation, forecast or any information supplied by any third-party.

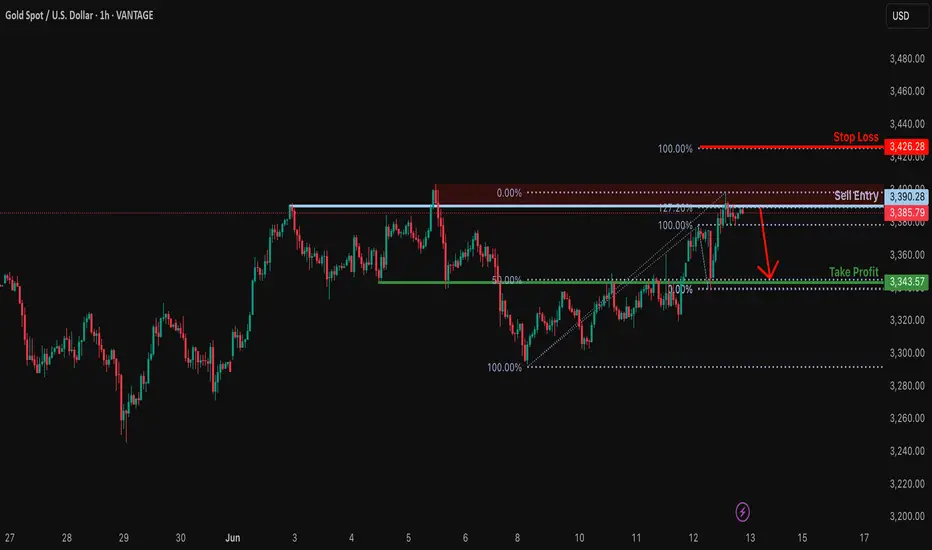
Could the Gold reverse from here?The price is reacting off the resistance level which is a pullback resistance that aligns with the 127.2% Fibonacci extension and could drop from this level to our take profit.
Entry: 3,390.28
Why we like it:
There is a pullback resistance level that lines up with the 127.2% Fibonacci extension.
Stop loss: 3,426.28
Why we like it:
There is a pullback resistance level that lines up with the 100% Fibonacci projection.
Take profit: 3,343.57
Why we like it:
There is an overlap support level that aligns with the 50% Fibonacci retracement.
Enjoying your TradingView experience? Review us!
Please be advised that the information presented on TradingView is provided to Vantage (‘Vantage Global Limited’, ‘we’) by a third-party provider (‘Everest Fortune Group’). Please be reminded that you are solely responsible for the trading decisions on your account. There is a very high degree of risk involved in trading. Any information and/or content is intended entirely for research, educational and informational purposes only and does not constitute investment or consultation advice or investment strategy. The information is not tailored to the investment needs of any specific person and therefore does not involve a consideration of any of the investment objectives, financial situation or needs of any viewer that may receive it. Kindly also note that past performance is not a reliable indicator of future results. Actual results may differ materially from those anticipated in forward-looking or past performance statements. We assume no liability as to the accuracy or completeness of any of the information and/or content provided herein and the Company cannot be held responsible for any omission, mistake nor for any loss or damage including without limitation to any loss of profit which may arise from reliance on any information supplied by Everest Fortune Group.
XAUUSD Video Analysis Brief – Weekly Forecast Summary (2025)This video summarizes the key scenarios and technical outlook for Gold (XAUUSD) on the weekly timeframe, integrating both Fibonacci-based projections and macro fundamentals.
Core Setup
Gold is currently positioned near the 161.8% Fibonacci extension (~$3,276).
A breakout toward $3,500 is possible before a potential corrective move.
Scenario 1: Bullish Continuation
Gold breaks above $3,435 → rallies to $4300 → continues toward major Fibonacci targets:
TP: $4,320, which is the Fibonacci level 261.8%
Scenario 2: Correction First
Gold fails to hold above $3,435 → triggers a healthy correction to:
TP1: $2,920
TP2: $2,650
If support 161.8% level holds in the correction zone, a renewed bullish phase is expected.
Macro Alignment
Central bank gold buying (notably BRICS) supports the long-term bid.
Fed policy leaning dovish → tailwinds for gold.
Inverse correlation with DXY:
DXY below 98.95 → bullish for gold
DXY above 100 → signals correction
Effect on Altcoins
If correction is risk-on driven, capital may rotate into altcoins.
If triggered by macro stress or USD strength, alts may fall alongside gold.
This analysis offers a multi-scenario framework to navigate the next major moves in gold, with key levels to watch for traders, investors, and macro analysts alike.

GOLD | Bullish Momentum Holds Above 3376, Eyes on 3404 and 3431GOLD | OVERVIEW
Gold remains in bullish momentum following the CPI result of 2.4%, which came in below expectations. This increases the likelihood of a rate cut by the Fed, providing strong support for gold.
As long as the price trades above 3376 and 3351, the bullish trend is expected to continue toward 3404. A confirmed stabilization above 3404 could open the path toward 3431.
Bearish Correction till 3376 available.
Pivot: 3376
Resistance Lines: 3404, 3431
Support Lines: 3366, 3347

Bullish bounce for the Gold?The price is reacting off the support level which is a pullback support and could potentially rise from this level to our take profit.
Entry: 3,320.80
Why we like it:
There is a pullback support level.
Stop loss: 3,320.80
Why we like it:
There is a pullback support leve.
Take profit: 3,364.06
Why we like it:
There is an overlap resistance level that aligns with the 61.8% Fibonacci retracement.
Enjoying your TradingView experience? Review us!
Please be advised that the information presented on TradingView is provided to Vantage (‘Vantage Global Limited’, ‘we’) by a third-party provider (‘Everest Fortune Group’). Please be reminded that you are solely responsible for the trading decisions on your account. There is a very high degree of risk involved in trading. Any information and/or content is intended entirely for research, educational and informational purposes only and does not constitute investment or consultation advice or investment strategy. The information is not tailored to the investment needs of any specific person and therefore does not involve a consideration of any of the investment objectives, financial situation or needs of any viewer that may receive it. Kindly also note that past performance is not a reliable indicator of future results. Actual results may differ materially from those anticipated in forward-looking or past performance statements. We assume no liability as to the accuracy or completeness of any of the information and/or content provided herein and the Company cannot be held responsible for any omission, mistake nor for any loss or damage including without limitation to any loss of profit which may arise from reliance on any information supplied by Everest Fortune Group.

GOLD | CPI Data in Focus – Key Levels at 3347 and 3318GOLD | OVERVIEW
Gold remains under pressure due to ongoing U.S.–China trade tensions, with additional focus on the upcoming U.S. CPI data, which is expected to have a strong market impact.
Forecast CPI: 2.5%
Previous CPI: 2.3%
Current Scenario:
If the CPI comes in above 2.5%, it would signal stronger inflation, reducing the likelihood of rate cuts. This would pressure gold lower, continuing the downtrend toward 3318, then 3303, and possibly 3292.
Alternative Scenario:
If CPI is below expectations, it would suggest easing inflation and open the door for rate cuts—supportive for gold. In that case, a break above 3347 could lead to 3366, and then 3375.
Support Levels: 3318, 3303, 3292
Resistance Levels: 3347, 3366, 3375

Gold (XAUUSD) Weekly TF 2025Overview
This analysis outlines the structural Fibonacci confluences, scenario planning, and macro-aligned projections for Gold (XAUUSD) on the weekly timeframe. It integrates multi-layered Fibonacci extensions and retracements, mapping out key support and resistance levels, and proposes a nuanced primary scenario that includes both intermediate rallies and corrective movements.
Primary Scenario – Multi-Stage Movement Hypothesis
We anticipate that gold may initially extend higher from the current level (~$3,325) to test the 127.2% Fibonacci extension at $3,435, with the possibility of a further intermediate peak near $3,500. This level marks a psychological and technical resistance zone and could act as a temporary top.
Following this local peak, a corrective phase may unfold. This pullback could evolve into one of the two outlined correction scenarios:
1 TP Correction Scenario
Support Target: ~$2,950
Basis: 100% Fib extension confluence and prior resistance turned support
Expected Outcome: Price stabilizes at this level and resumes upward momentum
2 TP Correction Scenario
Support Target: ~$2,650
Basis: Strong historical structure + 100% Fib confluence from a broader cycle
Expected Outcome: This zone acts as a long-term demand accumulation area
Upon completion of the corrective structure, we expect gold to reinitiate its primary bullish trend.
Bullish Continuation Targets
TP1: ~$4,050 (161.8% Fibonacci extension)
TP2: ~$4,319 (261.8% Fibonacci extension)
These targets align with macroeconomic conditions, central bank accumulation trends, and long-term structural cycles.
Supporting Technicals
RSI: Holding above 50, indicating preserved bullish momentum
MACD: Positive crossover with widening histogram on weekly timeframe
Price Action: Strong support zone between $3,280–$3,300 aligning with 161.8% Fib retracement of the recent minor wave
Macro Fundamentals & Correlations
Central Bank Gold Demand: Sustained net buying by BRICS nations, particularly China and Russia, supports the structural bid on gold
Fed Policy: Market anticipates a prolonged pause or gradual rate cuts, favoring non-yielding assets like gold
DXY & US10Y Yields: Any further decline in DXY or softening yields would add tailwinds to gold
Crypto Correlation: During inflationary hedging or systemic risk periods, gold and crypto may correlate positively, especially with weakening USD
Intermarket Relationships: Gold, DXY, and TOTAL (Crypto Market Cap)
Gold vs. DXY (US Dollar Index)
Gold historically maintains an inverse correlation with DXY. A rising DXY tends to apply downward pressure on gold prices, while a falling DXY enhances gold's upside momentum.
Scenario Interactions:
If DXY breaks below 98, this could validate the bullish scenario for gold toward $3,435–$4,050.
If DXY rallies back above 100, it could trigger the correction scenarios ($2,950 or $2,650) in gold.
Gold vs. TOTAL (Crypto Market Cap)
Gold and TOTAL may show positive correlation during periods of USD weakening and global liquidity expansion.
Scenario Interactions:
If gold rallies toward $3,500 and TOTAL also breaks key resistance (e.g., $1.8T–$2T), this signals synchronized bullish risk appetite.
If gold corrects while TOTAL continues to rise, it could indicate rotation of liquidity from defensive to risk-on assets.
A simultaneous correction in both may occur if DXY strengthens aggressively or if macro shocks reduce global liquidity.
These intermarket relationships should be monitored continuously to assess the evolving macro context and validate the chosen scenario.
In the case of a gold correction toward $2,950 or $2,650, the impact on altcoins will hinge on the prevailing macroeconomic backdrop. If the correction stems from a healthy, technical rebalancing within a risk-on environment—without a concurrent surge in the U.S. dollar—it could signal a shift in capital from defensive assets like gold into more speculative plays, including altcoins. This type of capital rotation often benefits the crypto market, particularly if TOTAL (crypto market cap) holds or advances structurally. However, if the correction is caused by rising dollar strength, tightening financial conditions, or broader risk-off sentiment, altcoins may instead suffer alongside gold, as liquidity is withdrawn across the board. Therefore, the context and drivers behind gold’s correction are crucial in assessing its downstream effects on altcoin performance.
From a philosophical lens, gold's cyclical ascent and retreat mirrors the rhythm of nature and human experience—expansion, contraction, and renewal. Just as rivers carve valleys before surging toward the ocean, the market too must surrender gains to gather force. A correction in gold is not merely a financial event, but a moment of recalibration—an inhale before the next exhale of momentum. It invites reflection: whether wealth seeks refuge or ventures into risk, whether fear contracts or ambition expands. In this interplay, altcoins may inherit the restless spirit of capital in search of yield, as gold, the ancient anchor of value, briefly pauses in its timeless journey.
Conclusion
We present a multi-phased path for gold where:
An initial bullish breakout toward $3,435–$3,500 forms a short- to mid-term peak
A subsequent correction brings gold to either $2,950 or $2,650, depending on macro triggers
A renewed bull rally drives gold toward $4,050 and potentially $4,319 and beyond
This scenario reflects both the cyclical nature of market structure and the macro-fundamental backing that continues to support long-term gold strength.

GOLD – Bearish Momentum Below 3329 Ahead of US-China TalksFX:XAUUSD – Bearish Momentum Below 3329 Ahead of US-China Talks
Overview:
Gold remains under bearish pressure as markets await the outcome of the upcoming call between U.S. President Trump and China’s President in London. The event is contributing to uncertainty and risk-off sentiment, favoring downside momentum.
Technically, price action remains weak while trading below the pivot level at 3329. A confirmed 1H close below 3311 would likely extend the bearish move toward 3292 and 3275.
On the other hand, a 1H or 15-minute close above 3329 could trigger a bullish correction toward 3347.
A confirmed break above 3347 would shift the trend toward a more sustained uptrend, targeting 3366 and 3404.
Key Levels:
Pivot: 3329
Support: 3311, 3292, 3275
Resistance: 3347, 3366, 3404

Bullish reversal?XAU/USD is falling towards the support level which is an overlap support that lines up with the 23.6% Fibonacci retracement and could bounce from this level to our take profit.
Entry: 3,326.41
Why we like it:
There is an overlap support level that aligns with the 23.6% Fibonacci retracement.
Stop loss: 3,295.18
Why we like it:
There is a pullback support level.
Take profit: 3,364.06
Why we like it:
There is a pullback resistance level that lines up with the 61.8% Fibonacci retracement.
Enjoying your TradingView experience? Review us!
Please be advised that the information presented on TradingView is provided to Vantage (‘Vantage Global Limited’, ‘we’) by a third-party provider (‘Everest Fortune Group’). Please be reminded that you are solely responsible for the trading decisions on your account. There is a very high degree of risk involved in trading. Any information and/or content is intended entirely for research, educational and informational purposes only and does not constitute investment or consultation advice or investment strategy. The information is not tailored to the investment needs of any specific person and therefore does not involve a consideration of any of the investment objectives, financial situation or needs of any viewer that may receive it. Kindly also note that past performance is not a reliable indicator of future results. Actual results may differ materially from those anticipated in forward-looking or past performance statements. We assume no liability as to the accuracy or completeness of any of the information and/or content provided herein and the Company cannot be held responsible for any omission, mistake nor for any loss or damage including without limitation to any loss of profit which may arise from reliance on any information supplied by Everest Fortune Group.

XAUUSD: Weekly overview 9th of JuneHello Traders!
Zone of 3352.0 is only available for long if you consider the middle of the bullish channel, is considerable midline.
**************************************
The indicated levels are determined based on the most reaction points and the assumption of approximately equal distance between the zones.
Some of these points can also be confirmed by the mathematical intervals of Murray.
You can enter with/without confirmation. IF you want to take confirmation you can use LTF analysis, Spike move confirmation, Trend Strength confirmation and ETC.
SL could be placed below the zone or regarding the LTF swings.
TP is the next zone or the nearest moving S&R, which are median and borders of the drawn channels.
*******************************************************************
Role of different zones:
GREEN: Just long trades allowed on them.
RED: Just Short trades allowed on them.
BLUE: both long and short trades allowed on them.
WHITE: No trades allowed on them! just use them as TP points

XAUUSD - Gold awaits NFP!Gold is trading in its ascending channel on the hourly timeframe, between EMA200 and EMA50. We should wait for a valid breakout of the pattern we identified yesterday, from which we had a Fick break above. We can enter the trade after it breaks in the formed pattern, and on the other hand, if gold corrects towards the demand zone, we can buy it in the short term with a reward at an appropriate risk.
Gold came under downward pressure amid renewed optimism regarding U.S.-China trade talks. Although prices surged to a four-week high earlier in the day due to strong demand from Asian and European buyers, a wave of selling during U.S. trading hours reversed part of that gain.
This shift in momentum coincided with rising U.S. Treasury yields and a boost in market sentiment following a phone call between the presidents of China and the United States. While no official statement has been issued yet, the decision to initiate a new round of high-level negotiations was seen as a positive signal. In recent months, gold has become a key indicator for gauging geopolitical and trade-related risks, having previously surged to an all-time high of $3,500 after the “Freedom Day” tariffs were implemented.
Despite ongoing concerns over Ukraine, Iran, and the growing U.S. fiscal deficit—which provide fundamental support for gold—the metal’s inability to break above the key resistance level of $3,437 has cast doubt on the short-term bullish outlook.
Meanwhile, Goldman Sachs has projected that the upcoming U.S. nonfarm payrolls (NFP) report for May will show a 125,000 increase in jobs. The unemployment rate is expected to remain steady at 4.2%, and monthly wage growth is estimated at 0.3%. The bank also anticipates a 10,000-job decline in the public sector, largely due to tariff-related policies and reduced hiring. Overall, Goldman Sachs expects the report to be balanced and free of surprises, which should encourage the Federal Reserve to maintain its current policy stance.
Although gold has managed to stabilize above $3,000 per ounce in recent weeks, many investors remain focused on reclaiming the historic peak reached in April. According to one research firm, it’s only a matter of time before that level is tested and broken again.
In the annual “Gold Focus 2025” report published Thursday by the UK-based firm Metals Focus, analysts stated that gold retains strong momentum for further gains in 2026. They forecast that the average gold price this year could reach an unprecedented $3,210, with new highs likely in the second half of the year.
In an interview with Kitco News, Metals Focus CEO Philip Newman said it is difficult to envision a scenario that would derail the current bull market. While this perspective isn’t included in their formal forecasts, he believes the rally could extend into 2026.
Newman added, “If you look at what’s happening across the global economy, all the ingredients for a structural bull market are present.” He highlighted that one of gold’s unique traits is how quickly investors adapt to new price levels, often converting previous resistance levels into future support. A year ago, he admitted he would have expected $3,000 to trigger widespread profit-taking.
However, despite ongoing economic uncertainty and geopolitical instability, investors have not been discouraged by current price levels. Newman emphasized that what makes 2025 distinct is that new investors are just now entering the market. While gold has been rallying since 2023, much of the demand until recently came from central banks and Asian markets—particularly China.
Newman noted that only in Q4 of last year and early this year did retail investors begin to decisively adopt a bullish stance. “We’ve seen strong growth in investment demand this year,” he said, “but there’s still a large amount of capital that hasn’t entered the market yet. This is not a bubble—this is a well-supported, structurally sound market.”
He concluded by identifying changing perceptions of the U.S. dollar as a major driver behind increased gold investment.While the dollar remains a traditional safe haven, ongoing trade tensions and unsustainable government debt levels have eroded market confidence, prompting investors to seek safety and diversification through gold.
