XAUUSD 16/6/24This week on gold, we are looking at the same range we had last week on the 4-hour chart. We expect prices to either move even lower from the last confirmed low within the range or break this range and push into the area of unmitigated supply above.
Our preferred move is for the price to drop slightly lower, then run higher into the area of supply, and subsequently sell off, following the higher timeframe bias we have for this pair.
A key point to remember is that we might not get a pullback, and the price could actually shift bullish if the last major high is broken. If this is the case, we are looking for a bullish run of the daily highs.
For now, we are bearish, and I expect this to sell off further for the time being.
Follow price action and trade your rules.
D-XAU

!!! GOLD !!! - Ascending Channel Definition (A our B situation?)Hey,
We have two options for the beginning of the week, choose yours (A or B) and leave on the final descending line.
This is just an idea!
Be careful!

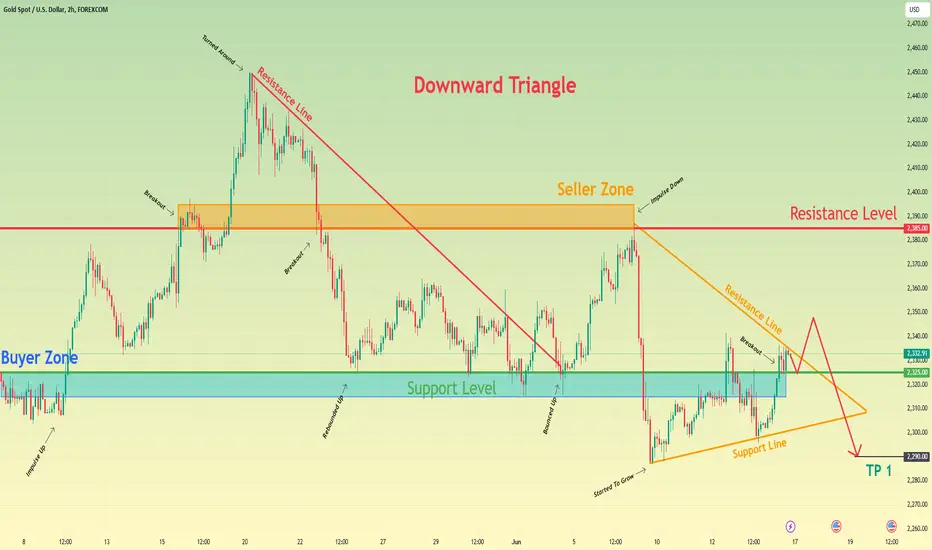
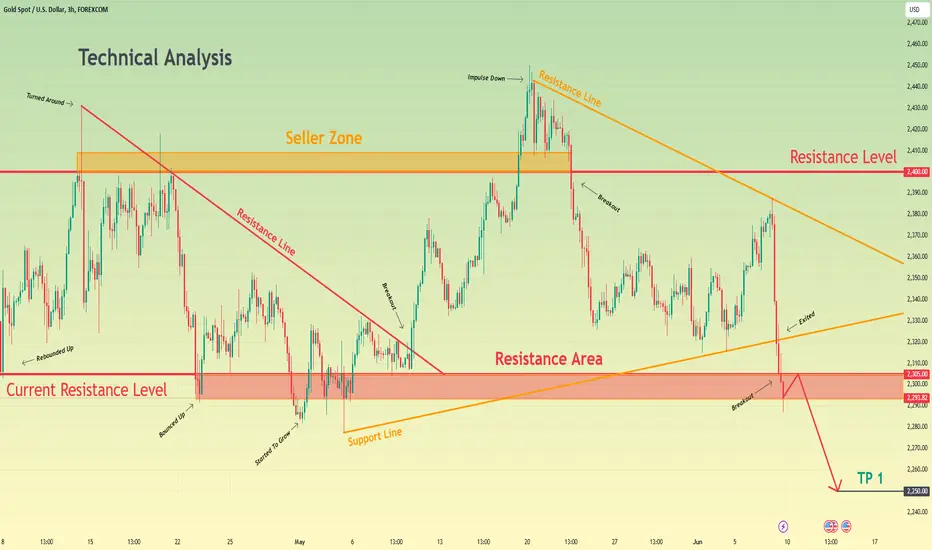
Gold can exit from triangle and then drop lower support levelHello traders, I want share with you my opinion about Gold. Looking at the chart, we can see how the price a not long time ago declined a little lower than the buyer zone, but soon turned around and made a strong impulse up, breaking the 2325 support level. Later price reached a resistance level, which coincided with the seller zone and broke it too, after which made little correction and then continued to grow to the resistance line. When the price reached the resistance line, it turned around and in a short time declined to the support level, breaking the 2385 level one more time. Next, the price some time traded near the support level and later broke the resistance line, after which rose to the resistance level and at once made a downward impulse, lower than the 2325 level, breaking it. Also, Gold started to trades inside the triangle, where it bounced from the support line and quickly reached the support level, broke it, and reached the resistance line of the triangle. To this day, the price continues to trades near the resistance line, so, that's why I think that Gold can exit from the triangle pattern and then make drop lower support level, breaking it. For this case, I set my TP at 2290 points. Please share this idea with your friends and click Boost 🚀
HelenP. I Gold can make small movement up and then rebound downHi folks today I'm prepared for you Gold analytics. Some time ago price reached a resistance level, which coincided with the resistance zone and soon broke it, after which made little correction movement and then continued to grow to the trend line. When the price reached this line, it turned around and started to decline inside the downward channel, where Gold in a short time declined to the support line, breaking the 2385 level, and then started to grow. Later price rose to the resistance level again, but at once rebounded and made an impulse down to the support level, which coincided with the support zone and even fell to this area. Soon, the price turned around and started to grow, thereby making a fake breakout of 2300, after which the price made a correction to the support level and now rising again. For my mind, XAUUSD will make one more movement up and then rebound down to the support zone. That's why I set my goal at 2290 points. If you like my analytics you may support me with your like/comment ❤️

GOLD - last crash, then a new all time high! (buy here)GOLD is probably preparing for a last small crash to the main support of the expanding triangle in the major timeframe. This is a great opportunity to buy GOLD at the bottom of an expanding triangle because it is also in confluence with the 0.382 Fibonacci retracement. This Fibonacci level is very strong together with 0.618 because 0.618 + 0.382 = 1. You can buy gold here, or enter a long position on futures with leverage to increase your potential profit.
You probably know that I am very bullish on GOLD for the next few years and expect at least a double in price. After many years of sideways price action, GOLD finally broke out and made a significant new all time high. GOLD seems undervalued and should go higher.
It's always important to look at the Elliott Wave analysis, as it gives us a better understanding of the whole market structure. Where on the map are we currently? On the chart, you can see an impulse wave (12345) and after such move we can expect a corrective structure, such as ABC or WXY. Usually, you want to take a Fibonacci retracement of the previous impulse wave and look for 0.382 FIB or 0.618 FIB. I don't think GOLD will go all the way down to 2155, that would be pretty bearish after the previous breakout to a new all time high.
Buying gold at current levels is definitely a good idea, but if you want better price and timing, I would take the 0.382 FIB. This will also increase your risk-to-reward ratio.
Let me know what you think about my analysis, and please hit boost and follow for more ideas. Trading is not hard if you have a good coach! Thank you, and I wish you successful trades.

Falling towards pullback support, could it bounce from here?XAU/USD is falling towards a support level which is a pullback support and could potentially bounce from this level to our take profit.
Entry: 2,292.30
Why we like it:
There is a pullback support level.
Stop loss: 2,271.43
Why we like it:
There is a pullback support level that lines up with the 161.8% Fibonacci extension.
Take profit: 2,334.80
Why we like it:
There is a pullback resistance level.
Please be advised that the information presented on TradingView is provided to Vantage (‘Vantage Global Limited’, ‘we’) by a third-party provider (‘Everest Fortune Group’). Please be reminded that you are solely responsible for the trading decisions on your account. There is a very high degree of risk involved in trading. Any information and/or content is intended entirely for research, educational and informational purposes only and does not constitute investment or consultation advice or investment strategy. The information is not tailored to the investment needs of any specific person and therefore does not involve a consideration of any of the investment objectives, financial situation or needs of any viewer that may receive it. Kindly also note that past performance is not a reliable indicator of future results. Actual results may differ materially from those anticipated in forward-looking or past performance statements. We assume no liability as to the accuracy or completeness of any of the information and/or content provided herein and the Company cannot be held responsible for any omission, mistake nor for any loss or damage including without limitation to any loss of profit which may arise from reliance on any information supplied by Everest Fortune Group.

GOLD WILL GROW|LONG|
✅GOLD is set to retest a
Strong support level below at 2280$
After trading in a local downtrend from some time
Which makes a bullish rebound a likely scenario
With the target being a local resistance above at 2320$
LONG🚀
✅Like and subscribe to never miss a new idea!✅

XAUUSD - 15m Sell ScalpOn the 15-minute chart, XAUUSD is breaking below crucial support trendlines, suggesting an increased bearish momentum. The weakening support, indicated by the failure to sustain above these trendlines, points to a potential decline towards lower support levels.
Traders should be cautious as the breakdown may accelerate selling pressure, leading to further downward movement in the gold price.
Monitoring the price action closely around current levels could provide insight into whether the bearish trend will continue or if a short-term consolidation might occur before any recovery attempts.

Gold levels heading into US CPI, FOMCGold managed to rose for a second day after Friday's strong NFP selloff, but bulls clearly lack conviction looking at the small bullish candles on the daily chart. This has allowed a retracement channel to form on the 1-hour chart, which suggests momentum could eventually turn lower.
With US CPI potentially coming in hot and the Fed pushing back on cuts, it could be a game of two halves which could send gold initially higher before rolling over. The weekly pivot point around 2322 and high-volume node / upper 1-day implied volatility band around 2332 make likely targets for bulls, or areas for bears to consider fading into.
Of course, be on guard for explosive volatility around these events, as volatility can cut both ways.

XAUUSD - Gold 4hrSimple trading - Trend breakout
BULLS:
No more bearish liquidity on the intraday timeframes. With new higher highs, Gold may have enough momentum to head towards 2330 and remain above the 2340 price. CPI Report came back negative which may allow gold to maintain above the previous support 2310-15.
BEARS:
Gold has NOT completely rejected the 4-hour HEADS and SHOULDER. This is because gold has broken above the neckline, Yes. But technically this could be the retest we have been waiting for. If the price falls below 2310 and fails to hold above the downtrend bottom channel, expect gold to freefall to the next support area.
*These are just my thoughts, not financial advice.

!!! GOLD !!! - Simple ... "BUY & SELL" !!!Hi,
We have entered a region seen before... it seems to be a good opportunity to follow the indicated trend lines.
Be careful,
This is just an idea!

GOLD - Price can exit of pennant and then break resistance levelHi guys, this is my overview for XAUUSD, feel free to check it and write your feedback in comments👊
Recently price entered to falling channel, where it at once broke $2375 level and fell to support line of channel.
Then price some times tried to rise, but anyway fell back to support line, which coincided with $2320 level.
Later Gold made upward impulse higher than $2375 level, breaking it and exiting from falling channel.
Soon, price turned around and quickly declined lower than $2375 and $2320 levels inside pennant.
Also recently, price turned around and started to grow, so, in my mind, price can exit from pennant and reach resistance level.
After this, Gold can break $2320 resistance level and continue to grow to $2340
If this post is useful to you, you can support me with like/boost and advice in comments❤️

GOLD Local Short! Sell!
Hello,Traders!
GOLD is making a bullish
Rebound from the horizontal
Support of 2285$ just as
We predicted but the price
Will soon hit a horizontal
Resistance level of 2327$
From where a local
Bearish pullback
Will be expected
Sell!
Like, comment and subscribe to help us grow!
Check out other forecasts below too!

XAUUSD, growth to accumulation zone from support.Hi friend. XAUUSD going upper from support (I told about this level like a bears target in my previous idea below). Now we have very powerfull bears distribution without new bears or bulls accumulating. Also there was some bulls distribute. So my opinion upper trend in near time. Follow me;)

Heading into pullback resistance, could it reverse from here?The Gold (XAU/USD) is rising towards the pivot which acts as a pullback resistance and could reverse to the pullback support.
Pivot: 2,319.97
1st Support: 2,286.09
1st Resistance: 2,351.54
Risk Warning:
Trading Forex and CFDs carries a high level of risk to your capital and you should only trade with money you can afford to lose. Trading Forex and CFDs may not be suitable for all investors, so please ensure that you fully understand the risks involved and seek independent advice if necessary.
Disclaimer:
The above opinions given constitute general market commentary, and do not constitute the opinion or advice of IC Markets or any form of personal or investment advice.
Any opinions, news, research, analyses, prices, other information, or links to third-party sites contained on this website are provided on an "as-is" basis, are intended only to be informative, is not an advice nor a recommendation, nor research, or a record of our trading prices, or an offer of, or solicitation for a transaction in any financial instrument and thus should not be treated as such. The information provided does not involve any specific investment objectives, financial situation and needs of any specific person who may receive it. Please be aware, that past performance is not a reliable indicator of future performance and/or results. Past Performance or Forward-looking scenarios based upon the reasonable beliefs of the third-party provider are not a guarantee of future performance. Actual results may differ materially from those anticipated in forward-looking or past performance statements. IC Markets makes no representation or warranty and assumes no liability as to the accuracy or completeness of the information provided, nor any loss arising from any investment based on a recommendation, forecast or any information supplied by any third-party.

GOLD Struggles as Robust NFP Report Boosts USDGold has entered a bearish consolidation phase following the release of a robust Nonfarm Payrolls (NFP) report, which revealed that the US economy created significantly more jobs than anticipated in May. This unexpected job growth has prompted investors to reconsider their expectations for a September interest rate cut by the Federal Reserve (Fed). Consequently, US Treasury bond yields remain elevated, and the US Dollar (USD) has surged to nearly a one-month high, creating a challenging environment for the non-yielding yellow metal.
Market Dynamics
1. Strong NFP Report: The recent NFP report showed substantial job creation, far exceeding market expectations. This has dampened hopes for an imminent rate cut by the Fed, influencing market dynamics significantly.
2. Elevated US Treasury Yields: The strong jobs data has kept US Treasury bond yields high, as investors adjust their portfolios in anticipation of a delayed rate cut.
3. Strengthened USD: The USD's rally to a nearly one-month high further pressures gold prices, as a stronger dollar makes gold more expensive for holders of other currencies.
Technical Analysis
RSI Divergence on H4: Despite the bearish outlook, there is a noticeable divergence in the RSI indicator on the H4 timeframe, suggesting potential for a bullish reversal. This divergence occurs in a significant support area, indicating that a rebound may be on the horizon.
Trading Strategy
Given the current market conditions and technical indicators, our outlook is leaning towards a long position. Here are the key considerations:
- Support Area: The presence of a strong support area and RSI divergence on the H4 chart suggest that the downside may be limited and a recovery could be imminent.
- Risk Management: Traders should implement strict risk management strategies due to the overall bearish sentiment and strong USD. Setting stop-loss orders below the support level is advisable to mitigate potential losses.

XAUUSD (GOLD) falling will continue to 2252Hi friends. Today gold. Very intresting situation on a market now. We have big bearish accumulation zone: 2287 - 2440. And now price will falling to 2252 on my opinion.
Volume analys based on my author indicators. Levels thanks to X-Lines script.

Potential bullish rise?XAU/USD is reacting off a support level which is a pullback support and could rise from this level to our take profit.
Entry: 2,285.63
Why we like it:
There is a pullback support level.
Stop loss: 2,263.13
Why we like it:
There is an overlap support level which lines up with the 161.8% Fibonacci extension.
Take profit: 2,320.23
Why we like it:
There is a pullback resistance level which aligns with the 38.2% Fibonacci retracement.
Please be advised that the information presented on TradingView is provided to Vantage (‘Vantage Global Limited’, ‘we’) by a third-party provider (‘Everest Fortune Group’). Please be reminded that you are solely responsible for the trading decisions on your account. There is a very high degree of risk involved in trading. Any information and/or content is intended entirely for research, educational and informational purposes only and does not constitute investment or consultation advice or investment strategy. The information is not tailored to the investment needs of any specific person and therefore does not involve a consideration of any of the investment objectives, financial situation or needs of any viewer that may receive it. Kindly also note that past performance is not a reliable indicator of future results. Actual results may differ materially from those anticipated in forward-looking or past performance statements. We assume no liability as to the accuracy or completeness of any of the information and/or content provided herein and the Company cannot be held responsible for any omission, mistake nor for any loss or damage including without limitation to any loss of profit which may arise from reliance on any information supplied by Everest Fortune Group.

XAUUSD 9/6/24Second markup of the week of course has to be gold, Are two major pairs looking quite similar this week with a 4 hour breakdown a four hour range that holds no low yet & of course a range created by the NFP.
Our ideas for gold are the following price running down taking out the low we have marked for liquidity this ultimately delivering our four hour low of our range from that point we would expect price to pull back within the bearish range if it is going to continue to sell off!
If we do not take out this low and we form the range of low without liquidating we will still be looking for the pullback to occur, The option that runs parallel to this is price creating the low breaking it shortly after and making a smaller range continuing down without a pullback. As always this is speculative and we are looking for price to deliver this range low before we begin to overpredict what price may or may not do.
We are looking for price to sell off this week if it does not deliver and we shift bullish and we will be aligning with higher time frame narrative but as of now we are clearly bearish on this pair and we are expecting price to align with that as we come into our first sessions of the week.
Very simple outlook look for 4 hour load to form wait for price to pull back and expect new cells to come into the market.
Worst case scenario is the bias is completely incorrect and we see no trade given but as always we will read price action and trade what is being delivered to us.
Wishing you all the best trading week use appropriate risk read price action always use a stop loss.

GOLD Potential Long! Buy!
Hello,Traders!
GOLD is going down
And Gold looks locally
Oversold so after it
Retests the horizontal
Support of 2280$
We will be expecting
A local bullish correction
Buy!
Like, comment and subscribe to help us grow!
Check out other forecasts below too!

Gold can rebound from resistance level and continue to fallHello traders, I want share with you my opinion about Gold. By observing the chart, we can see that the price rebounded up from the current resistance level to the 2400 level, which coincided with the seller zone and even rose higher, but when it reached the resistance line, the price turned around and started to fall. In a short time, the price declined to the resistance area, breaking 2400 and 2305 levels, and some time traded near the resistance area. Later, the price fell lower than the 2305 level again and entered to upward pennant, where it turned around of support line and made a strong impulse up to the resistance line, breaking the 2305 level one more time and also the resistance line with the 2400 level. Soon, the price turned around and in a short time declined from the resistance line of the pennant to the support line, breaking the 2400 level again. After this movement, Gold tried to rise and even reached the resistance line of the pennant, after which it made a strong impulse down, thereby exiting from this pattern and recently broke the 2305 level too. Now, the price trades inside the resistance area, and in my opinion, Gold can rebound from the resistance level and continue to decline, therefore I set my target at 2250 points. Please share this idea with your friends and click Boost 🚀
GOLD LONG FROM SUPPORT|LONG|
✅GOLD will soon retest a key support level of 2280$
So I think that the price will make a rebound
And go up to retest the supply level above at 2303$
LONG🚀
✅Like and subscribe to never miss a new idea!✅

GOLD - Price can turn around and start rise to resistance levelHi guys, this is my overview for XAUUSD, feel free to check it and write your feedback in comments👊
Some time ago price entered to rising channel, where it soon broke $2320 level, which coincided with support area.
Then price continued to grow in channel and later reached $2390 level, which soon broke also and continued move up.
Soon, price left channel and started to decline in pennant, where it broke $2390 level again and fell to support level.
Some time price traded near this level and reached support line of pennant, after which bounced up to resistance line.
But recently, Gold fell back and now trades very close to support line of pennant, so, I think price can little fall.
After this, XAU can turn around and bounce up to $2390 resistance level, exiting from pennant.
If this post is useful to you, you can support me with like/boost and advice in comments❤️
