Bullish momentum to extend?The Gold (XAU/USD) has bounced off the pivot which has been identiifed as a pullback support and xcould rise to the 1st resistance.
Pivot: 3,287.49
1st Support: 3,211.03
1st Resistance: 3,413.48
Risk Warning:
Trading Forex and CFDs carries a high level of risk to your capital and you should only trade with money you can afford to lose. Trading Forex and CFDs may not be suitable for all investors, so please ensure that you fully understand the risks involved and seek independent advice if necessary.
Disclaimer:
The above opinions given constitute general market commentary, and do not constitute the opinion or advice of IC Markets or any form of personal or investment advice.
Any opinions, news, research, analyses, prices, other information, or links to third-party sites contained on this website are provided on an "as-is" basis, are intended only to be informative, is not an advice nor a recommendation, nor research, or a record of our trading prices, or an offer of, or solicitation for a transaction in any financial instrument and thus should not be treated as such. The information provided does not involve any specific investment objectives, financial situation and needs of any specific person who may receive it. Please be aware, that past performance is not a reliable indicator of future performance and/or results. Past Performance or Forward-looking scenarios based upon the reasonable beliefs of the third-party provider are not a guarantee of future performance. Actual results may differ materially from those anticipated in forward-looking or past performance statements. IC Markets makes no representation or warranty and assumes no liability as to the accuracy or completeness of the information provided, nor any loss arising from any investment based on a recommendation, forecast or any information supplied by any third-party.
D-XAU

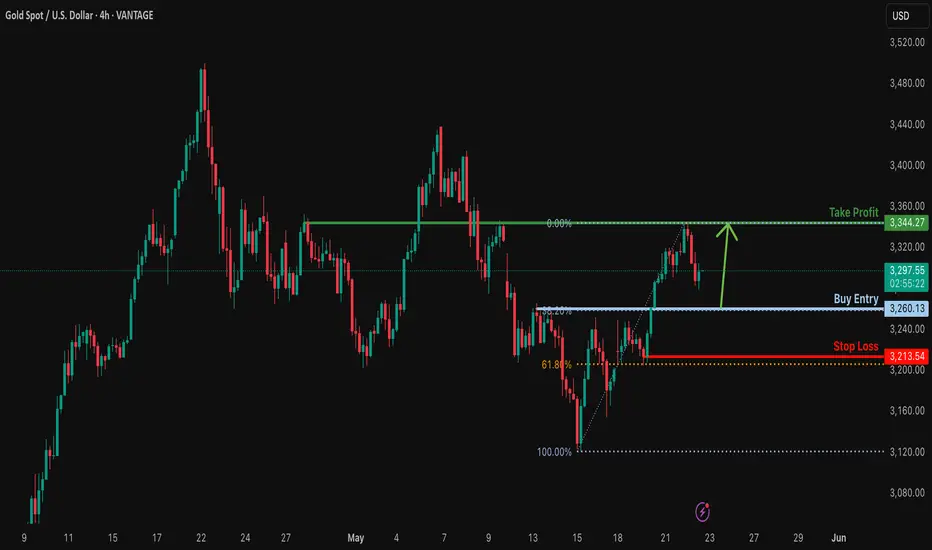
Bullish bounce for the Gold?The price is falling towards the support level which is a pullback support that lines up with the 38.2% Fibonacci retracement and could bounce from this level to our take profit.
Entry: 3,260.13
Why we like it:
There is a pullback support level that lines up with the 38.2% Fibonacci retracement.
Stop loss: 3,213.54
Why we like it:
There is a pullback support level that lines up with the 61.8% Fibonacci retracement.
Take profit: 3,344.27
Why we like it:
There is a pullback resistance level.
Enjoying your TradingView experience? Review us!
Please be advised that the information presented on TradingView is provided to Vantage (‘Vantage Global Limited’, ‘we’) by a third-party provider (‘Everest Fortune Group’). Please be reminded that you are solely responsible for the trading decisions on your account. There is a very high degree of risk involved in trading. Any information and/or content is intended entirely for research, educational and informational purposes only and does not constitute investment or consultation advice or investment strategy. The information is not tailored to the investment needs of any specific person and therefore does not involve a consideration of any of the investment objectives, financial situation or needs of any viewer that may receive it. Kindly also note that past performance is not a reliable indicator of future results. Actual results may differ materially from those anticipated in forward-looking or past performance statements. We assume no liability as to the accuracy or completeness of any of the information and/or content provided herein and the Company cannot be held responsible for any omission, mistake nor for any loss or damage including without limitation to any loss of profit which may arise from reliance on any information supplied by Everest Fortune Group.
GOLD - Price can bounce up from pennant to $3380 pointsHi guys, this is my overview for GOLD, feel free to check it and write your feedback in comments👊
A few moments ago price reached resistance level, but then bounced and started to flat, breaking this level again.
In flat, price declined to support level, which coincided with support area, and then started to grow.
In a short time, Gold exited from flat, breaking $3325 level and then entered to pennant, where it started to fall.
Price soon broke $3325 level again and made a gap, after which dropped to support line of pennant, breaking $3205 level.
But then price quickly turned back, breaking $3205 level again and even reached resistance level, after which corrected.
Now I think that Gold can decline to support line of pennant and then bounce up to $3380, exiting from this pattern.
If this post is useful to you, you can support me with like/boost and advice in comments❤️
Disclaimer: As part of ThinkMarkets’ Influencer Program, I am sponsored to share and publish their charts in my analysis.

Gold Update: 2 optionsIndeed, the top metal surged well beyond $3,000, as I mentioned in my earlier post (see related post for details).
The price reached a new all-time high of $3,510 before pulling back, as expected.
So far, the retracement has been rejected at the trendline support around $3,123 (futures).
From here, there are two possible scenarios:
1) Blue Labels
The price may have already completed wave 4. If so, we could now see a large wave 5 move to the upside.
This wave could reach the blue target box, which represents 61.8% to 100% of the distance from wave 1 to wave 3, added to the bottom of wave 4.
This target zone lies between $3,700 and $4,100.
Keep in mind that gold is a commodity, and commodities often have extended fifth waves — so the higher end of the blue box is still possible.
2) White Labels
Typically, fourth waves retrace down to the valleys of previous lower-degree fourth waves.
In this case, the market could form another leg down to complete a larger, more complex correction, potentially hitting $2,975 before wave 5 begins.
If that happens, the target for wave 5 may be lower, but with a possible extended fifth wave, it could still reach the blue box area.

Bearisdh reversal fro the Gold?The price is rising towards the pivot and could reverse to the 1st support, which acts as a pullback support.
Pivot: 3,358.74
1st Support: 3,257.95
1st Resistance: 3,413.48
Risk Warning:
Trading Forex and CFDs carries a high level of risk to your capital and you should only trade with money you can afford to lose. Trading Forex and CFDs may not be suitable for all investors, so please ensure that you fully understand the risks involved and seek independent advice if necessary.
Disclaimer:
The above opinions given constitute general market commentary, and do not constitute the opinion or advice of IC Markets or any form of personal or investment advice.
Any opinions, news, research, analyses, prices, other information, or links to third-party sites contained on this website are provided on an "as-is" basis, are intended only to be informative, is not an advice nor a recommendation, nor research, or a record of our trading prices, or an offer of, or solicitation for a transaction in any financial instrument and thus should not be treated as such. The information provided does not involve any specific investment objectives, financial situation and needs of any specific person who may receive it. Please be aware, that past performance is not a reliable indicator of future performance and/or results. Past Performance or Forward-looking scenarios based upon the reasonable beliefs of the third-party provider are not a guarantee of future performance. Actual results may differ materially from those anticipated in forward-looking or past performance statements. IC Markets makes no representation or warranty and assumes no liability as to the accuracy or completeness of the information provided, nor any loss arising from any investment based on a recommendation, forecast or any information supplied by any third-party.

Bearish reversal?The Gold (XAU/USD) is rising towards the resistance level which is a pullback resistance that lines up with the 71% Fibonacci retracement and could reverse from this level to our take profit.
Entry: 3,350.88
Why we like it:
There is a pullback resistance level that lines up with the 71% Fibonacci retracement.
Stop loss: 3,411.31
Why we like it:
There is a pullback resistance level.
Take profit: 3,258.51
Why we like it:
There is a pullback support level.
Enjoying your TradingView experience? Review us!
Please be advised that the information presented on TradingView is provided to Vantage (‘Vantage Global Limited’, ‘we’) by a third-party provider (‘Everest Fortune Group’). Please be reminded that you are solely responsible for the trading decisions on your account. There is a very high degree of risk involved in trading. Any information and/or content is intended entirely for research, educational and informational purposes only and does not constitute investment or consultation advice or investment strategy. The information is not tailored to the investment needs of any specific person and therefore does not involve a consideration of any of the investment objectives, financial situation or needs of any viewer that may receive it. Kindly also note that past performance is not a reliable indicator of future results. Actual results may differ materially from those anticipated in forward-looking or past performance statements. We assume no liability as to the accuracy or completeness of any of the information and/or content provided herein and the Company cannot be held responsible for any omission, mistake nor for any loss or damage including without limitation to any loss of profit which may arise from reliance on any information supplied by Everest Fortune Group.

GOLD WILL KEEP GROWING|LONG|
✅GOLD made a strong
Breakout of the key horizontal
Level of 32.60$ and kept on growing
Which reinforces our bullish
Bias and makes us expect
A further bullish move up
LONG🚀
✅Like and subscribe to never miss a new idea!✅
Disclosure: I am part of Trade Nation's Influencer program and receive a monthly fee for using their TradingView charts in my analysis.

4-hour time frame update4-hour time frame update
The first two legs of the market have been correcting/rising as expected. So far, the resistance range is 90 to 25, a large range on the daily and weekly time frame, which, with the strong 4-hour market candlesticks, shows that the correction of the third leg may not proceed as analyzed and will only be a pullback of the upward wave. I am keeping the orders and added a new support area to the chart. In addition, the trend line has been broken... and the fourth leg and the view are still the same, and after the correction, the upward movement will be towards the channel ceiling, and if it is stabilized, the movement will be towards the liquidity of the last ceiling.

GOLD Will Keep Growing! Buy!
Hello,Traders!
GOLD is trading in a strong
Uptrend and the price made
A bullish breakout of the key
Horizontal level around 3255$
And the breakout is confrined
So after a potential local
Pullback we will be expecting
A further bullish continuation
Buy!
Comment and subscribe to help us grow!
Check out other forecasts below too!
Disclosure: I am part of Trade Nation's Influencer program and receive a monthly fee for using their TradingView charts in my analysis.

XAUUSD: The Ultimate Safe Haven Play! FOR THIS WEEK 12/05🏆 XAUUSD (Gold): The Ultimate Safe Haven Play!
📊 Live Market Snapshot (May 12, 2025)
- Current Price: $3,275
- Weekly Range: $3,201 - $3,455
- Key Liquidity Zones:
- Strong Support: $3,140-$3,145 (Best Buy Zone)
- Immediate Resistance: $3,335 (TP1)
- All-Time High: $3,500
💎 Why Gold Matters Now
1. Market Uncertainty: Perfect hedge against volatility
2. Technical Setup: Bouncing from weekly low of $3,201
3. Institutional Demand: Central banks accumulating
🎯 Trading Strategy
- Entry: $3,240-$3,245 zone
- Take Profit Levels:
→ $3,280
→ $3,330
→ $3,355
- Risk Management:
→ Stop Loss: $3,225
⚠️ Critical Notes
1. Watch USD strength (inverse correlation)
2. Monitor Fed policy decisions
3. Physical demand vs. paper gold flows
🔥 Key Indicators
1. Daily RSI: 52 (neutral)
2. 200-DMA: $3,180 (strong support)
3. Volume Profile: Key node at $3,250
📌 The Golden Opportunity
With global tensions rising, gold offers:
- Safe haven protection
- Inflation hedge
- Technical rebound potential
---
📊 DYOR| Not financial advice 🖌️

Bullish momentum to extend?XAU/USD has broken out of the resistance level which is an overlap resistance that lines up with the 50% Fibonacci retracement and could potentially rise from this level to our take profit.
Entry: 3,271.60
Why we like it:
There is an overlap resistance level that lines up with the 50% Fibonacci retracement.
Stop loss: 3,244.65
Why we like it:
There is a pullback support level.
Take profit: 3,350.94
Why we like it:
There is an overlap resistance level that aligns with the 71% Fibonacci retracement.
Enjoying your TradingView experience? Review us!
Please be advised that the information presented on TradingView is provided to Vantage (‘Vantage Global Limited’, ‘we’) by a third-party provider (‘Everest Fortune Group’). Please be reminded that you are solely responsible for the trading decisions on your account. There is a very high degree of risk involved in trading. Any information and/or content is intended entirely for research, educational and informational purposes only and does not constitute investment or consultation advice or investment strategy. The information is not tailored to the investment needs of any specific person and therefore does not involve a consideration of any of the investment objectives, financial situation or needs of any viewer that may receive it. Kindly also note that past performance is not a reliable indicator of future results. Actual results may differ materially from those anticipated in forward-looking or past performance statements. We assume no liability as to the accuracy or completeness of any of the information and/or content provided herein and the Company cannot be held responsible for any omission, mistake nor for any loss or damage including without limitation to any loss of profit which may arise from reliance on any information supplied by Everest Fortune Group.

Very long term gold.Roughly $2900 levels are important support, if it falls below that region, gold may continue its downward trend for the next few years. Afterwards, I think the 5th and final wave may rise.
* The purpose of my graphic drawings is purely educational.
* What i write here is not an investment advice. Please do your own research before investing in any asset.
* Never take my personal opinions as investment advice, you may lose your money.

XAUUSD - Will Gold Reach $3,300?!Gold is trading above the EMA200 and EMA50 on the 1-hour timeframe and is trading in its ascending channel. I expect the path ahead for gold to be bullish, but a downward correction of gold will lead to the creation of buying positions from the bottom of the channel.
Gold faced renewed selling pressure over the past week—an event that not only dragged down its price but also led many analysts and retail investors to temporarily abandon their bullish short-term outlooks. The return of investor appetite for riskier assets has momentarily weakened gold’s appeal as a safe haven.
Meanwhile, the credit rating agency Moody’s has finally acted, downgrading the U.S. sovereign rating from Aaa to Aa1. This marks the first time that even one of the major agencies no longer sees the U.S. as worthy of the highest credit rating. The downgrade was driven by factors such as an annual budget deficit nearing $2 trillion, a debt burden exceeding GDP, and elevated interest rates that have significantly increased the government’s borrowing costs—conditions which, if persistent, could serve as catalysts for gold’s resurgence.
Adrian Day, CEO of Adrian Day Asset Management, stated: “The downward trend continues. We expect prices to decline further in the coming weeks, especially with the potential restructuring of U.S. trade tariffs. That said, once this phase passes, it could set the stage for one of the best buying opportunities.”
Adam Button, Chief Currency Strategist at Forexlive.com, offered a similar outlook, saying: “Current trading sentiment is clearly tilted toward the downside. The market is searching for a new floor, although it seems likely that support will remain above the key $3,000 psychological threshold.”
Following a week full of economic data, the upcoming week’s calendar appears relatively light, with only a handful of reports likely to influence the markets. Early in the week, traders will face a lack of major catalysts, but focus will gradually shift toward Thursday’s releases: weekly jobless claims, the flash PMI from S&P Global, and existing home sales. Additionally, new home sales data on Friday will be one of the few key events of the week.
Alongside these economic updates, the coming days will feature a wave of speeches from Federal Reserve policymakers. Speakers include Jefferson, Williams, Logan, Kashkari, Barkin, Bostic, Collins, Musalem, Kugler, Daly, and Hsu, culminating with a speech from Fed Chair Jerome Powell on Sunday evening.

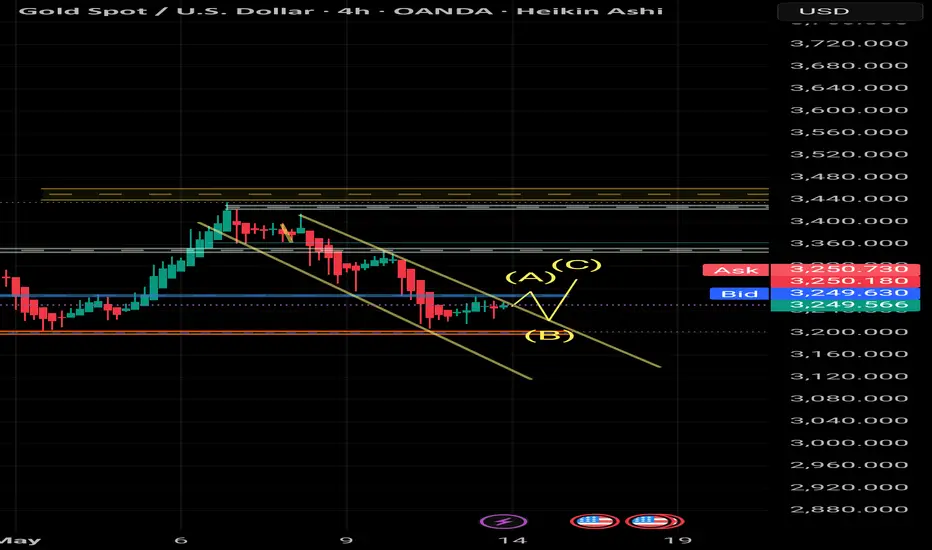
Gold Continues Ultra-Bearish —SHORT\Sell Easy Win, Easy ProfitsWith a lower high confirmed and a classic ABC correction developing, the situation for Gold (XAUUSD) is dismal. The bearish bias is confirmed.
Recently a bounce happened at the 0.382 Fib. retracement level. This is normal and standard but not bullish. The bounce happens because this is a strong support zone, but as soon as the bounce is over the resumption of the bearish move will happen.
What is more relevant here is the lower high and the very strong rejection after the big green session here marked as (B).
The strong green candle produced the highest close ever, the second highest price after the All-Time High. The ATH happened on a wick. In both instances, the market followed up with strong bearish action; that's the signal.
The signal is bearish because each time Gold reached high enough, the bears counteracted with massive selling. Notice the two big red sessions, the last two before the current one.
It is pointing lower. The decreasing volume is an additional and supporting signal for the bearish perspective. This is not a short-term drop, it is a major correction developing. SHORT/sell. Easy win, easy profits.
Namaste.

GOLD Rising Support Ahead! Buy!
Hello,Traders!
GOLD is making a nice bearish
Correction and will soon hit
A rising support line at which point
Gold will be trading at a 10% discount
Giving us a great entry point
To ride the coming bullish wave
Buy!
Comment and subscribe to help us grow!
Check out other forecasts below too!
Disclosure: I am part of Trade Nation's Influencer program and receive a monthly fee for using their TradingView charts in my analysis.

HelenP. I Gold can decline to trend line and then start to growHi folks today I'm prepared for you Gold analytics. If we look at the chart, we can see how the price after several failed attempts holds in a support zone. The structure of this correction has formed beneath the previously broken trend line, and the price is now approaching it from above. What’s important is that buyers previously stepped in around this level, forming a bounce that allowed the market to reach toward the resistance zone near 3350. This area still remains unbroken, making it a magnet for future bullish targets. Currently, price action shows signs of local weakness, but the broader context favors a potential rebound. The confluence between the horizontal support zone and the descending trend line adds extra technical weight to this level. If price can stabilize here, I expect a retest of 3205, and a potential breakout above it could open the way toward my goal at 3260. This scenario assumes continued respect of the trend line as dynamic support. A clean bounce from it would signal renewed bullish interest, especially if backed by momentum on lower timeframes. If you like my analytics you may support me with your like/comment ❤️

XAU/USD - Trendline Breakout (14.05.2025)The XAU/USD pair on the M30 timeframe presents a Potential Buying Opportunity due to a recent Formation of a Breakout Pattern. This suggests a shift in momentum towards the upside and a higher likelihood of further advances in the coming hours.
Possible Long Trade:
Entry: Consider Entering A Long Position around Trendline Of The Pattern.
Target Levels:
1st Resistance – 3321
2nd Resistance – 3364
🎁 Please hit the like button and
🎁 Leave a comment to support for My Post !
Your likes and comments are incredibly motivating and will encourage me to share more analysis with you.
Best Regards, KABHI_TA_TRADING
Thank you.

Gold Strong Crash, Final Warning —Moving Below $2,000XAUUSD (Gold) will move below $3,000 with very strong bearish momentum. You cannot say that you were not warned. It will continue lower to hit a target around $2,750 after $3,000 fails as support.
After the $2,750 target hits, I will look again at the chart and see what it has to say. Below $3,000 is ultra high probability, guaranteed basically. $2,750 is also very high probability that it will hit.
Will it continue lower? At this point it is hard to tell because I don't know Gold's long-term dynamics in a correction, but it isn't looking pretty. If current geopolitical conditions is what's making Gold bearish, then XAUUSD is set for a long-term bear market because everything will continue in the same vein.
That is only if that's the reason why Gold is bearish.
» Looking at the monthly chart, it is a disaster. Gold is set to move below $2,000 in the coming months.
Do you agree?
Disagree?
Leave a comment.
Thank you for reading.
(Remember to follow, and boost...)
Namaste.

Bearish drop?The Gold (XAU/USD) has rejected off the pivot and could drop to the 1st support.
Pivot: 3,263.17
1st Support: 3,156.30
1st Resistance: 3,287.49
Risk Warning:
Trading Forex and CFDs carries a high level of risk to your capital and you should only trade with money you can afford to lose. Trading Forex and CFDs may not be suitable for all investors, so please ensure that you fully understand the risks involved and seek independent advice if necessary.
Disclaimer:
The above opinions given constitute general market commentary, and do not constitute the opinion or advice of IC Markets or any form of personal or investment advice.
Any opinions, news, research, analyses, prices, other information, or links to third-party sites contained on this website are provided on an "as-is" basis, are intended only to be informative, is not an advice nor a recommendation, nor research, or a record of our trading prices, or an offer of, or solicitation for a transaction in any financial instrument and thus should not be treated as such. The information provided does not involve any specific investment objectives, financial situation and needs of any specific person who may receive it. Please be aware, that past performance is not a reliable indicator of future performance and/or results. Past Performance or Forward-looking scenarios based upon the reasonable beliefs of the third-party provider are not a guarantee of future performance. Actual results may differ materially from those anticipated in forward-looking or past performance statements. IC Markets makes no representation or warranty and assumes no liability as to the accuracy or completeness of the information provided, nor any loss arising from any investment based on a recommendation, forecast or any information supplied by any third-party.

Mentioned as last episode Hi guys a few minutes late I was published price action strategy of xau and explained that if Liquidity will surprising us we need to getting a new chart figure.
I show you B plan on this chart .
as starting the trade session at next on houre we can making decisions for how to start our position and how configuration our TP or SL
Bullish bounce off pullback support?XAU/USD has bounced off the support level which is a pullback support and could potentially rise from this level to our take profit.
Entry: 3,202.71
Why we like it:
There is a pullback support level.
Stop loss: 3,151.11
Why we like it:
There is a pullback support level that lines up with the 127.2% Fibonacci extension.
Take profit: 3,344.32
Why we like it:
There is a pullback resistance level that lines up with the 61.8% Fibonacci retracement.
Enjoying your TradingView experience? Review us!
lease be advised that the information presented on TradingView is provided to Vantage (‘Vantage Global Limited’, ‘we’) by a third-party provider (‘Everest Fortune Group’). Please be reminded that you are solely responsible for the trading decisions on your account. There is a very high degree of risk involved in trading. Any information and/or content is intended entirely for research, educational and informational purposes only and does not constitute investment or consultation advice or investment strategy. The information is not tailored to the investment needs of any specific person and therefore does not involve a consideration of any of the investment objectives, financial situation or needs of any viewer that may receive it. Kindly also note that past performance is not a reliable indicator of future results. Actual results may differ materially from those anticipated in forward-looking or past performance statements. We assume no liability as to the accuracy or completeness of any of the information and/or content provided herein and the Company cannot be held responsible for any omission, mistake nor for any loss or damage including without limitation to any loss of profit which may arise from reliance on any information supplied by Everest Fortune Group.

XAU/USD – Things are waiting I’ve been quietly tracking XAU/USD, and something’s been standing out: no new high, no conviction, and no clear follow-through. That’s not weakness — that’s bait. It’s the kind of setup that shakes out the impulsive traders... right before the real move begins.
I’m not interested in chasing this range. The real opportunity — the one that matters — sits lower.
There’s only 2 zones I’m watching: the blue boxes.
That’s where I’ll position. That’s where the real story unfolds.
The market has been hovering just above a liquidity pocket, and I wouldn’t be surprised to see a fast sweep, a volume spike, or even a CDV divergence down there. I want to see a reaction — not just a touch. A reclaim. A shift in control. That’s when I act.
This zone isn’t random. It’s built on order flow and inefficiency — where price previously moved too fast, leaving imbalances behind. If we return there with intent, the bounce could be aggressive.
“I will not insist on my short idea. If the levels suddenly break upwards and do not give a downward break in the low time frame, I will not evaluate it. If they break upwards with volume and give a retest, I will look long.”
That applies here too. If we never reach the blue box, or if the move back into it lacks confirmation — I don’t touch it. No signal, no entry. That simple.
🧠 If you ignore this zone and price rockets without you — that’s fine. But if it hits the blue box cleanly and you hesitate, that’s on you.
As someone who’s watched this pattern unfold more times than I can count… this is where smart money loads, not where it exits.
Let’s see if we get the dip. If we do, and it reacts the way I expect — this could be the move.
📌I keep my charts clean and simple because I believe clarity leads to better decisions.
📌My approach is built on years of experience and a solid track record. I don’t claim to know it all but I’m confident in my ability to spot high-probability setups.
📌If you would like to learn how to use the heatmap, cumulative volume delta and volume footprint techniques that I use below to determine very accurate demand regions, you can send me a private message. I help anyone who wants it completely free of charge.
🔑I have a long list of my proven technique below:
🎯 ZENUSDT.P: Patience & Profitability | %230 Reaction from the Sniper Entry
🐶 DOGEUSDT.P: Next Move
🎨 RENDERUSDT.P: Opportunity of the Month
💎 ETHUSDT.P: Where to Retrace
🟢 BNBUSDT.P: Potential Surge
📊 BTC Dominance: Reaction Zone
🌊 WAVESUSDT.P: Demand Zone Potential
🟣 UNIUSDT.P: Long-Term Trade
🔵 XRPUSDT.P: Entry Zones
🔗 LINKUSDT.P: Follow The River
📈 BTCUSDT.P: Two Key Demand Zones
🟩 POLUSDT: Bullish Momentum
🌟 PENDLEUSDT.P: Where Opportunity Meets Precision
🔥 BTCUSDT.P: Liquidation of Highly Leveraged Longs
🌊 SOLUSDT.P: SOL's Dip - Your Opportunity
🐸 1000PEPEUSDT.P: Prime Bounce Zone Unlocked
🚀 ETHUSDT.P: Set to Explode - Don't Miss This Game Changer
🤖 IQUSDT: Smart Plan
⚡️ PONDUSDT: A Trade Not Taken Is Better Than a Losing One
💼 STMXUSDT: 2 Buying Areas
🐢 TURBOUSDT: Buy Zones and Buyer Presence
🌍 ICPUSDT.P: Massive Upside Potential | Check the Trade Update For Seeing Results
🟠 IDEXUSDT: Spot Buy Area | %26 Profit if You Trade with MSB
📌 USUALUSDT: Buyers Are Active + %70 Profit in Total
🌟 FORTHUSDT: Sniper Entry +%26 Reaction
🐳 QKCUSDT: Sniper Entry +%57 Reaction
📊 BTC.D: Retest of Key Area Highly Likely
📊 XNOUSDT %80 Reaction with a Simple Blue Box!
📊 BELUSDT Amazing %120 Reaction!
📊 Simple Red Box, Extraordinary Results
I stopped adding to the list because it's kinda tiring to add 5-10 charts in every move but you can check my profile and see that it goes on..

GOLD Great Buying Opportunity! Long!
Hello,Traders!
GOLD is making a nice
Bearish correction but we
Are bullish biased so as the
Price is about to hit a support
Cluster of the rising and
Horizontal support lines
Around 3171$ area we will
Be looking to enter a
Swing long trade on Gold
Buy!
Comment and subscribe to help us grow!
Check out other forecasts below too!
Disclosure: I am part of Trade Nation's Influencer program and receive a monthly fee for using their TradingView charts in my analysis.
