GOLD LONG SIGNAL|
✅GOLD went down sharply
And hit a horizontal support
Area around 3206$ from where
We will be expecting a local
Rebound therefore we can
Enter a long trade with the
TP of 3266$ and the SL of 3191$
LONG🚀
✅Like and subscribe to never miss a new idea!✅
Disclosure: I am part of Trade Nation's Influencer program and receive a monthly fee for using their TradingView charts in my analysis.
D-XAU

XAUUSD - Is Gold Going Down?!Gold is trading in its descending channel on the four-hour timeframe, between the EMA200 and EMA50. A downward correction in gold will open up buying opportunities from the demand areas.
Investors in the precious metals market witnessed another week of gold’s strong performance. Although overall optimism about a potential reduction in trade tariffs slightly slowed gold’s momentum, robust demand from Asia and other global regions provided solid support, preventing any major market correction.
At the beginning of the week, gold prices fell by over 1% on Monday as news of a trade agreement between the U.S. and China prompted investors to shift toward riskier assets. This drop occurred alongside easing geopolitical tensions between India and Pakistan, which also contributed to a calmer market atmosphere.
U.S. Treasury Secretary Scott Bessent and Trade Representative Jamison Greer announced that the two nations had reached an agreement during negotiations in Geneva, Switzerland. The deal, which is expected to be released as a joint statement, signals a reduction in trade tensions that had escalated in recent weeks with tariffs reaching as high as 145% on Chinese imports.
As part of the agreement, the U.S. and China plan to establish a joint economic and trade consultation mechanism to continue discussions on tariffs. President Donald Trump hinted last week at a potential reduction in tariffs to 80%, although the official details of the deal have yet to be disclosed.
Adam Button, Chief Currency Strategist at Forexlive.com, commented that in the current market environment, it is difficult not to be bullish on gold. However, he warned that any de-escalation in U.S.-China tensions could dampen the strength of gold’s rally. He added, “Even though a 50% reduction in tariffs wouldn’t be the final chapter, if implemented, it would represent fairly rapid progress and a positive sign for both parties.”
In addition to trade developments, the easing of tensions in Kashmir and a ceasefire agreement between India and Pakistan have also reduced demand for safe-haven assets like gold. The ceasefire, brokered by the United States, remained largely intact over the weekend.
Adrian Day, CEO of Adrian Day Asset Management, stated that his outlook on gold remains unchanged. He explained, “Rising concerns over a potential U.S. recession, coupled with cautious optimism about easing trade tensions—especially between Washington and Beijing—could exert pressure on gold. However, gold’s notable resilience against price declines indicates underlying demand that has not yet fully entered the market.”
Meanwhile, Darin Newsom, Senior Market Analyst at Barchart.com, firmly maintained a bullish view on precious metals. He said, “If I had to write one analytical sentence on the market board, it would be: Precious metals must rally. I emphasize ‘must’ because nothing is certain in the markets. My bearish call last week was wrong, and it’s clear that technical analysis has become almost obsolete—especially in today’s world where algorithm-driven trading dominates.”
After a week largely influenced by the Federal Reserve’s meeting and tariff-related headlines, market focus now shifts to a data-heavy week featuring a broad range of U.S. economic indicators. The action kicks off Tuesday with the release of the April Consumer Price Index (CPI), a report that could offer insights into whether the Fed might cut interest rates in its June meeting.
The real highlight, however, is expected on Thursday, when key reports are scheduled to be published, including the Producer Price Index (PPI), retail sales figures, jobless claims data, and two major regional indices—the Philadelphia Fed manufacturing survey and the Empire State manufacturing index. Amidst this flood of information, Fed Chair Jerome Powell is also set to deliver a speech in Washington, which could serve as a major catalyst for market movement.
To wrap up the week, markets await Friday’s release of the preliminary University of Michigan Consumer Sentiment Index for May—a report often viewed as a psychological gauge of American consumer behavior.

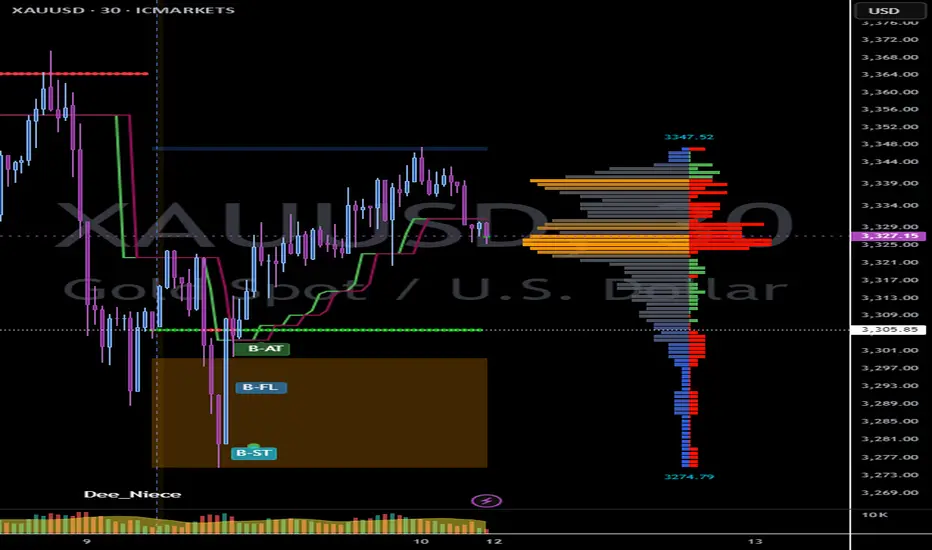
A little bit of tiny help that offer great resultsprnt.sc
As always I based my charting on trend following method, but knowing where the exhaustion is crucial in helping when to take profit or make a sniper entry.
As I always rely on periodic Volume Profile, recently I switch to using Luxalgo Liquidity and Sentiment Profile. For timeframe 30 mins and lower, I used the fixed range with a total of bars per timeframe as my range. For 1 hour and 2h, I will used the weekly setup.
So far it brings great combination results. Check above link for my current open trade.
GOLD Free Signal! Sell!
Hello,Traders!
GOLD made a retest of
The local horizontal resistance
Of 3348$ and is alreaady
Making a local pullback
So despite our long-term
Bullish bias we will go short
With the Take Profit of 3297$
And the Stop Loss of 3372$
Sell!
Comment and subscribe to help us grow!
Check out other forecasts below too!
Disclosure: I am part of Trade Nation's Influencer program and receive a monthly fee for using their TradingView charts in my analysis.

GOLD RISKY SHORT|
✅GOLD keeps growing
While trading in an uptrend
So we are bullish biased long-term
But the price is about to retest
A local horizontal resistance
Of 3370$ from where we will
Be expecting a local pullback
But we advise you to use low
Risk because it is
A counter-trend trade
SHORT🔥
✅Like and subscribe to never miss a new idea!✅
Disclosure: I am part of Trade Nation's Influencer program and receive a monthly fee for using their TradingView charts in my analysis.

Bearish reversal?The Gold (ZAU/USD) is reacting off the pivot and could drop to the 1st support.
Pivot: 3,328.69
1st Support: 3,271.11
1st Resistance: 3,359.66
Risk Warning:
Trading Forex and CFDs carries a high level of risk to your capital and you should only trade with money you can afford to lose. Trading Forex and CFDs may not be suitable for all investors, so please ensure that you fully understand the risks involved and seek independent advice if necessary.
Disclaimer:
The above opinions given constitute general market commentary, and do not constitute the opinion or advice of IC Markets or any form of personal or investment advice.
Any opinions, news, research, analyses, prices, other information, or links to third-party sites contained on this website are provided on an "as-is" basis, are intended only to be informative, is not an advice nor a recommendation, nor research, or a record of our trading prices, or an offer of, or solicitation for a transaction in any financial instrument and thus should not be treated as such. The information provided does not involve any specific investment objectives, financial situation and needs of any specific person who may receive it. Please be aware, that past performance is not a reliable indicator of future performance and/or results. Past Performance or Forward-looking scenarios based upon the reasonable beliefs of the third-party provider are not a guarantee of future performance. Actual results may differ materially from those anticipated in forward-looking or past performance statements. IC Markets makes no representation or warranty and assumes no liability as to the accuracy or completeness of the information provided, nor any loss arising from any investment based on a recommendation, forecast or any information supplied by any third-party.

XAU/USD - Fed warns of Economic UncertaintyThe XAU/USD pair on the M30 timeframe presents a Potential Buying Opportunity due to a recent Formation of a Bullish Flag Pattern. This suggests a shift in momentum towards the upside and a higher likelihood of further advances in the coming hours.
Possible Long Trade:
Entry: Consider Entering A Long Position around Trendline Of The Pattern.
Target Levels:
1st Resistance – 3473
2nd Resistance – 3519
🎁 Please hit the like button and
🎁 Leave a comment to support for My Post !
Your likes and comments are incredibly motivating and will encourage me to share more analysis with you.
Best Regards, KABHI_TA_TRADING
Thank you.

GOLD WILL GROW FURTHER|LONG|
✅GOLD is trading in a strong
Uptrend so we are bullish
Biased and the price already
Made a bullish rebound from
The horizontal support
Around 3360$ so we will
Be expecting Gold to
To go further up
LONG🚀
✅Like and subscribe to never miss a new idea!✅
Disclosure: I am part of Trade Nation's Influencer program and receive a monthly fee for using their TradingView charts in my analysis.

HelenP. I Gold will drop to trend line, breaking support levelHi folks today I'm prepared for you Gold analytics. Looking at the chart, we can see how the price has recently formed a narrowing wedge structure after a strong impulsive rally. The price reached a significant peak and then started consolidating, forming lower highs with fading bullish pressure. What we now see is a classic sign of price compression within a pennant pattern. Currently, the market is testing the key resistance zone between 3360 - 3380 points. This area aligns with the upper boundary of the wedge, and the price has already reacted to it multiple times. Buyers were unable to break through convincingly, indicating a potential exhaustion of momentum. Meanwhile, the lower boundary is represented by a dynamic trend line. Given this structure, I expect Gold can decline toward the support trend line and possibly reach 3300 points, my goal. The combination of horizontal resistance, trend weakening, and pattern tightening supports a short bias. Given the recent lower high, the rejection near resistance, and the wedge formation, I remain bearish and anticipate further decline. If you like my analytics you may support me with your like/comment ❤️

Gold Trend Analysis – Potential Movement ForecastThe recent price action suggests a potential turning point in gold’s trend. While the market has maintained an ascending trajectory , the latest pullback introduces a level of caution. The structure remains intact within the trend channel , but the rejection near resistance indicates that bullish momentum may be cooling off.
Key price zones such as 3800.796, 3549.659, and 3238.064 will be decisive in determining the next movement. If buyers defend these levels, a rebound towards higher resistance is likely. However, a break below support could accelerate a deeper correction.
Market sentiment currently leans towards buy-side accumulation , as marked across the chart, yet a confirmation signal from price behavior is required before engaging further in longs. Managing risk effectively in these conditions will be crucial to navigate the upcoming price movements.

GOLD Risky Long! Buy!
Hello,Traders!
GOLD is trading in an uptrend
So despite a local correction
We are bullish biased and
As we are already seeing
A bullish rebound from the
Local horizontal support
Of 3360$ a further
Bullish move up is
To be expected
Buy!
Comment and subscribe to help us grow!
Check out other forecasts below too!
Disclosure: I am part of Trade Nation's Influencer program and receive a monthly fee for using their TradingView charts in my analysis.

Falling towards pullback support?The Gold (XAU/USD) is falling towards the pivot and could bounce to he 1st resistance which has been identified as a pullback resistance.
Pivot: 3,361.29
1st Support: 3,310.00
1st Resistance: 3,490.34
Risk Warning:
Trading Forex and CFDs carries a high level of risk to your capital and you should only trade with money you can afford to lose. Trading Forex and CFDs may not be suitable for all investors, so please ensure that you fully understand the risks involved and seek independent advice if necessary.
Disclaimer:
The above opinions given constitute general market commentary, and do not constitute the opinion or advice of IC Markets or any form of personal or investment advice.
Any opinions, news, research, analyses, prices, other information, or links to third-party sites contained on this website are provided on an "as-is" basis, are intended only to be informative, is not an advice nor a recommendation, nor research, or a record of our trading prices, or an offer of, or solicitation for a transaction in any financial instrument and thus should not be treated as such. The information provided does not involve any specific investment objectives, financial situation and needs of any specific person who may receive it. Please be aware, that past performance is not a reliable indicator of future performance and/or results. Past Performance or Forward-looking scenarios based upon the reasonable beliefs of the third-party provider are not a guarantee of future performance. Actual results may differ materially from those anticipated in forward-looking or past performance statements. IC Markets makes no representation or warranty and assumes no liability as to the accuracy or completeness of the information provided, nor any loss arising from any investment based on a recommendation, forecast or any information supplied by any third-party.

Gold: The Start Of The C Wave (Extreme Danger!)After the FED announces their business Gold (XAUUSD) is likely to crash-down and hard.
I will support my statement with data coming from this chart.
The crash doesn't necessarily need to happen instantly. My idea is that we are witnessing a classic ABC correction in Elliott Wave Theory terminology. Let's dive in.
» Trading volume peaked in early April and has been dropping considerably.
» The ATH session ended as a very strong bearish (reversal) signal.
» There is a strong bearish divergence with the RSI. The RSI peaked February 2025 while Gold (XAU) peaked recently. Here is the chart:
Currently, Gold is showing a bounce until the resumption of the corrective bearish move.
Gold is set to move lower based on my interpretation of this chart. Approach with caution, or, go SHORT. You can't go wrong by shorting the top/resistance. Sell at resistance, buy at support.
Namaste.

HelenP. I Gold can rebound from trend line to resistance levelHi folks today I'm prepared for you Gold analytics. After forming a local bottom around the 3190 - 3210 support zone, the price has rebounded and is now testing the upward trend line once again. This level has consistently acted as dynamic support throughout the recent bullish structure, confirming its relevance and strength. Buyers have shown clear interest in defending this area, and the reaction near this level further strengthens the bullish sentiment. Notably, the market is recovering from a correction phase that followed the previous local peak near the 3350 - 3370 resistance zone. Price has moved within a wide range, creating opportunities for both accumulation and further upside. The chart also shows how Gold is forming a higher low, which supports the continuation of the current trend. If the trend line continues to hold, I expect the price to move toward the resistance area, with my goal located at 3350 points - the key breakout level. Given the price reaction, support structure, and trend confirmation, I remain bullish. If you like my analytics you may support me with your like/comment ❤️

BITCOIN/GOLD BITCOIN/GOLD 🌊
Physical gold vs. Digital gold
2010: 1 BTC 0.0001 GOLD
2025: 1 BTC 27.9 GOLD

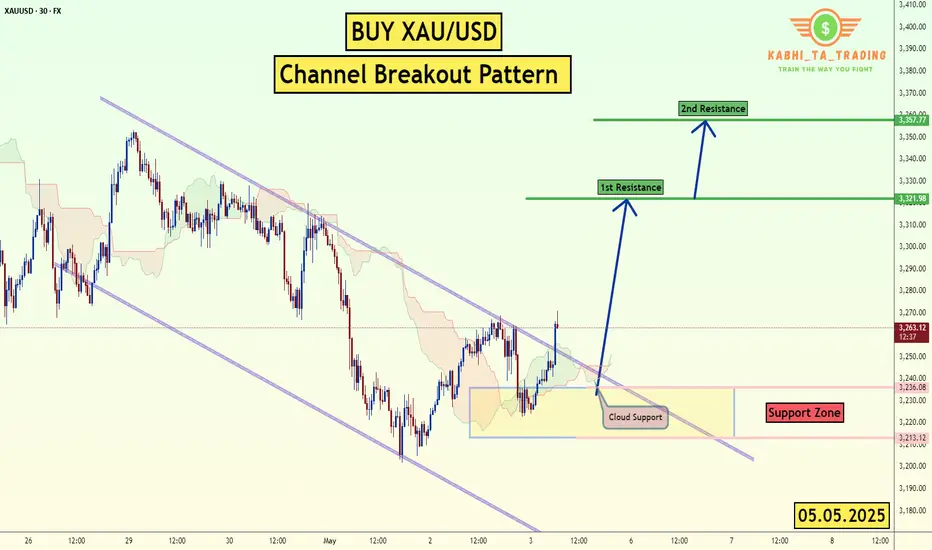
XAU/USD - Channel Breakout (05.05.2025)The XAU/USD pair on the M30 timeframe presents a Potential Buying Opportunity due to a recent Formation of a Channel Breakout Pattern. This suggests a shift in momentum towards the upside and a higher likelihood of further advances in the coming hours.
Possible Long Trade:
Entry: Consider Entering A Long Position around Trendline Of The Pattern.
Target Levels:
1st Resistance – 3321
2nd Resistance – 3357
🎁 Please hit the like button and
🎁 Leave a comment to support for My Post !
Your likes and comments are incredibly motivating and will encourage me to share more analysis with you.
Best Regards, KABHI_TA_TRADING
Thank you.
XAUUSD - Gold Trend Before FOMC!Gold is trading above its EMA200 and EMA50 on the 4-hour timeframe and is trading on its uptrend line. A continued upward move in gold will put it in the supply zone, where it is possible to look for short positions. A downward correction in gold will also open up long positions.
Gold traders endured another turbulent week, marked by the second consecutive decline in prices—once again underscoring the market’s acute sensitivity to economic news and developments.
Adrian Day, CEO of Adrian Day Asset Management, offered a cautiously humorous take on the situation by likening it to the Peggy Lee song that asks, “Is that all there is?” He pointed out that gold has pulled back by over 7% from its recent high in less than two weeks.Although this correction is notable, it hasn’t been deep enough to flush out all short-term traders or weak-handed investors from the market.
Day added that rising fears of a U.S. recession—which typically exert early downward pressure on gold—alongside the possibility of easing U.S.-China trade tensions, may limit investment demand for gold in the short term. Concluding his comments, he maintained a cautious stance, saying that further downside remains likely and that his outlook for the coming week is bearish.
Meanwhile, U.S. President Donald Trump, in a new interview with NBC, addressed several key economic and political issues. He stated that if necessary, the deadline for selling TikTok would be extended, and some tariffs on Chinese goods might become permanent. Nevertheless, he indicated that he is also considering reducing certain tariffs in the future.
Trump emphasized that small businesses do not require additional assistance and that the Federal Reserve should cut interest rates. He confirmed that Jerome Powell will remain Fed Chair through the end of his term in 2026. He also mentioned potential successors for his own position, naming Vance and Rubio as possibilities.
After a week dominated by employment data, the upcoming week will be entirely focused on monetary policy. The centerpiece will be the May FOMC meeting, the Fed’s rate decision, and Jerome Powell’s press conference on Wednesday. While markets broadly expect the Fed to hold rates steady, Powell’s official remarks and answers to press questions—especially following his sharp tone earlier in April—will be under close scrutiny.
It is widely expected that the Federal Reserve will leave its key interest rate unchanged on Wednesday, as policymakers assess how President Trump’s tariffs gradually impact various sectors of the economy. Markets are currently pricing in a potential rate cut starting in July. The Fed’s dual mandate is to maintain low inflation and high employment, and it may face a dilemma if tariffs negatively affect both indicators, as many economists now warn.
Immediately following the Fed meeting, senior policymakers including Barr, Kugler, Waller, and Cook will travel to Iceland to attend the Reykjavik Economic Conference. On Friday, they will participate in panels discussing artificial intelligence, labor market trends, and monetary research—topics that could offer insights into the Fed’s long-term policy direction.
Simultaneously, traders are also awaiting two key reports: the ISM Services Index for May, due today, and weekly jobless claims figures set for release on Thursday. Together, these reports will help complete the picture of the U.S. economy as critical monetary policy decisions approach.

Gold Chart And Factor Of 3Price changes with a factor of 3 and its reaction to support and resistance levels.
3% , 6% , 9% , 12% , 15% , 18% ...

Bullish continuation?The Gold (XAU/USD) is falling towards the pivot which lines up with the 61.8% Fibonacci support and could bounce to the 1st resistance which acts as a pullback resistance.
Pivot: 3,148.98
1st Support: 3,051.82
1st Resistance: 3,430.57
Risk Warning:
Trading Forex and CFDs carries a high level of risk to your capital and you should only trade with money you can afford to lose. Trading Forex and CFDs may not be suitable for all investors, so please ensure that you fully understand the risks involved and seek independent advice if necessary.
Disclaimer:
The above opinions given constitute general market commentary, and do not constitute the opinion or advice of IC Markets or any form of personal or investment advice.
Any opinions, news, research, analyses, prices, other information, or links to third-party sites contained on this website are provided on an "as-is" basis, are intended only to be informative, is not an advice nor a recommendation, nor research, or a record of our trading prices, or an offer of, or solicitation for a transaction in any financial instrument and thus should not be treated as such. The information provided does not involve any specific investment objectives, financial situation and needs of any specific person who may receive it. Please be aware, that past performance is not a reliable indicator of future performance and/or results. Past Performance or Forward-looking scenarios based upon the reasonable beliefs of the third-party provider are not a guarantee of future performance. Actual results may differ materially from those anticipated in forward-looking or past performance statements. IC Markets makes no representation or warranty and assumes no liability as to the accuracy or completeness of the information provided, nor any loss arising from any investment based on a recommendation, forecast or any information supplied by any third-party.

XAU / GOLD🌟 GOLD: THE BIGGEST TRADE OF SUMMER 2025
XAU/USD Forecast
📈 PHASE 1: SHORT-TERM RALLY (after small correction to 3172$)
We expect a bounce toward the $3,789–$3,800 resistance zone.
🔴 PHASE 2: THE SHAKEOUT
May 27 SELL ZONE.
After May 27, the cycle flips.
Expect a violent correction, retracing into key support around $2,880–$2,970 or even lower.
🟢 PHASE 3: THE BUY ZONE — July 13 +/- few days.
Mid-July marks the ideal long-term entry into TVC:GOLD before the explosive move.
🚀 PHASE 4: THE BREAKOUT
Target: ATH above $4,000 by late summer
Yes, EUROTLX:4K + gold is coming — but only after the market resets.

GOLD WILL GO DOWN|SHORT|
✅GOLD is going down now
After a breakout a retest
A and a pullback from the
Key horizontal level
Of 3280$ so we are bearish
Biased and we will be expecting
A further bearish move down
SHORT🔥
✅Like and subscribe to never miss a new idea!✅
Disclosure: I am part of Trade Nation's Influencer program and receive a monthly fee for using their TradingView charts in my analysis.

XAU/USD (Gold) H1 Breakout (29.04.2025)The XAU/USD Pair on the H1 timeframe presents a Potential Selling Opportunity due to a recent Formation of a Breakout Pattern. This suggests a shift in momentum towards the downside in the coming hours.
Possible Short Trade:
Entry: Consider Entering A Short Position around Trendline Of The Pattern.
Target Levels:
1st Support – 3158
2nd Support – 3025
🎁 Please hit the like button and
🎁 Leave a comment to support for My Post !
Your likes and comments are incredibly motivating and will encourage me to share more analysis with you.
Best Regards, KABHI_TA_TRADING
Thank you.

Heading into pullback resistance?XAU/USD is rising towards the resistance level which is a pullback resistance that lines up with the 23.6% and the 50% Fibonacci retracement and could reverse from this level to our take profit.
Entry: 3,275.29
Why we like it:
There is a pullback resistance level that line sup with the 23.6% and the 50% Fibonacci retracement.
Stop loss: 3,350.60
Why we like it:
There is a pullback resistance level that lines up with the 50% Fibonacci retracement.
Take profit: 3,168.44
Why we like it:
There is a pullback support level that aligns with the 61.8% Fibonacci retracement.
Enjoying your TradingView experience? Review us!
Please be advised that the information presented on TradingView is provided to Vantage (‘Vantage Global Limited’, ‘we’) by a third-party provider (‘Everest Fortune Group’). Please be reminded that you are solely responsible for the trading decisions on your account. There is a very high degree of risk involved in trading. Any information and/or content is intended entirely for research, educational and informational purposes only and does not constitute investment or consultation advice or investment strategy. The information is not tailored to the investment needs of any specific person and therefore does not involve a consideration of any of the investment objectives, financial situation or needs of any viewer that may receive it. Kindly also note that past performance is not a reliable indicator of future results. Actual results may differ materially from those anticipated in forward-looking or past performance statements. We assume no liability as to the accuracy or completeness of any of the information and/or content provided herein and the Company cannot be held responsible for any omission, mistake nor for any loss or damage including without limitation to any loss of profit which may arise from reliance on any information supplied by Everest Fortune Group.
